
Recovery Factor Calculation for Smart Traders
Master the recovery factor calculation to measure a strategy's resilience. Learn the formula, see DeFi examples, and find top wallets with Wallet Finder.ai.

June 20, 2026


Wallet Finder
April 25, 2026

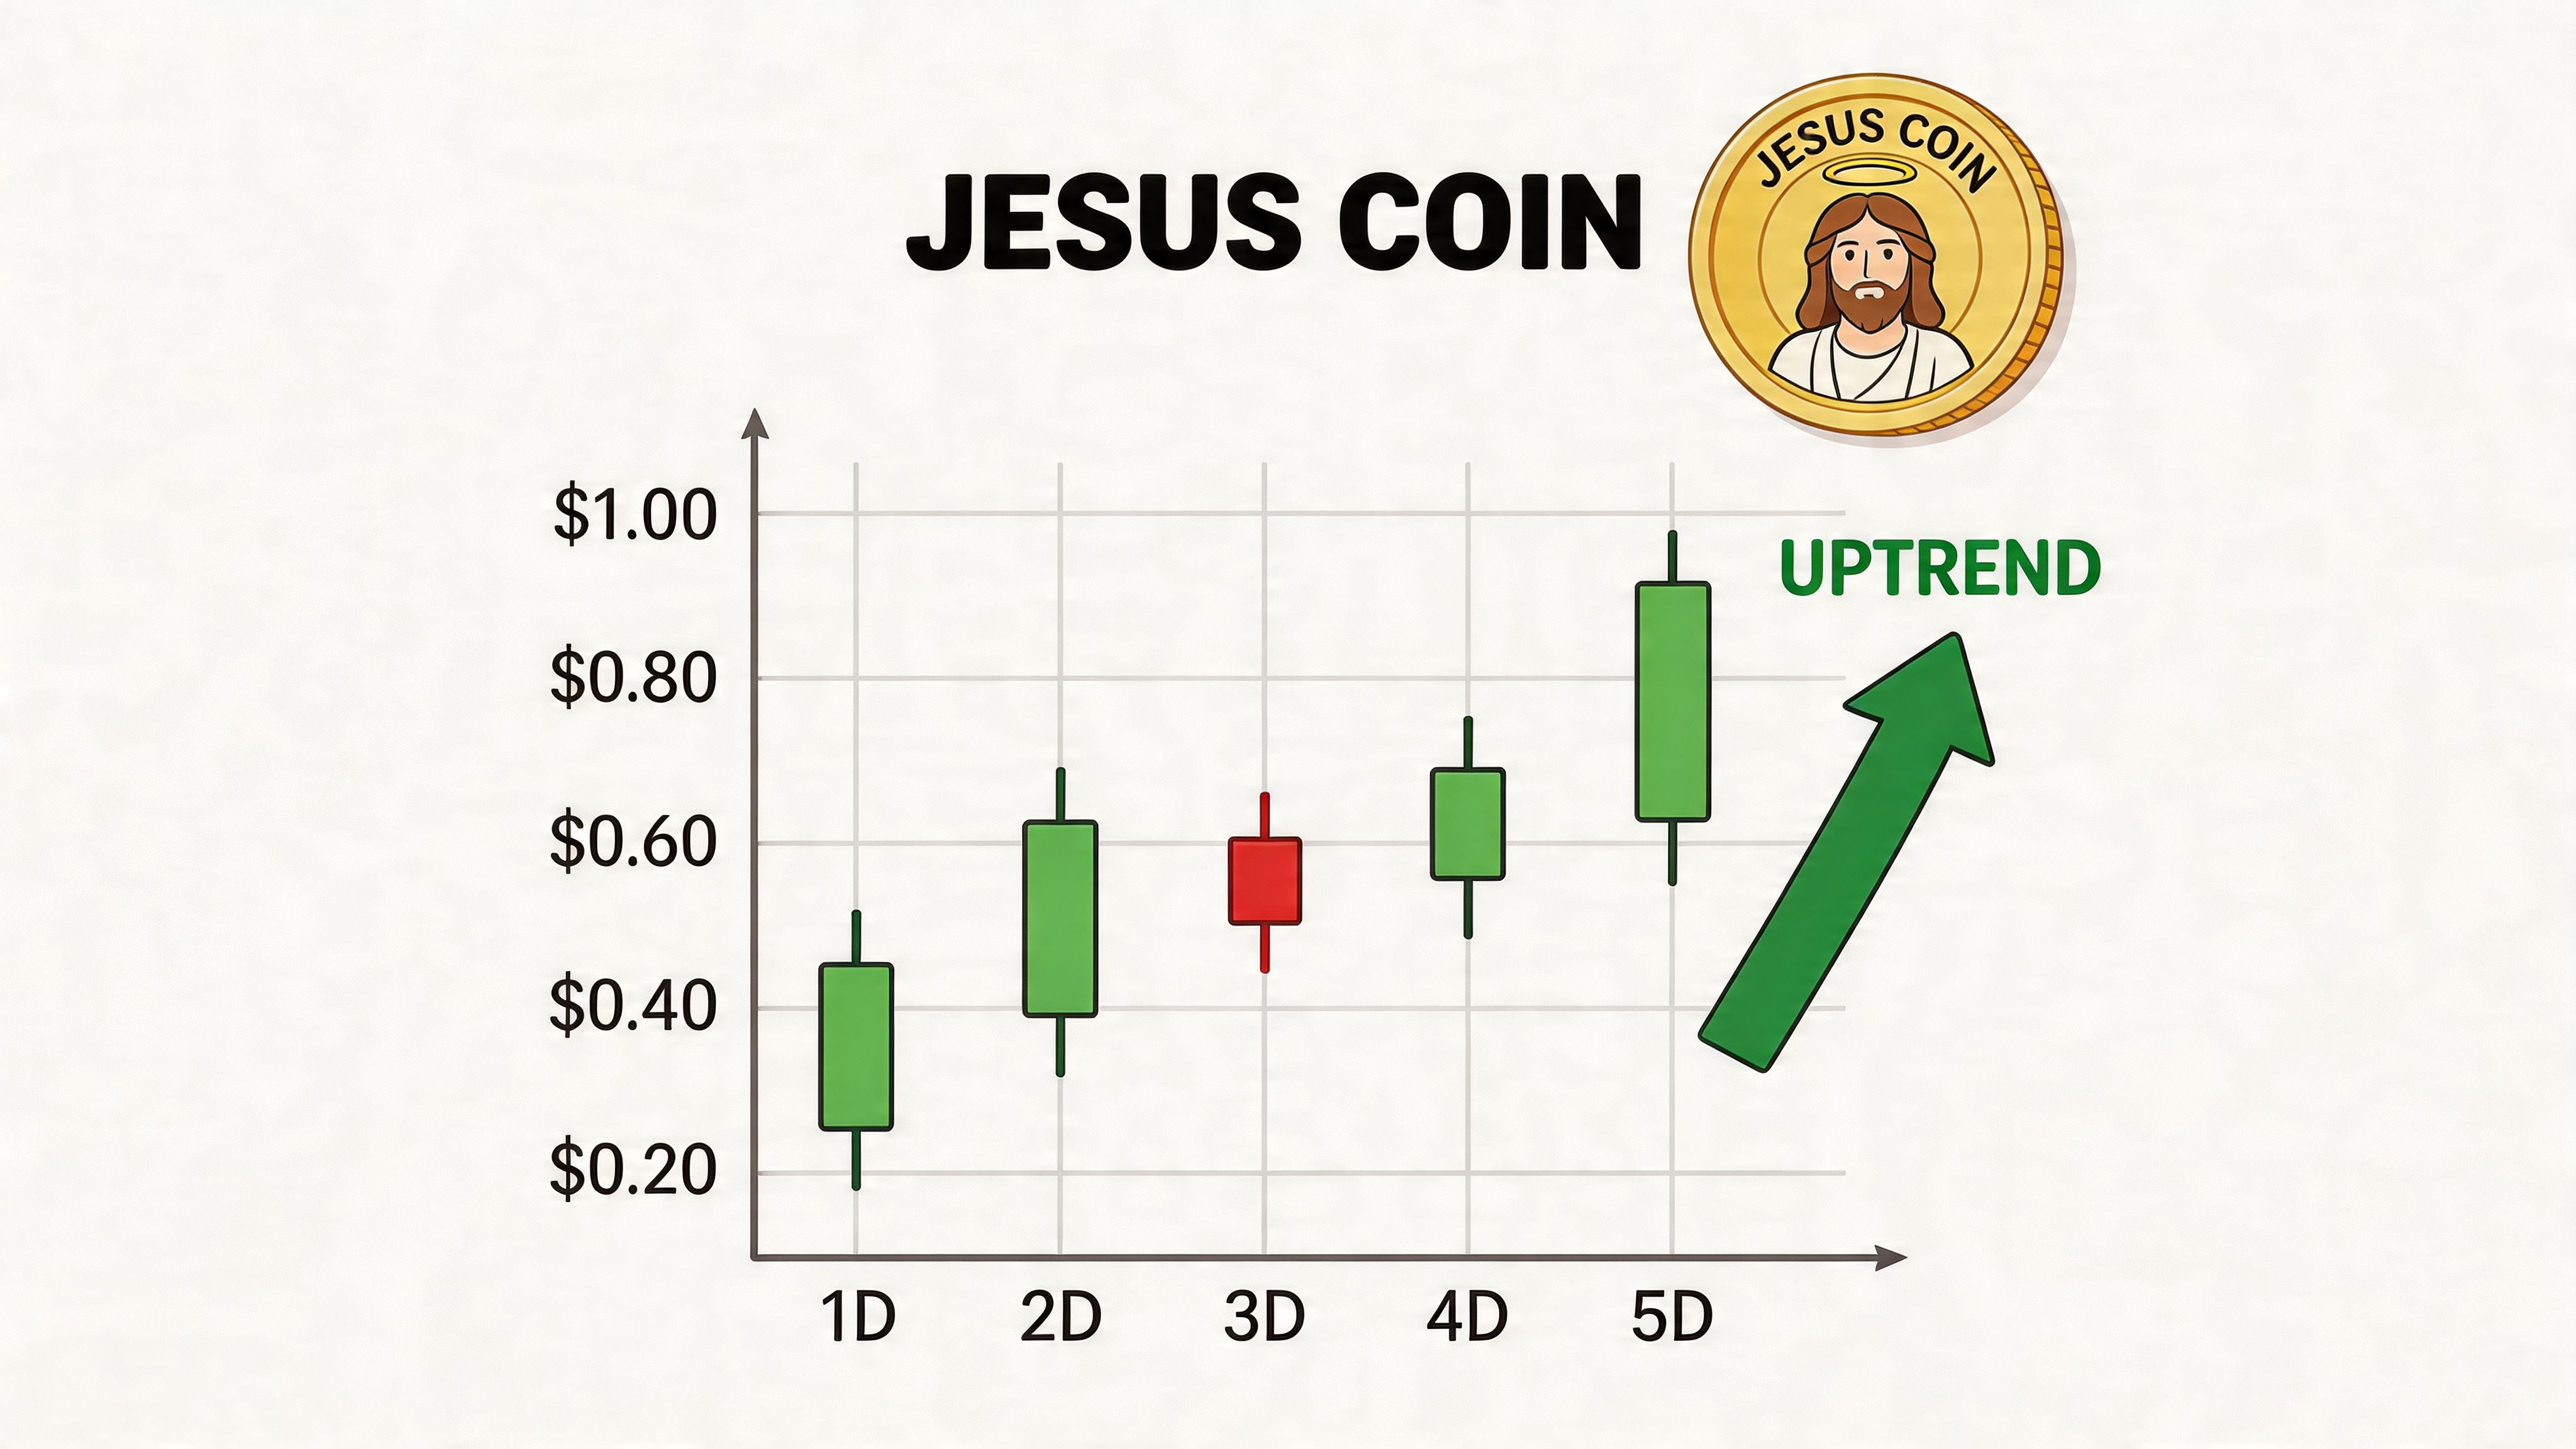
Jesus Coin nearly 5x'd from its launch price of $0.0000001 to an all-time high of $0.0000005796 in its early run, then gave back most of that move. That kind of path is common in memecoins, but it matters here because the chart alone does not tell you who drove the move, where liquidity resided, or which wallets exited before the collapse.
Jesus Coin trades like a flow asset. Price reacts to wallet concentration, fresh buyer velocity, and whether liquidity can absorb sells once attention fades. Traders who rely only on static price trackers usually arrive late.
The practical edge comes from on-chain reads. Track holder changes, watch for clustered buys from higher-signal wallets, and check whether smart money is adding into strength or distributing into retail momentum. Tools like Wallet Finder.ai help separate noise from real positioning, which matters more than headline price in a micro-cap meme trade.
The current jesus coin price sits in micro-cap territory. As of the latest market data, Jesus Coin trades at approximately $0.000000015 to $0.00000001613, with a market capitalization of $2.208M to $2.42M and a ranking around #1519 on major trackers, based on Kraken price data for Jesus Coin. That matters because micro-cap memecoins trade differently from larger names. Liquidity is thinner, price discovery is weaker, and a small number of active traders can move the chart.
A few snapshot metrics stand out:
At this size, the jesus coin price is less about broad market efficiency and more about who is active right now. A single motivated buyer, coordinated social attention, or a whale exit can distort short-term price action.
Practical rule: Treat JESUS like an execution-sensitive trade, not a passive investment.
The useful takeaway isn't whether the token looks cheap on a nominal per-token basis. That number is mostly irrelevant because supply is massive. What matters is whether liquidity can absorb your size, whether active wallets are accumulating, and whether the token still has enough attention to sustain follow-through after a move begins.
A move from roughly $0.0000001 to $0.0000005796 is a 4.796x run, not 4,796x. That correction matters because memecoin charts already distort perception. If the base math is wrong, the trade thesis usually is too.
JESUS still followed a familiar path. It launched into thin liquidity, caught a strong narrative bid, went near-vertical, and then spent months giving back most of that move. Traders see this pattern constantly in low-float meme names on Ethereum. The edge comes from spotting where the cycle is changing before the crowd does.
The first leg in a token like JESUS rarely looks clean in real time. Volume is patchy, wallet concentration is high, and a small cluster of active buyers can force fast repricing. Price history alone does not tell you whether that move came from broad demand or a handful of wallets taking turns pushing the pair higher.
That is the practical difference between reading a chart and reading the chain.
Instead of anchoring on the launch price, track who accumulated before attention expanded. If a few early wallets built size and then stopped adding, the setup is different from one where new wallets kept entering during the climb. Traders who want context should understand what liquidity means in crypto before treating an early breakout as proof of durable demand.
Parabolic phases feel strongest right before they fail. On-chain, the signs are usually visible before the chart fully breaks. Early wallets start trimming into strength. New buyer quality gets worse. Trade count may stay active while conviction drops because smaller wallets are replacing larger ones.
That is usually the handoff from accumulation to distribution.
For JESUS, the important lesson is not that hype can send an illiquid token far above fair value. Traders already know that. The useful takeaway is that exit liquidity often arrives disguised as momentum. If smart money wallets are reducing exposure while social activity is accelerating, late longs are often funding those exits.
In memecoins, the best entries usually happen before the story spreads, and the best exits often happen while the story still sounds strong.
After the peak, these tokens often enter a slow decline that traps traders more effectively than a single crash. Sharp bounces create hope. Holder count may look stable enough to keep interest alive. But if the wallets that drove the first expansion are inactive or rotating elsewhere, price can grind lower for much longer than dip buyers expect.
Wallet-level analysis matters more than static price tracking. A chart can show drawdown. It cannot show whether experienced traders are re-entering, whether prior winners are distributing into every bounce, or whether fresh accumulation is happening at all. Tools like Wallet Finder.ai are more useful here than another price widget because they let you watch the wallets that drove the token during its strongest phase.
A practical lifecycle framework for JESUS looks like this:
Read JESUS through that sequence and the chart becomes easier to trade. The point is not to predict miracles. The point is to identify which wallets are buying, which wallets are selling, and whether the current move is real demand or recycled hype.
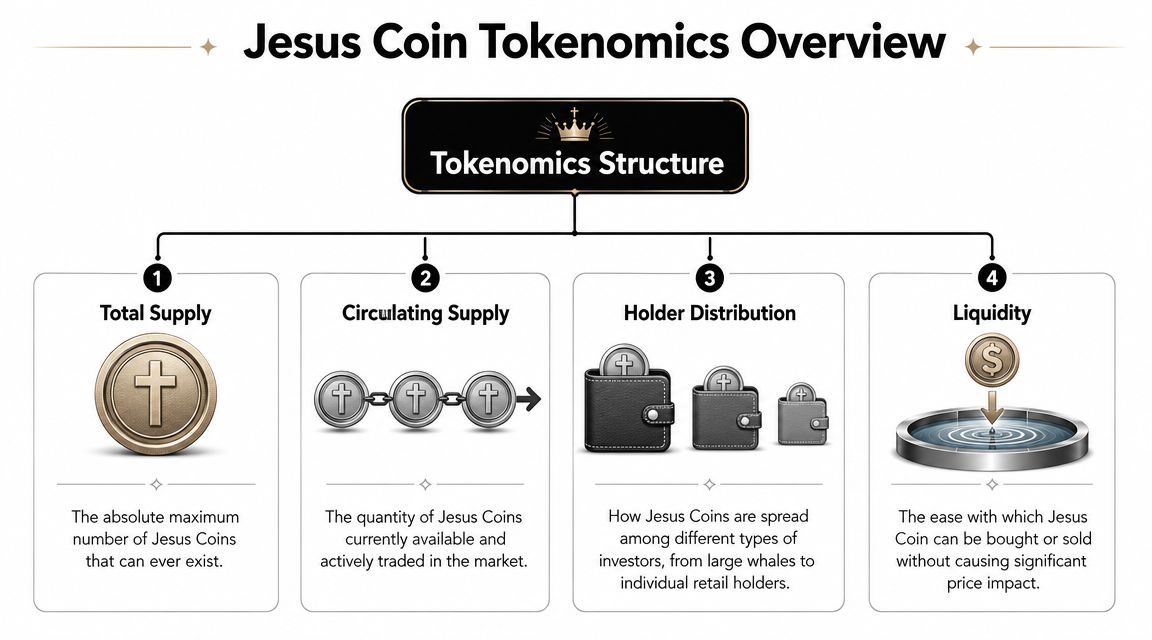
Tokenomics won't tell you whether a memecoin will pump tomorrow. It will tell you how dangerous the trade becomes once volatility returns. For JESUS, liquidity is the first thing to respect.
Jesus Coin trades primarily on Uniswap V2 (Ethereum), where 94.01% of recent volume came through that venue, totaling $32,398 in 24 hours, paired with WETH at $0.000000074, according to CoinGecko's Jesus Coin market page. The key point is simple. Low liquidity amplifies whale impact.
| Metric | Value |
|---|---|
| Primary trading venue | Uniswap V2 (Ethereum) |
| Share of recent volume | 94.01% |
| Recent 24h volume | $32,398 |
| Main pair | WETH |
| Pair reference price | $0.000000074 |
| Circulating supply across sources | 151T to 160T |
| Approximate market cap across sources | Around $2.3M |
If you need a plain-English refresher on why this matters, this guide on what liquidity means in crypto is worth reading before you size a trade.
On a liquid market, a chart can absorb normal trading flow. On a thin market, execution becomes part of the thesis. Buy too aggressively and you become the pump. Sell too late and your own exit worsens the move against you.
Three practical implications follow:
The reported supply range is enormous, and holder counts don't remove concentration risk by themselves. In memecoins, the headline number of holders matters less than who controls the meaningful size.
A memecoin can look active on the surface and still be dominated by a small number of wallets underneath.
That's why static tokenomics should never be the final layer of analysis. They tell you where fragility exists. They don't tell you when that fragility will be exploited. For that, you need wallet-level flow.
Technical indicators give you context. They don't give you priority. With JESUS, that distinction matters because the chart can look stable right before a wallet-driven move.
Jesus Coin's short-term technical picture is weak. The 14-day RSI is 44.785, which is categorized as a sell signal, while price is trading above both the 50 and 200-period moving averages, leaving the broader setup neutral rather than clearly directional, according to Investing.com's technical page for Jesus Coin.
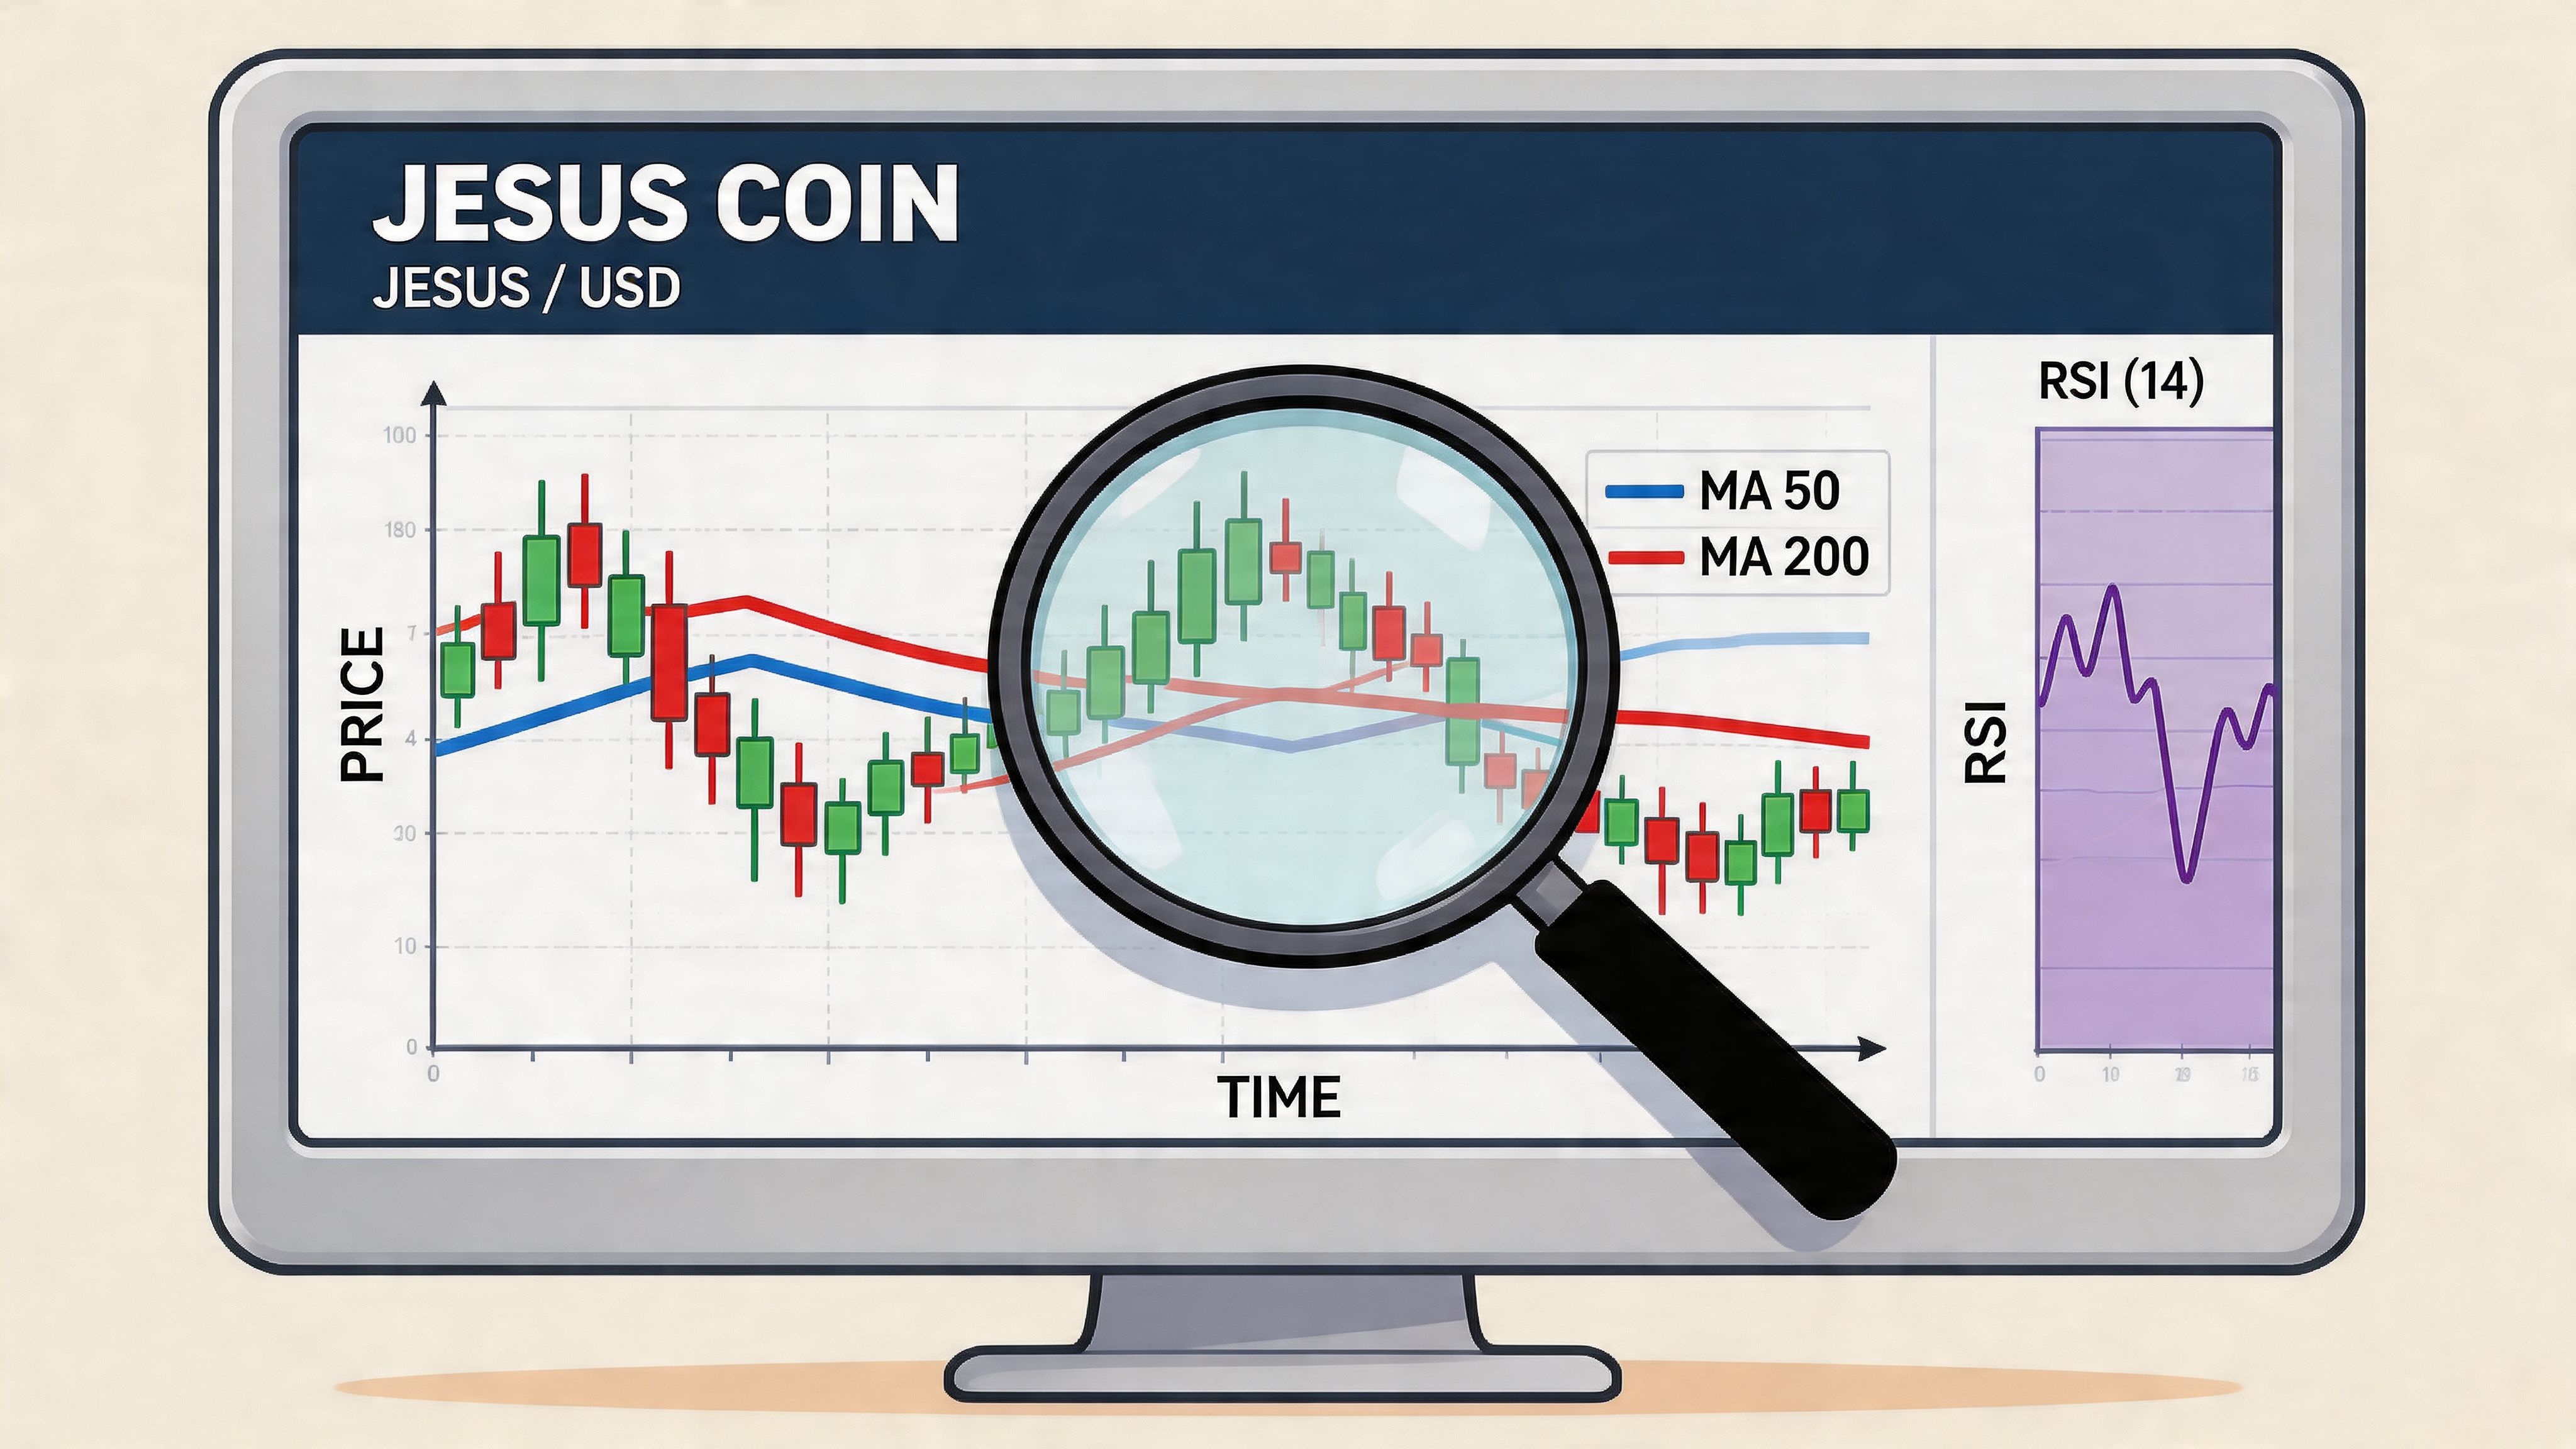
An RSI in the mid-40s doesn't scream capitulation, and it doesn't show strong momentum either. It's a weak reading inside a market that already lacks conviction. The moving averages don't solve that problem. If price is above both but momentum remains soft, you have a neutral chart with uncertain intent.
That kind of setup often traps traders who rely on chart patterns alone.
For illiquid memecoins, chart signals often arrive after the meaningful decision has already been made by a few wallets. That's why I treat on-chain flow as the leading layer and technicals as the confirming layer.
Focus on these signals first:
A practical workflow is to check on-chain data before taking a memecoin trade, then use the chart only to refine timing.
Here's a quick explainer that fits this market structure:
The current technical setup tells me not to chase price action by itself. A bearish short-term momentum reading plus a neutral trend backdrop usually means the cleaner edge comes from watching wallet behavior around key levels, not from predicting a breakout because a line crossed another line.
If you're trading JESUS, the chart is the map. Wallet flow is the driver.
If you're going to trade JESUS, execution discipline matters more than theory. This isn't the kind of token where you click buy and assume the market will give you a fair fill.
Start with the basics:
Verify the contract address
Use the token page on the venue you're trading through, then cross-check it on the block explorer. Never search the ticker alone and assume the first result is correct. Memecoin copycats show up fast.
Use the main trading venue
JESUS trades primarily on Uniswap V2, so that's the first place many traders will check for live liquidity. For a low-liquidity token, the active pool matters more than convenience.
Fund the wallet you plan to use
Keep enough ETH in the wallet for swaps and for any adjustment transaction if you need to cancel or replace one.
Execution on a thin pool is where many traders lose edge.
Most traders underestimate exits. Buying a memecoin feels easy during a bounce. Selling into weakness is where the structure gets exposed.
Use a plan:
The right trade size in a low-liquidity memecoin is the size you can exit without panic.
The jesus coin price can move on very little flow. That's why operational details matter so much. Correct contract, measured size, realistic slippage, and a planned exit are what keep a speculative trade from turning into a costly mistake.
JESUS is a high-risk asset. Not in the abstract, and not because all crypto is volatile. It's high risk for specific structural reasons that traders should respect before they commit capital.
A few habits consistently fail in names like this:
Risk management in memecoins is mostly about staying flexible.
Consider this checklist:
Respect the possibility that a memecoin can be tradable without being investable.
That's the cleanest way to frame JESUS. If you're active, nimble, and data-driven, there may be opportunities. If you're passive, oversized, or emotionally attached, the structure works against you.
A static price chart misses the part of JESUS that matters most to active traders. Wallet behavior usually shifts before the chart looks obvious, especially in a memecoin where a few coordinated entries or exits can change short term direction fast.
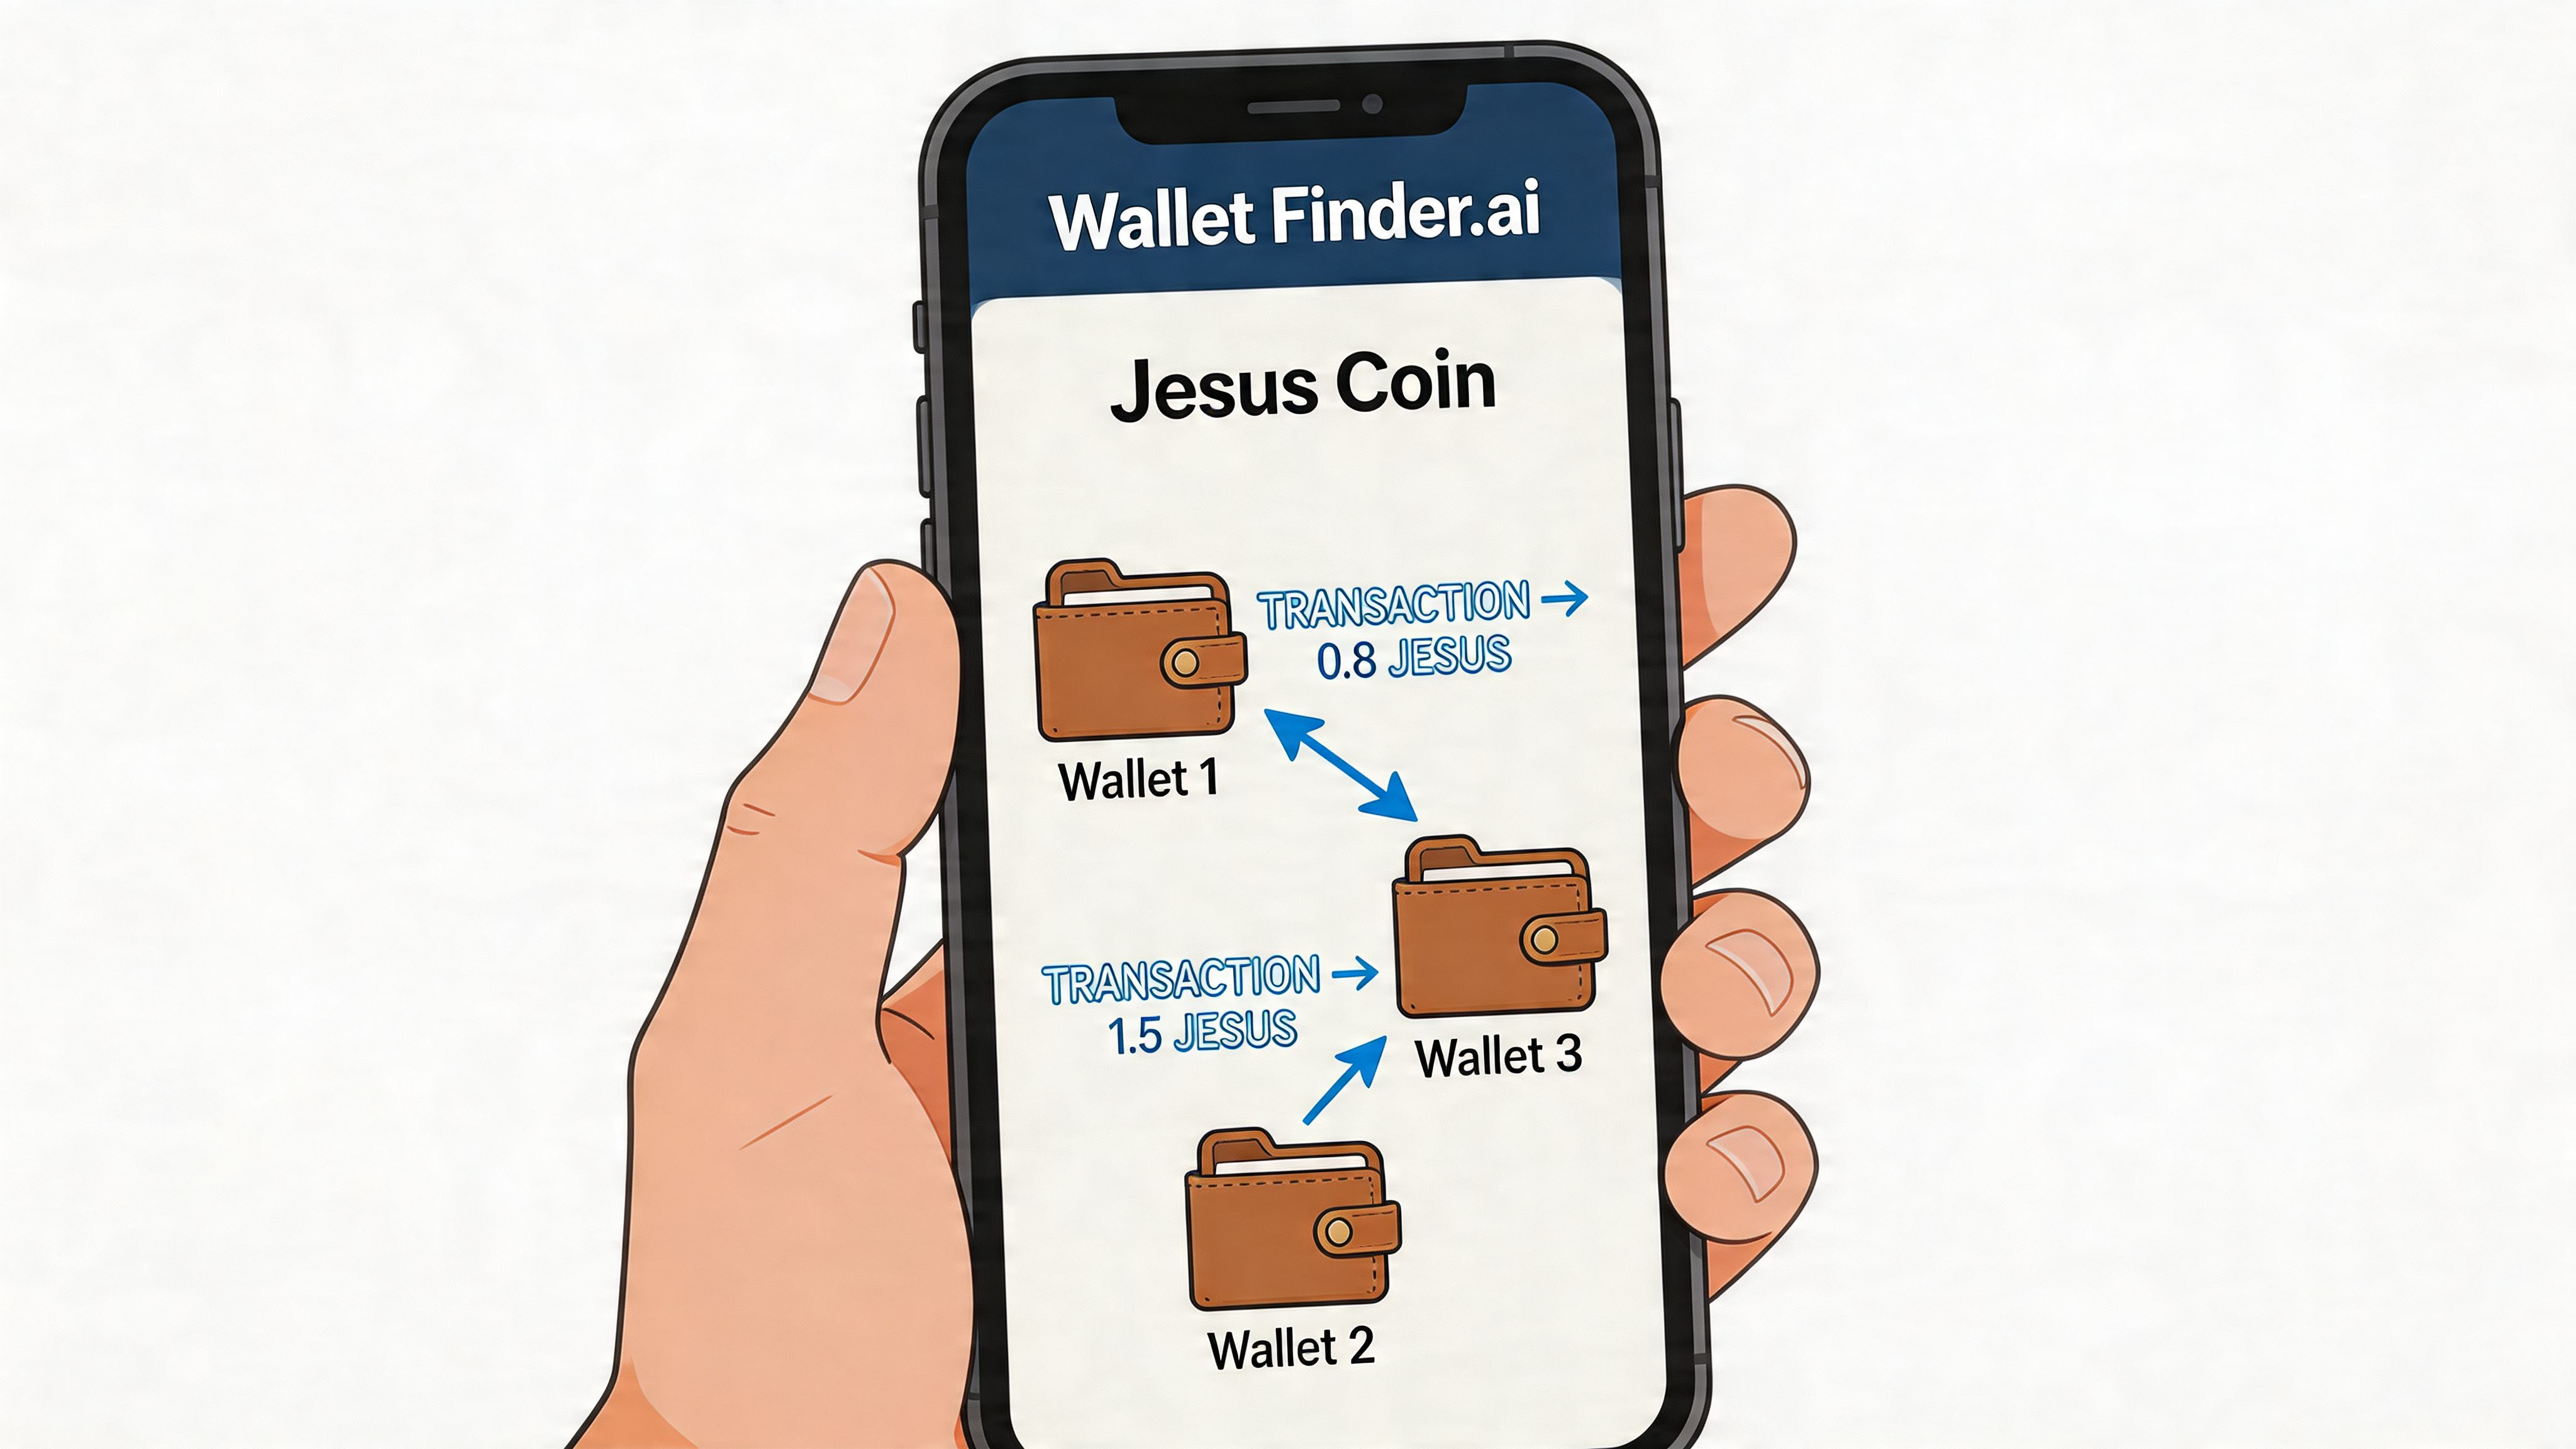
Use Wallet Finder.ai's smart money tracking tools to monitor who is entering JESUS, who is distributing into strength, and which wallets keep showing up early rather than late.
Start with the verified JESUS contract, not ticker search alone. Memecoin tickers get copied, and contract verification saves time and prevents bad entries into lookalikes.
Once the token page is open, check the flow first.
Focus on:
Wallet selection decides whether your feed is useful or noisy. A wallet with one outsized win is less helpful than a wallet with repeatable execution across multiple trades.
The better candidates usually show a few things in common:
Trade logs, realized PnL, and entry timing matter more than public persona. For JESUS, I would rather track a wallet with consistent, modest wins than one headline hit followed by messy exits.
The goal is not to copy every trade. The goal is to find wallets that improve your timing.
A focused watchlist turns isolated transactions into a sequence you can trade around. One wallet entering can be noise. Two or three proven wallets building exposure within a short period can signal a real setup.
That watchlist is most useful when it is narrow. Track wallets that trade memecoins well, react quickly, and have shown they can exit before liquidity fades.
Alerts matter because JESUS can move before manual checks catch up. Set alerts around behavior that has clear trading value, not every transfer.
Useful alert conditions include:
That process gives you something better than another quote page. You get a working view of participation, timing, and conviction. For a token like JESUS, that is often the difference between spotting a trade early and arriving after the move is already crowded.
Jesus Coin is a meme first. Any miracle outcome depends on timing, execution, and information advantage.
The historical move proves that massive upside can happen in a token like this. The current structure proves that downside and stagnation can last much longer than traders expect. That's the trade-off. JESUS can produce explosive speculation, but it doesn't forgive lazy process.
For most market participants, this isn't an investment in the traditional sense. It's a tactical trade in a fragile, attention-driven asset. If you approach it with static charts, headline prices, and oversized positions, you're gambling. If you approach it with verified contract checks, liquidity awareness, wallet tracking, and strict exits, you're at least operating with a method.
The jesus coin price isn't best understood as cheap or expensive. It's best understood as reactive. It reacts to liquidity, to holder behavior, and to bursts of narrative energy.
That doesn't make it untradable. It makes it selective.
If you want to trade JESUS with better context, use Wallet Finder.ai to track profitable wallets, monitor token flows, and spot smart-money activity before it reaches the broader market.

A premier DeFi analytics platform empowering traders to discover and analyze profitable blockchain wallets, trades and tokens.

