
Recovery Factor Calculation for Smart Traders
Master the recovery factor calculation to measure a strategy's resilience. Learn the formula, see DeFi examples, and find top wallets with Wallet Finder.ai.

June 20, 2026


Wallet Finder
March 8, 2026
The crypto funding rate is a small, periodic payment that traders exchange in perpetual futures markets. Its entire job is to keep the futures contract price tightly tethered to the actual spot price of a cryptocurrency.
Crucially, this is not a fee you pay to the exchange. It's a direct payment between traders holding long (buy) positions and those holding short (sell) positions.
Think of a perpetual futures contract like a satellite that must maintain a perfect orbit around its planet—the crypto's spot price. The funding rate is the invisible force making constant, tiny adjustments to pull that satellite back into alignment whenever it drifts. Without it, the contract price could float off into space, becoming completely detached from the asset's real-world value.
This balancing act happens directly between traders. Picture a playground seesaw. If a crowd of traders jumps on one side (going long, betting the price will rise), that side gets heavy. To bring things back into balance, you need to entice some people to move to the other side. The funding rate is that incentive: the people on the heavy (long) side pay a small fee to those on the light (short) side.
At its core, the funding rate is a vital sign of the derivatives market. It serves two main purposes:
It's important not to confuse funding rates with standard trading fees. Trading fees go to the exchange for processing your order. The funding rate, on the other hand, is a peer-to-peer payment that reflects the real-time balance of bullish versus bearish pressure. For a deeper look into market dynamics, our guide on on-chain analysis offers signals that perfectly complement what funding rates tell you.
The direction of the payment instantly reveals a story about market sentiment. This makes it one of the most direct ways to gauge the collective mood of leveraged traders.
The crypto funding rate is a real-time sentiment gauge. A positive rate signals bullish optimism, while a negative rate points to bearish pessimism, offering a clear window into the market's collective psychology.
To break it down, here’s a quick reference table to help you understand what each funding rate scenario means for your trades.
When the funding rate is positive, longs pay shorts. This reflects bullish sentiment — more traders are betting on a price increase, creating an imbalance that the funding mechanism corrects by charging the heavier side. If you're holding a long position, you'll pay a small periodic fee. If you're short, that same fee lands in your account as income.
When the rate turns negative, the dynamic reverses. Shorts pay longs, signaling that bearish sentiment has taken over and more traders are positioned for a price decline. In this environment, long holders receive a small payment each interval, while short holders bear the cost of maintaining their position.
In short, the sign of the funding rate—positive or negative—gives you a powerful clue about whether the market is feeling overly greedy or fearful.
To really get what's going on with the crypto funding rate, you have to look under the hood. Think of it like a recipe with two main ingredients. When they're mixed, you get the final rate that traders see on their screens. It’s not some arbitrary number; it’s a carefully calculated figure meant to mirror what’s happening in the market right now.
At its core, the funding rate formula is surprisingly simple. It’s basically the sum of the Interest Rate Component and the Premium Index. Each one has a specific job in keeping the perpetual contract price tethered to the actual spot price.
First up is the Interest Rate Component. This part is usually fixed and simply accounts for the difference in borrowing costs between the two assets in a trading pair. For a BTC/USD contract, it reflects the gap between the interest for borrowing Bitcoin versus borrowing US dollars. It’s part of the official formula, but it rarely has the biggest say in the final rate.
The second, and far more influential, ingredient is the Premium Index. This is the dynamic piece of the puzzle. It measures the price difference—or spread—between the perpetual contract and the asset's spot price. When the contract is trading at a premium (higher than spot), this index goes positive, pushing the funding rate up. If it's trading at a discount (lower than spot), the index turns negative, dragging the rate down with it.
The Core Formula: Funding Rate = Premium Index + clamp(Interest Rate - Premium Index, 0.05%, -0.05%)
This formula is set up so that the premium index is always the main driver. The interest rate just provides a baseline, and that "clamp" function is there to stop the rate from getting too wild in either direction. The result is a number that gives you a clean read on the tug-of-war between buyers and sellers.
Let's walk through a quick, hypothetical scenario to see how this all clicks together.
Picture this market setup for a BTC/USD perpetual contract:
Because the rate is positive, traders holding long positions will pay a small fee to those holding short positions. It’s the market’s way of nudging things back toward balance. This infographic gives a great visual of how those payments flow depending on market sentiment.
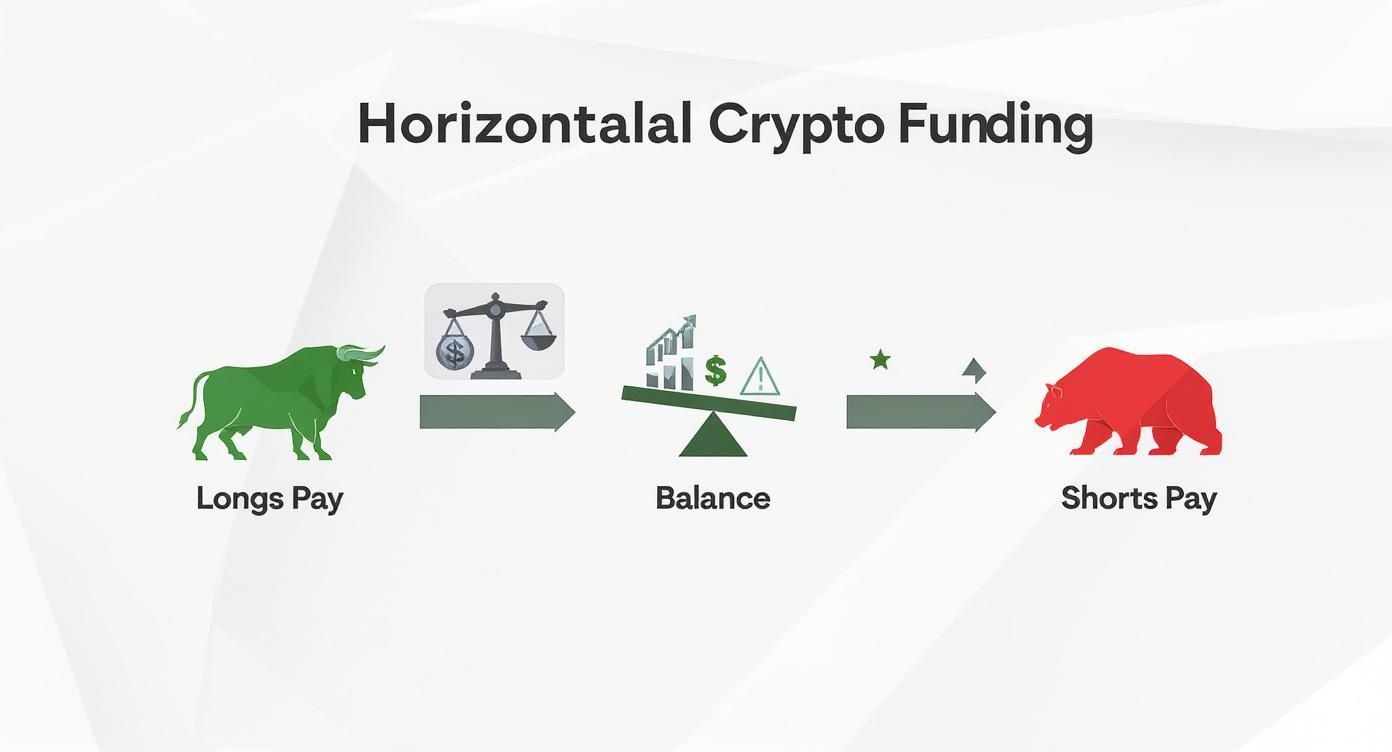
As you can see, payments shift from longs to shorts when the market is bullish and from shorts to longs when it's bearish, all to keep things in equilibrium.
Most major exchanges, like Binance and Bybit, calculate and settle these funding payments every eight hours. This creates a predictable rhythm that traders can plan around, anticipating the costs or earnings tied to their open positions.
Think of the crypto funding rate as a real-time barometer for market sentiment. It's more than just a fee mechanism; it’s a powerful window into the collective mindset of traders, offering clues about what the market might do next. Learning to read it is like learning to read the weather before a storm.
When the funding rate is consistently positive, it means traders with long positions are paying those with short positions. This is a dead giveaway for bullish sentiment. Demand for leveraged long positions is high, and traders are willing to pay a premium to bet on prices going up.
On the flip side, a negative funding rate tells the opposite story. When shorts pay longs, it’s a clear sign of dominant bearish sentiment. The market is flooded with sellers who believe prices will fall, and they're paying to keep their short positions open.
Interpreting these signals correctly can give you a serious edge. For example, a persistently high positive funding rate often crops up right before a market top. It’s a classic sign of greed, showing that too many traders are piling into leveraged longs. This makes the market extremely fragile and vulnerable to a sharp correction or a cascade of liquidations.
We break down exactly how those events unfold in our detailed guide on crypto market liquidations.
Conversely, a deeply negative funding rate can be a powerful contrarian indicator. This usually happens after a major price crash when fear is peaking. It can signal that sellers are exhausted—a moment known as market capitulation—which often creates the perfect setup for a price reversal or a relief rally.
A crypto funding rate isn't just a number; it's the collective voice of the market whispering its next potential move. High positive rates often scream "greed," while deeply negative rates whisper "fear."

To get the full story, it's best to look at aggregated data, not just a single exchange. The open interest-weighted funding rate for Bitcoin gives you a global snapshot of what everyone is thinking. You can find this data on platforms like CoinGlass.
Historically, the average 8-hour funding rate for BTC perpetuals hovers between 0.01% and 0.03% in calm markets. But during the crazy run-up to Bitcoin's all-time high near $69,000 in November 2021, rates shot above 0.05% as traders went all-in on leverage. During the 2022 bear market, rates were mostly negative or flat, reflecting widespread caution. The open interest-weighted metric is key because it gives more weight to giants like Binance and Bybit, helping you spot when the market is overheated or scraping the bottom.
To help you quickly interpret these signals, here’s a handy reference table.
This table breaks down different funding rate scenarios and what they likely mean for market behavior.
Here's the table rewritten as prose:
When the funding rate is high and positive — above 0.05% — the market is signaling extreme greed. Longs are paying shorts, the trade is overcrowded on the buy side, and the market is at elevated risk of a correction or long squeeze. At this stage, taking profit on existing longs or beginning to scout short opportunities is worth serious consideration.
A moderate positive rate, sitting between 0.01% and 0.05%, tells a healthier story. Longs are still paying shorts, but the sentiment reflects a sustainable uptrend rather than hysteria. This is the environment where trend-following long strategies tend to perform well, with sustained buying interest providing a reasonable tailwind.
When the rate hovers near zero, the market has shifted into indecision. Payments in either direction are minimal, and the collective positioning of traders reflects a wait-and-see attitude. The right move here is usually patience — hold off on large new positions and wait for a directional breakout or a more decisive signal before committing capital.
A negative funding rate flips the dynamic entirely. Shorts are now paying longs, meaning bearish sentiment dominates and sellers are in control. If the rate drops deeply negative — particularly after a sharp price decline — it can signal capitulation, the point where fear peaks and exhausted sellers begin to exit. Contrarian traders watch this zone closely for early long entry signals on any sign of a reversal.
Looking back at past market cycles shows just how predictive these rates can be.
By studying these historical patterns, you can get a much better feel for market psychology and start making moves based on sentiment, not just price charts.

Knowing what the funding rate means is one thing, but actually turning that knowledge into profitable trades is a whole different ballgame. Let's move from theory to practice and break down two powerful strategies that use funding rate signals to find opportunities you might otherwise miss.
The first is a market-neutral approach that’s all about capturing small inefficiencies. The second is a psychological play, betting against moments of extreme market emotion. Both demand discipline and a solid game plan.
Funding rate arbitrage is a classic market-neutral strategy that profits from the difference in funding rates for the same contract across different exchanges. Because every exchange has its own unique mix of traders, the balance between longs and shorts—and therefore the funding rate—can drift apart. That drift is where the opportunity lies.
The core idea is simple: collect funding payments while sidestepping the asset's price volatility entirely.
Here’s how you can execute this strategy, step-by-step:
This strategy is a favorite among crypto hedge funds. For instance, on any given day, Kraken's BTC perpetual funding rate might be 0.0148% per 8 hours while Binance is sitting at 0.0100%. This creates a spread of 0.0048% per funding interval, which firms exploit by going long on Binance and short on Kraken to pocket the difference.
Contrarian trading is all about using extreme funding rates as a sign of market hysteria—and then betting against the crowd. The philosophy here is that when sentiment hits a fever pitch, whether it’s irrational greed or blind panic, the market is stretched thin and ready for a reversal.
An extremely high funding rate is the market screaming that it's overleveraged and euphoric. A deeply negative rate is a cry of capitulation. A contrarian trader listens for these signals to enter when others are most emotional.
This approach requires patience and a bit of a strong stomach, as you’re deliberately stepping in front of a moving train.
By mastering these strategies, you can turn the crypto funding rate from a simple data point into a core pillar of your trading toolkit.
Funding rates can be a great source of trading ideas, but ignoring the risks is a fast way to drain your account. Think of a high positive funding rate as a hidden tax on your long positions. It slowly bleeds your capital with every eight-hour payment cycle.
Managing this risk isn't just about playing defense; it's a crucial part of trading perpetuals with any real confidence.
Smart traders always factor these payments into their game plan. This means you need to calculate your cost of carry—the total expense of keeping a position open over time. If a funding rate is sky-high, you have to ask yourself: will my potential profits from the price move even cover these recurring fees?
To get a handle on this, you have to treat funding payments like a business expense and build them directly into your profit and loss (P&L) projections.
Here’s a quick and dirty way to estimate the cost:
That 0.45% is the minimum profit you need just to break even on funding costs. If your total profit target is only 1%, a 0.45% fee completely changes your risk-to-reward calculation.
For a deeper look at managing your money in these fast-moving markets, check out our complete guide on position sizing for high-volatility trades.
Not all big funding rates are what they seem. Sometimes, a juicy rate is actually a funding rate trap, hiding nasty surprises like poor liquidity or extreme market risk. A massive positive rate might signal that the market is dangerously greedy, making your long position a prime target for a sudden, brutal reversal.
Be skeptical of unusually high funding rates. They often scream market instability, not sustainable opportunity. What looks like an easy arbitrage play could just be a trap set by low liquidity or incoming volatility.
Crypto funding rates are famous for their wild swings. During the 2020 bull run, Bitcoin funding rates on some exchanges regularly spiked past 0.1% every 8 hours as bulls levered up. But those rates were a flashing red light for an overheated market.
When the price eventually crashed by over 30% in May 2021, rates flipped hard into the negative, hitting lows like -0.15% as panicked traders rushed for the exits. You can see more of this history on Bitcoin funding rate history on Coinalyze.net.
To keep your capital safe, make these habits part of your routine:
We’ve pulled back the curtain on crypto funding rates, showing you they’re much more than a simple fee. Think of them as a powerful, multi-dimensional tool for smarter trading. When you move beyond just looking at price charts, you start to see the market's hidden currents, which is where the real opportunities are.
Everything we've covered gives you a serious leg up on traders who are only reacting to price action. You now understand how this mechanism keeps perpetual contract prices from flying off into their own orbit, away from an asset’s true value. More importantly, you can see it for what it is: a real-time barometer of market sentiment, pointing out moments of extreme greed or fear.
Knowing what the funding rate is is one thing; using it is another. The real power comes from turning this data into actionable strategies. We've walked through two key approaches that do just that:
Weaving these strategies into your routine is what takes your analysis from basic to truly strategic.
The ultimate edge in trading doesn't come from a crystal ball. It comes from deeply understanding the market's psychology right now. The crypto funding rate is one of your clearest windows into that collective mindset, flashing signals that price charts simply can't show you.
The takeaway here is simple: use this knowledge. Use it to get a better read on market moves, manage your risk like a pro, and trade with more confidence. By mastering the crypto funding rate, you’re not just a passenger in the market; you're actively interpreting its behavior. That deeper understanding is what builds a lasting edge, helping you navigate the wild world of crypto derivatives with skill.
Most guides treat the crypto funding rate as a single, uniform mechanism — a percentage that you either pay or receive depending on whether you hold a long or short position. That framing is accurate for the most common contract type, but it omits a critical structural distinction that changes the real-world cost and income from funding payments in ways that matter significantly for position sizing and risk management.
Perpetual contracts come in two fundamental structures: linear (USDT-margined) perpetuals and inverse (coin-margined) perpetuals. The funding rate percentage displayed on your exchange might be identical across both contract types, but what that percentage actually costs or earns you in dollar terms is not the same — because the two structures denominate your margin, your PnL, and your funding payments in different currencies.
A linear perpetual — also called a USDT-margined or stablecoin-margined perpetual — is the more common structure on modern exchanges. In a linear contract, your margin is denominated in a stablecoin (typically USDT), your PnL is settled in stablecoins, and your funding payments are made or received in stablecoins. Everything is priced and settled in a stable fiat-equivalent unit.
This structure makes the math on funding costs straightforward and predictable. When the funding rate is +0.05% and you hold a long position with $10,000 in notional value, you pay $5 per 8-hour funding interval. That payment is debited from your USDT margin balance. Your exposure to the funded amount is stable regardless of what Bitcoin's price does between funding intervals — because the payment is in USDT, not in BTC.
Key advantages of linear contracts for funding rate strategies:
The stable-currency settlement of linear contracts makes them the preferred structure for funding rate arbitrage because the income from collected funding payments has no price exposure. Whether you are collecting funding as a short holder during a high-positive-rate environment or deploying a delta-neutral spot-perp carry trade, the stablecoin-denominated payments land in your account with no additional price conversion risk. You know exactly how much you are earning or paying per interval before the interval begins.
Linear contracts also allow precise position sizing for cost-of-carry calculations. Since both the notional value and the funding payment are in the same currency unit, the arithmetic of calculating how much a position costs to hold over a given period is direct: funding rate multiplied by notional value multiplied by number of intervals. No currency conversion is required at any step.
Key risk specific to linear contracts:
In a linear perpetual, your margin is held in stablecoins that do not appreciate when the underlying asset rises. If you are running a directional long position and the price of Bitcoin rises significantly, your unrealized PnL increases in USD terms, but your margin — and the collateral backing your position — remains in USDT. This means the percentage of your position that is margin-backed actually falls as price rises and you don't add more collateral, which can increase liquidation risk in leveraged positions during strong uptrends unless you actively manage margin levels.
An inverse perpetual — also called a coin-margined or COIN-M perpetual — uses the underlying cryptocurrency itself as margin and settlement currency. If you are trading an inverse BTC/USD perpetual, your margin is denominated in BTC, your PnL is settled in BTC, and your funding payments are made or received in BTC.
This structure was the original architecture for crypto perpetuals, pioneered by BitMEX in 2016 before USDT-margined contracts became dominant. It remains popular among traders who hold significant BTC or ETH and want to use their existing holdings as collateral without selling them for stablecoins.
The funding rate percentage on an inverse contract works identically to a linear contract in terms of who pays whom and when. If the rate is positive, longs pay shorts. If negative, shorts pay longs. What changes is the currency of the payment and — critically — the size of that payment when converted to a stable dollar value.
The convexity effect in inverse perpetuals:
When your margin and funding settlement currency is BTC, the dollar value of any fixed BTC payment changes with Bitcoin's price. This creates a non-linear (convex) relationship between your position's dollar-denominated profitability and the price of the underlying asset.
Consider this scenario. You hold a short position in an inverse BTC/USD perpetual at a funding rate of +0.05%, collecting funding from long holders. The nominal BTC amount you receive per interval is fixed based on the contract's USD notional value. But if Bitcoin's price rises sharply between intervals, the dollar value of the BTC you receive as funding income also rises — and conversely, if Bitcoin's price falls, the dollar value of your BTC funding income falls with it.
For a trader running a delta-neutral strategy with an inverse perpetual, this convexity introduces a source of risk that does not exist in linear contracts. Your funding income, measured in dollars, is not actually stable — it fluctuates with Bitcoin's price even if the funding rate percentage is unchanged. In a rising market where you are short the inverse perpetual to collect funding, the dollar-value appreciation of Bitcoin also works against your short PnL. The interaction of these two effects is more complex to model and manage than the straightforward linear contract equivalent.
When inverse contracts make sense despite the complexity:
Traders who already hold large amounts of Bitcoin and want to generate funding income without converting to stablecoins often prefer inverse contracts because they can use their existing BTC as margin directly. The BTC-denominated funding payments they collect also accumulate in BTC, which they may prefer to hold. For traders with a long-term bullish view on Bitcoin who want to run a funding collection strategy, the coin-denominated settlement means their collected funding income participates in Bitcoin's appreciation — a potential enhancement when Bitcoin is trending upward that does not exist in stablecoin-settled linear contracts.
The practical recommendation for most retail traders and for all funding rate arbitrage strategies is to use linear (USDT-margined) contracts, because the settlement simplicity, predictable funding cost arithmetic, and absence of convexity risk make the strategy easier to construct, monitor, and exit cleanly. Inverse contracts reward deeper understanding of their non-linear dynamics and are best suited for traders who have intentional reasons to hold coin-denominated exposure.
To make the structural difference concrete, consider a trader who wants to collect funding by holding a short position during a high positive-rate environment where the 8-hour funding rate is +0.05% and the notional position size is equivalent to $100,000.
In a linear (USDT-margined) contract: The funding payment received per interval is $100,000 times 0.05%, which equals $50 USDT per 8-hour period. This $50 arrives in stablecoins and its value is independent of Bitcoin's price movement. Over three funding intervals in one day, the trader collects $150 USDT with no price exposure on the funding income itself.
In an inverse (coin-margined) contract: The funding payment received per interval is also 0.05% of the position's notional value, but settled in BTC. If Bitcoin is trading at $50,000, the $100,000 notional position is 2 BTC. The funding payment is 2 BTC times 0.05%, which equals 0.001 BTC per interval. At the current price of $50,000, that 0.001 BTC is worth $50 — identical to the linear contract. But if Bitcoin's price moves to $45,000 by the next interval, the same 0.001 BTC payment is now worth only $45. If it moves to $55,000, the payment is worth $55.
The linear contract delivers predictable dollar-equivalent income. The inverse contract delivers a variable dollar-equivalent income that moves with Bitcoin's price, requiring the trader to account for this variability in their risk model.
Every example in this guide so far has referenced centralized exchanges: Binance, Bybit, OKX, Kraken. This reflects where the majority of perpetual futures volume currently trades. But a significant and fast-growing segment of perpetual trading has moved on-chain, to decentralized perpetual exchanges like Hyperliquid, GMX, dYdX, and Drift Protocol. These platforms operate without centralized custody, execute trades through smart contracts on a blockchain, and allow traders to maintain self-custody of their collateral — but they do not simply replicate the CEX funding rate mechanism. Their funding rate systems have meaningful structural differences that create distinct risks and distinct arbitrage opportunities relative to CEX perpetuals.
Understanding how on-chain perpetual DEX funding rate mechanics differ from the CEX model is increasingly important for any trader active in DeFi, because the funding rate signals and strategies discussed earlier in this guide do not transfer directly from CEX to DEX contexts without adjustment.
On a centralized exchange, the mark price — the price used to calculate unrealized PnL and funding payments — is typically computed using a combination of the exchange's own order book and an index price derived from several external spot exchanges. The exchange has direct access to real-time data from its own order book and can update the mark price continuously without external dependencies.
An on-chain perpetual DEX faces a fundamental constraint: smart contracts running on a blockchain cannot natively access external price data. They require an oracle — a trusted external data feed that supplies the mark price from spot markets. Hyperliquid, for example, uses a validator-operated median oracle that aggregates prices across multiple spot exchanges and publishes them on-chain at defined intervals. dYdX uses Chainlink and other oracle providers. GMX uses a fast-update oracle from Chainlink with additional price manipulation protections.
This oracle dependency changes the funding rate dynamic in two important ways. First, there is inherent latency between the real-world spot price and the on-chain mark price used for funding calculations. When markets move rapidly, the oracle price may temporarily lag the true spot price by several seconds to a minute or more depending on the oracle's update frequency. During this lag, the calculated funding rate does not reflect the true premium or discount of the perpetual relative to current spot — it reflects the premium relative to a slightly stale spot price. Second, oracle design choices — including the aggregation method, the sources included, and the update frequency — create subtle but real differences in the mark price used across different on-chain perpetuals for the same underlying asset, which means funding rates are not directly comparable across DEX platforms even for the same token pair.
CEX perpetuals standardized on 8-hour funding intervals, settled three times per day at fixed UTC timestamps. This rhythm is so universal on centralized exchanges that many traders treat it as a fixed property of perpetual contracts. On on-chain DEXs, it is not fixed — and some platforms have moved away from interval-based settlement entirely.
Interval-based DEX funding: dYdX and Drift Protocol both use interval-based funding settlement similar to CEXs, though the specific intervals and calculation windows differ by platform. Drift, built on Solana, has used 1-hour funding intervals in some configurations — eight times more frequent than the standard CEX model. This higher frequency means funding costs and income accrue faster on a per-day basis at any given rate, which requires traders running duration-sensitive strategies to recalibrate their cost-of-carry arithmetic.
Continuous funding: Hyperliquid uses a continuous funding mechanism rather than discrete 8-hour settlements. In a continuous model, funding accrues and is applied to positions on every block rather than at fixed timestamps. The practical effect for the holder is similar — the rate is still expressed as an 8-hour equivalent percentage for comparability — but the settlement timing has implications for strategies that specifically target the payment window around a settlement timestamp. On CEXs, some traders close positions just before a funding interval to avoid paying and reopen immediately after to reduce funding costs on directional positions. This timing arbitrage is not applicable to continuously settling DEX perpetuals.
Variable funding rate caps and clamp parameters: The funding rate formula described earlier in this guide includes a clamp function that limits how far the funding rate can deviate from the interest rate baseline. On CEXs, Binance's standard clamp is bounded at ±0.05% per interval for most pairs, though this can vary by asset. On-chain DEXs set their own clamp parameters, which differ by platform and sometimes by the specific asset being traded. GMX uses a different mechanism entirely — rather than a symmetric funding rate between longs and shorts, it charges a borrowing fee on open interest that is asymmetric: only the larger side (long or short, whichever has more notional open interest) pays, and the payment goes to the liquidity pool rather than to the opposing position holders. This borrowing fee mechanism is structurally different from the peer-to-peer funding rate model and should not be treated as equivalent when building cross-platform strategies.
The existence of meaningfully different funding rates between CEX perpetuals and on-chain DEX perpetuals creates a cross-venue arbitrage opportunity analogous to the cross-CEX arbitrage strategy described earlier in this guide — but with additional operational complexity and risk that must be understood before attempting it.
The opportunity: When the funding rate for BTC perpetuals is +0.03% per 8 hours on Binance and +0.05% per 8 hours on Hyperliquid, a trader can go long BTC on Binance (paying the lower rate) and short BTC on Hyperliquid (collecting the higher rate), earning the 0.02% spread per interval while maintaining approximate price neutrality. This is structurally identical to cross-CEX funding rate arbitrage, but the on-chain leg introduces considerations that do not exist in the all-CEX version.
Operational differences and risks in CEX-to-DEX arbitrage:
On a CEX, entering and exiting a position is a sub-second operation with deep liquidity available at all hours. On an on-chain DEX, every position open and close is a blockchain transaction that requires gas fees, confirmation time (ranging from under a second on Solana to several seconds on Ethereum L2s), and is subject to network congestion. During periods of high blockchain activity, a position that needs to be adjusted quickly may face transaction delays that expose it to price risk during the window between intent and execution.
The collateral structures also differ. On a CEX, your USDT margin sits in the exchange's custodial account and is immediately accessible for position adjustments. On an on-chain DEX, your collateral is locked in a smart contract. While this gives you self-custody advantages, it also means that moving collateral between platforms requires on-chain transactions with associated fees and latency. For a cross-venue arbitrage strategy that requires rapid margin management, this is a meaningful operational constraint.
Liquidation mechanics differ on DEXs: On a CEX, liquidation is handled by the exchange's internal risk engine, which can close positions instantaneously against the order book. On an on-chain DEX, liquidation is typically handled by external liquidator bots that watch the blockchain for underwater positions and submit liquidation transactions. During network congestion, liquidation transactions may be delayed, potentially increasing slippage or creating scenarios where the liquidation price differs from the expected level. Understanding the specific liquidation mechanism of any on-chain DEX you use is essential before running leveraged positions there.
One underused application of on-chain DEX funding rates is as a cross-reference signal for the CEX funding rates most traders already monitor. When CEX and on-chain DEX funding rates for the same asset diverge significantly, this divergence itself carries information about market structure.
A CEX funding rate that is much higher than the equivalent on-chain DEX rate suggests that leveraged sentiment on centralized platforms is more extreme than in the on-chain community. This can reflect a retail concentration effect — if the on-chain trading community holds a more measured view of the asset's prospects than the CEX crowd, the CEX's elevated rate may be a more reliable overheating signal than the raw number alone would suggest.
Conversely, when on-chain DEX funding rates are significantly higher than equivalent CEX rates, it may indicate that DeFi-native traders — who are often earlier adopters of emerging protocols and narratives — are more aggressively positioned than the broader CEX market. This pattern can sometimes appear as an early signal of a narrative shift before the sentiment fully migrates to the larger centralized platforms.
Monitoring both the CEX and on-chain DEX funding rate landscape for the same assets adds a dimension of market structure intelligence that neither data source provides alone. Tracking the wallets of sophisticated DeFi traders who are actively using on-chain perpetuals can surface these cross-venue sentiment divergences in real time. Wallet Finder.ai gives you on-chain wallet analytics across Ethereum, Solana, and Base — so you can see when smart money wallets are taking positions on on-chain perpetual DEXs before those positions show up in CEX order flow.
Diving into perpetual futures always brings up questions, especially around a mechanism as unique as the funding rate. Let's clear up some of the most common ones traders ask so you can trade with more confidence.
The standard rhythm for funding payments is every 8 hours, which means three times a day. You'll find this schedule on most of the big exchanges like Binance, Bybit, and OKX, creating a predictable cycle for traders.
But don't take that as a hard and fast rule. During wild market swings, some exchanges might shorten the interval to help pull the contract price back in line with the spot price. Always give the funding interval a quick check on whatever exchange you're using.
Yes, absolutely. This is a trap that catches a lot of traders off guard. If you're holding a leveraged long position while the funding rate is consistently positive and high, the cost can seriously chip away at your profits.
Think about it this way: say your trade is up 2%, but you've been holding it for a few days while paying a 0.05% funding fee every eight hours. Those payments add up fast and can easily eat up a big chunk of your gains. If your trade is only slightly in the green, high funding costs could even push it into a loss.
Nope, not at all. Every exchange is its own little ecosystem with its own mix of traders, liquidity, and sentiment. Since the funding rate is just a reflection of the long vs. short pressure on that specific platform, the rates will naturally differ.
This is exactly what opens the door for strategies like funding rate arbitrage. A trader can spot a big difference in rates, go long on one exchange and short on another, and pocket the spread while staying neutral on the asset's price.
A key takeaway for every perpetuals trader: never assume the funding rate is uniform across the market. The differences between exchanges are not just noise; they are actionable signals and potential trading opportunities.
There's no single "good" funding rate because it all depends on your strategy. What’s great for one trader is a huge cost for another.
Let's put it into context:
In the end, a good funding rate is one that fits your market thesis and helps you execute your strategy.
Yes, the contract structure significantly affects what funding payments actually cost or earn you in real dollar terms, even when the stated funding rate percentage is identical.
A linear (USDT-margined) perpetual uses stablecoins as your margin and for settling all payments, including funding. When the funding rate is +0.05% and you hold a $10,000 notional long position, you pay $5 USDT per interval regardless of what the underlying asset's price does between intervals. The dollar value of your funding cost is stable and predictable.
An inverse (coin-margined) perpetual uses the underlying cryptocurrency — typically BTC or ETH — as your margin and settlement currency. Funding payments are denominated and settled in the coin itself. This means the dollar value of your funding cost or income fluctuates with the underlying asset's price even if the rate percentage is unchanged. If you are collecting +0.05% funding as a short holder on an inverse BTC perpetual and Bitcoin's price rises 10% between intervals, the dollar value of the BTC you collect also rises 10%. This makes inverse contracts more complex to manage for funding-focused strategies because your income is not dollar-stable.
For most funding rate strategies — especially delta-neutral carry trades and cross-exchange arbitrage — linear contracts are easier to work with because the funding payment math is straightforward and the income or cost is stable in dollar terms. Inverse contracts are better suited for traders who specifically want coin-denominated exposure and are comfortable modeling the convexity effect they introduce.
On-chain perpetual DEXs use funding rate mechanisms that are structurally similar to CEX perpetuals but differ in several important ways that affect both the rate itself and the strategies that use it.
The most significant difference is in mark price calculation. CEXs compute the mark price directly from their own order book and external spot exchange data. On-chain DEXs must use oracle price feeds to bring external spot prices on-chain, which introduces latency between real market prices and the mark price used for funding calculations. During fast-moving markets, this latency can cause the on-chain funding rate to temporarily diverge from what a CEX would calculate for the same moment.
Settlement intervals also differ. Most CEXs settle funding every 8 hours. On-chain DEXs vary — Hyperliquid uses continuous funding that accrues on every block, while Drift on Solana has used 1-hour intervals. More frequent settlement means funding costs and income accumulate faster at any given rate.
Some DEXs use a borrowing fee model instead of a peer-to-peer funding rate. GMX, for example, charges a borrowing fee only to the larger side of the open interest (long or short), paid to the liquidity pool rather than to the opposing traders. This is a fundamentally different mechanism that should not be treated as equivalent to the standard symmetric funding rate when comparing rates across platforms.
The practical implication is that cross-venue funding rate arbitrage between a CEX and an on-chain DEX is possible when rates diverge, but it carries additional operational complexity: on-chain transactions have gas costs and confirmation delays, collateral movement between venues requires blockchain transactions, and liquidation mechanics on DEXs work differently from CEX internal risk engines.
Yes. This is the premise of funding rate arbitrage — also called a cash-and-carry trade in crypto — and it is one of the more consistently available market-neutral strategies in perpetual futures markets.
The basic structure involves holding offsetting positions that cancel out price exposure while keeping the funding payment stream. The most common version pairs a spot long with a perpetual short: you buy the asset in the spot market and simultaneously open an equivalent-size short in the perpetual futures market. If Bitcoin's price rises, your spot position gains and your perpetual short loses by approximately the same amount — and vice versa. The net price exposure is close to zero. What remains is the funding payment: if the perpetual's funding rate is positive, longs pay shorts, so your short position collects the funding payment at each interval.
The key word is "close to" zero price exposure, not exactly zero. Basis risk — the difference between the spot price and the perpetual mark price — means the hedge is imperfect. If the perpetual trades at a persistent discount to spot, closing the position requires selling your spot holdings and closing the short, and the basis at the time of closing may be different from the basis when you opened. This basis risk is typically small relative to the funding income collected during the hold period, but it is not zero.
Other costs that must be factored into the profitability calculation include spot trading fees, perpetual trading fees for both opening and closing, collateral opportunity cost, the gas fees for any on-chain components of the strategy, and the cost of monitoring and rebalancing the position if the funding rate shifts from favorable to unfavorable. A funding rate arbitrage position that is profitable at 0.05% per interval may not be profitable at 0.01% per interval once all these costs are included.
Mastering the crypto funding rate is a powerful step, but it's just one piece of the puzzle. To truly get ahead, you need to see what the most successful traders are doing in real time. Wallet Finder.ai gives you that edge by tracking smart money movements on-chain, letting you discover and mirror the strategies of top-performing wallets before the market catches on. Start your 7-day trial and turn on-chain data into your next profitable trade.

A premier DeFi analytics platform empowering traders to discover and analyze profitable blockchain wallets, trades and tokens.

