
Recovery Factor Calculation for Smart Traders
Master the recovery factor calculation to measure a strategy's resilience. Learn the formula, see DeFi examples, and find top wallets with Wallet Finder.ai.

June 20, 2026


Wallet Finder
March 11, 2026

Figuring out if a crypto venture will make money can feel like guessing in the dark. A coin profitability calculator is the tool that flips on the lights, helping miners and traders get a solid estimate of their potential earnings before they dive in.
Think of it as a financial forecast for your digital assets. It takes complex variables—like hardware costs, electricity bills, and wild market swings—and spits out a clear profit or loss estimate. In a market as volatile as crypto, making decisions without one is just asking for trouble.

At its core, a coin profitability calculator is a business plan for your crypto activity. It weighs your investment and ongoing costs against potential revenue, giving you a realistic look at financial viability. Just like a business owner wouldn't sink their life savings into a new venture without running the numbers, you shouldn't operate blindly either.
But here's a crucial point: not all calculators are built the same. The crypto world has two main hustles—mining and trading—and each one needs its own specialized tool to get the numbers right. Using the wrong one is a fast track to costly miscalculations.
The main difference comes down to what you're actually calculating. A miner is essentially running a digital factory, churning out new coins. A trader, on the other hand, is playing the market, buying low and selling high. Each role comes with a completely different set of costs and revenue streams that determine the bottom line.
To make it crystal clear, here’s a quick breakdown of how these two types of calculators stack up against each other.
The distinction between a mining profitability calculator and a trading or ROI calculator comes down to what financial question each one is designed to answer. A mining profitability calculator is built for operators running dedicated hardware. Its purpose is to estimate whether the act of creating new coins generates a net return after all operational costs are accounted for, which is why its key inputs are hash rate, power consumption, electricity cost, and pool fees. The typical user is a miner with one or more GPU rigs or ASIC machines who needs to know whether their hardware is earning more than it costs to run.
A trading or ROI calculator serves an entirely different audience with an entirely different set of concerns. Its purpose is to measure the return on investment from buying and selling crypto, meaning it has no interest in hardware or electricity. The inputs that matter here are the initial investment amount, the selling price, and any trading fees charged by the exchange. The typical user is an investor, day trader, or portfolio manager who is focused purely on market movement and the net profit or loss that results from entering and exiting positions.
The practical implication is that these two tools are not interchangeable. Using a mining calculator to evaluate a trading decision, or vice versa, produces meaningless results because the cost structures and revenue mechanisms are completely different. Identifying which category your activity falls into before reaching for a calculator is the first step toward getting a number you can actually rely on.
As you can see, each tool is tailored for a specific job. Trying to use a mining calculator for your trades would be like using a hammer to turn a screw—it just won’t work.
A classic rookie mistake is getting fixated on a coin's current price alone. A good calculator forces you to factor in all the hidden costs, from your power bill to exchange fees. Often, those are the very things that separate a profitable move from a losing one. For a broader look, our guide on a general cryptocurrency profit calculator can add more context.
Knowing which tool to grab is the first step toward making smarter, data-backed decisions. Whether you’re firing up a new mining rig or placing a trade, the right calculator brings much-needed clarity to your financial strategy.
Think of a mining profitability calculator as a digital accountant for your mining rig. It takes raw numbers about your hardware and the crypto network, crunches them through a core formula, and spits out a solid estimate of your potential earnings. It’s a flight simulator for your mining operation—you can test different scenarios without spending a dime on electricity.
The fundamental idea is simple: Revenue - Costs = Profit. But, as always, the devil is in the details. The real power of these calculators is their ability to juggle multiple, constantly changing variables to give you a clear financial snapshot.
To get started, you'll need to plug in some numbers specific to your setup.
The first step is feeding the calculator accurate info about your mining hardware and its operating environment. Garbage in, garbage out—if these numbers are off, your profit estimate will be useless.
Actionable Checklist for Your Inputs:
Once you've entered these personal stats, the calculator gets to work pulling in dynamic data straight from the cryptocurrency network.
Unlike your fixed hardware costs, network variables are always in flux. A good coin profitability calculator pulls this data in real-time to make sure its estimates are as current as possible.
These variables include:
In the wild world of crypto mining, calculators like WhatToMine have become essential. For example, recent data showed that mining Clore (CLORE) with a standard setup generated $0.41 in daily revenue but ended up with a -$0.88 loss after costs. With electricity averaging $0.12/kWh in the US and EU, these numbers show exactly why an estimated 70% of small-scale miners switched coins quarterly between 2022 and 2024 based on calculator predictions.
The Core Formula in Action
The calculator is basically running this math:
(Your Hash Rate / Network Hash Rate) x Block Reward x Coin Price = Daily Revenue
Then, it subtracts your costs:
(Power Consumption in kW x 24 hours x Electricity Cost) + Pool Fees = Daily Costs
Daily Revenue - Daily Costs = Estimated Daily Profit
This process demystifies your potential earnings, turning a bunch of abstract network data into a concrete financial estimate. While these tools are great for operational profit, it's also crucial to understand related financial concepts in DeFi. That’s why we’ve put together a detailed guide on how an impermanent loss calculator can help protect your assets when you're providing liquidity.
Mining calculators show crystal-clear math: Pool A charges 1% fees, Pool B charges 0.5% fees, therefore Pool B is obviously more profitable. This logic seems unassailable until you factor in how mining pools actually distribute rewards. Switching pools to chase marginally lower fees destroys your earnings through lost variance rewards and restarted payout schedules.
Mining pools use different payout schemes — PPLNS (Pay Per Last N Shares), PPS (Pay Per Share), FPPS (Full Pay Per Share), and others. These aren't just accounting quirks; they fundamentally change your revenue based on how long you've been mining with that specific pool. The calculator showing Pool B's lower fees assumes you're already established there, not that you're starting fresh.
PPLNS pools pay based on your contribution to the last N shares before a block is found. "N" is a window, typically 1-3 times the network difficulty. When you first join a PPLNS pool, you're not in that window yet. You submit shares that don't count toward immediate payouts because you weren't there for the previous N shares.
This creates a ramp-up period where you mine at full cost but receive zero or reduced payouts while building your share history. For established miners, this invisible cost was already paid weeks or months ago. For pool hoppers, you pay it every time you switch.
The numbers are brutal. If you switch pools monthly chasing 0.5% fee differences, you might spend three to five days per month in the PPLNS ramp-up earning reduced payouts. That's ten to seventeen percent of the month at lower revenue. The 0.5% fee savings is obliterated by the 10-17% revenue loss during ramp-up periods.
PPS pools appear to solve this by paying immediately for every share regardless of when blocks are found. But they charge higher fees to compensate for taking on the variance risk you're offloading. A PPLNS pool might charge 1% because they're just passing through your share of found blocks. A PPS pool charges 2-4% because they guarantee payment even when the pool has bad luck finding blocks.
The calculator showing "lower fees" on a PPS pool versus PPLNS doesn't account for this structural difference. The PPS pool's higher fees might still net you less total revenue than staying loyal to a PPLNS pool where you've built share history.
Switching between PPS pools avoids the PPLNS ramp-up problem but introduces payout schedule resets. Many pools don't pay out until you hit minimum thresholds (0.01 BTC, 0.1 ETH). If you switch pools before hitting the threshold, your earnings sit locked until you eventually accumulate enough or the pool lowers minimums.
Long-term pool miners receive invisible benefits calculators never show. Some pools offer fee discounts for tenure — mine for 90 days, drop from 1% to 0.8% fees. Switch pools monthly, and you never access these loyalty tiers.
Pool operators also prioritize reliable miners during network events. When fees spike during congestion, pools with limited block space preferentially include shares from established miners over new arrivals. You get better transaction fee inclusion, generating higher revenue per block.
These loyalty advantages compound over time but evaporate the moment you switch pools. The calculator screaming "save 0.3% fees!" doesn't factor in losing 1-2% revenue from preferential treatment you've built up over months.
The hardware you choose is the engine of your mining operation, and a coin profitability calculator is the dashboard telling you how it’s performing. Profitability swings wildly between different types of mining rigs—primarily ASICs, GPUs, and CPUs. Each is built for a different job, and knowing the difference is the first step toward making a smart investment.
A calculator is essential because it moves beyond raw power specs and translates everything into dollars and cents. It shows you exactly which hardware makes financial sense for your budget and goals.
The most important link between your hardware and a coin is its mining algorithm. This is the specific type of math problem the network needs miners to solve. If your hardware isn't built for that specific algorithm, it can't mine the coin. Period.
For example, a new ASIC designed for Bitcoin's SHA-256 algorithm is useless for mining Ethereum Classic, which uses Ethash. This is where calculators shine.
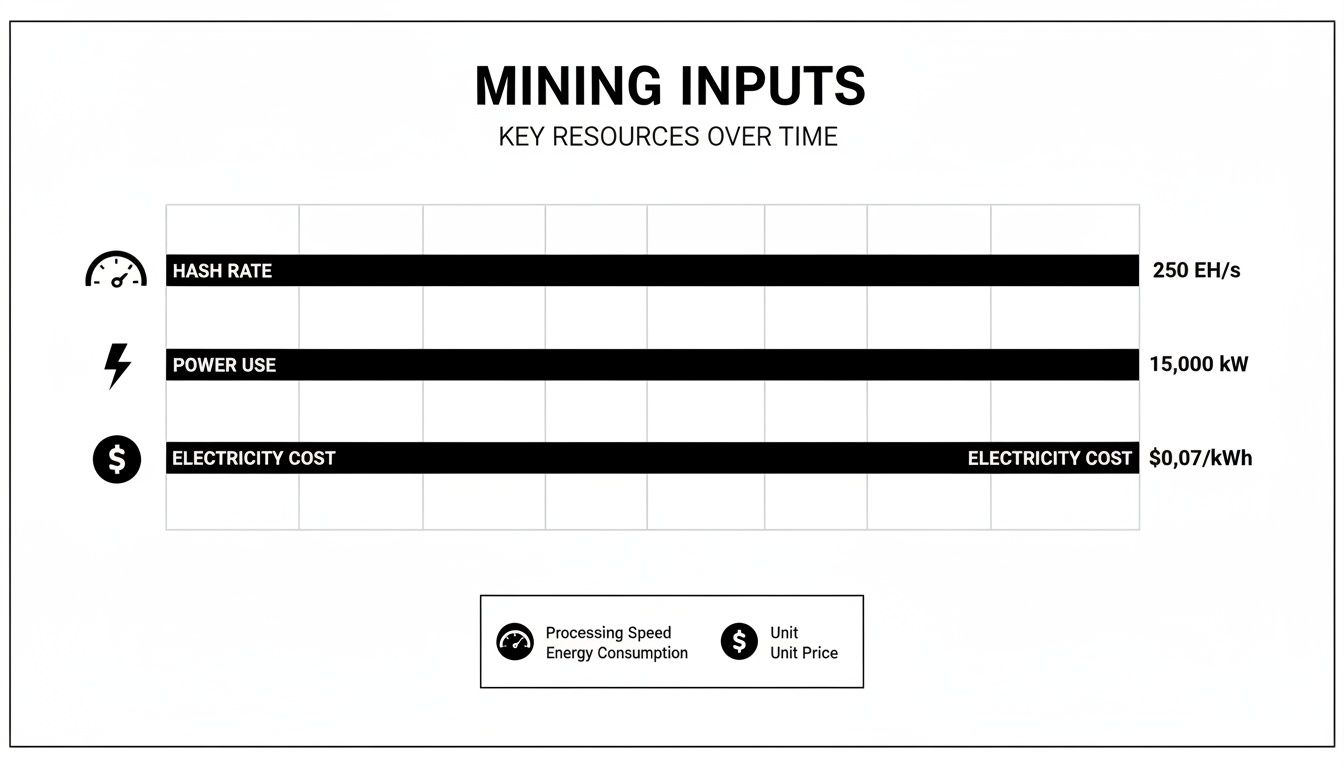
As you can see, the calculator weighs your rig's speed (Hash Rate) against its running costs (Power Use and Electricity Cost) to give you a clear profitability picture. It does the hard work for you, letting you select a GPU model or ASIC and immediately see a list of compatible and profitable coins.
So how do hash rate, power efficiency, and algorithm compatibility play out in the real world? The numbers you plug into a calculator will look drastically different depending on the hardware.
Live data from profitability trackers like ASIC Miner Value puts this into perspective. A new-generation SHA-256 ASIC might pull in around $17.95 daily, while a top Scrypt miner could earn $11.28. However, aggregated data reveals that 60% of these machines are only profitable if your electricity costs stay below $0.08/kWh. This is exactly why you see so many large-scale mining operations set up in places with access to cheap energy.
This table provides a snapshot of how different hardware might perform based on its algorithm, power, and efficiency.
Mining Rig ModelAlgorithmHash RatePower (Watts)Est. Daily Profit (USD)Bitmain Antminer S21SHA-256200 TH/s3500 W$9.50NVIDIA RTX 4090KAWPOW60 MH/s300 W$1.25AMD Ryzen 9 7950XRandomX20 kH/s170 W$0.20
The ASIC is the undisputed champion for Bitcoin (SHA-256), but the GPU still manages a decent return on a different algorithm while using a fraction of the power. The CPU, as expected, is barely in the game and would only be profitable with virtually free electricity.
Using a calculator before you buy hardware is the smartest move a new miner can make. It lets you run simulations to see which rig offers the best return on investment at your specific electricity rate, preventing you from buying a machine that's doomed to lose money from day one.
Ultimately, a coin profitability calculator is your guide through the complex world of mining hardware. It helps you pick the right equipment or, if you already have the gear, points you toward the most profitable coin to mine today.
You research extensively, find the perfect ASIC model showing 5% profitability in calculators, buy three units from the same batch, and discover they hash at wildly different rates despite identical specs. This batch quality variance — where nominally identical hardware performs 15-20% differently — makes calculator predictions useless for actual deployment planning.
ASIC manufacturing involves silicon lottery at scale. Chips from the same wafer bin differently based on microscopic variations in the fabrication process. Manufacturers bin chips by quality, selling the best-performing ones at premium prices and the worst performers as "budget" units. But even within a single bin/batch, substantial variance exists.
The spec sheet says your ASIC does 100 TH/s at 3000W. That's what you enter into the calculator. Reality delivers 95 TH/s at 3100W because your specific unit came from the lower end of the batch quality distribution. You're making 5% less revenue while paying 3% more in electricity, destroying the profitability margins the calculator predicted.
This isn't a defect — it's normal manufacturing variance. ASIC makers can't guarantee exact performance because semiconductor physics doesn't work that way. But calculators assume you're getting median performance, creating systematic overestimation of profits for anyone whose units perform below median.
The variance gets worse with manufacturer cost-cutting. Top-tier manufacturers like Bitmain bin more aggressively, creating tighter performance clusters. Budget manufacturers bin loosely, accepting wider variance to hit price points. That cheap ASIC showing amazing calculator returns might be cheap precisely because performance variance is massive.
When you buy an ASIC, you're actually buying from a specific performance bin whether you realize it or not. Manufacturers test chips, bin them by performance (S+ bin, S bin, A bin, B bin), and charge different prices. The calculator assumes A-bin performance because that's what the manufacturer publishes as "official specs."
But if you bought a B-bin unit (cheaper price, wider availability), you're getting B-bin performance while the calculator predicts A-bin returns. The 10-15% performance gap between bins translates directly to profitability gap.
Some manufacturers don't even publish their binning criteria, leaving buyers to discover performance variance post-purchase. You might receive anything from 90 TH/s to 105 TH/s from a 100 TH/s rated model, with no way to know before powering it on.
The only reliable approach is assuming worst-case bin performance when calculating profitability. If the spec sheet says 100 TH/s, model your operation at 90-95 TH/s. If that's still profitable, you have margin for variance. If not, the investment is too risky.
Buy from manufacturers with published binning and known tight variance. Pay the premium for S+ bins if margins are tight. The extra cost might be cheaper than discovering your batch underperforms by 15%.
Always buy one unit first as a test. Power it on, measure actual performance for 72 hours, then decide whether to deploy capital on bulk orders. The performance of one unit from a batch is your best predictor of the full batch, far better than any calculator prediction.
While miners create new coins, traders and investors profit from the market's constant ebb and flow. For this crowd, a "coin profitability calculator" is all about Return on Investment (ROI). Think of it as your financial scorecard, showing you in black and white how well your trading decisions are actually paying off.
At its core, an ROI calculator answers one simple question: did I make or lose money? It pits the cash you put in against the current value of what you're holding. This basic calculation is the first step for any serious trading strategy.
The foundational formula is powerful in its simplicity. It spits out a clear percentage gain or loss, making it easy to compare how different assets in your portfolio are performing.
ROI Formula:
[(Current Value of Investment - Initial Cost of Investment) / Initial Cost of Investment] x 100%
For example, if you bought $1,000 worth of a token and it's now worth $1,500, your ROI is a clean 50%.
True profitability is rarely that clean. A bunch of hidden costs can quietly eat away at your returns. A good calculator needs to factor these in.
Key Costs to Include in Your Calculation:
Getting a handle on these details is crucial for accurate tracking. If you want to go deeper, check out our comprehensive guide on profit and loss analysis for crypto traders.
Another critical concept a calculator helps untangle is the difference between realized and unrealized gains. The distinction is massive, impacting both your strategy and your tax bill.
And those tax implications are a big deal. Short-term capital gains (from assets held less than a year) are often taxed at higher rates, anywhere from 10% to 37%. Long-term gains (from assets held over a year) get better treatment, with tax rates between 0% and 20%.
Imagine you buy 10 SOL when the price is $150 per token.
A few months pass, and SOL climbs to $200. You decide to sell.
Now, let's calculate the real ROI.
This detailed breakdown gives you the true measure of your trade's success. It’s this level of clarity that empowers you to manage risk effectively and make smarter, data-backed decisions.
Mining calculators show your hash rate, power costs, and expected revenue. What they don't show is the 3-8% of your work that never gets paid because of stale shares. These are valid shares you submitted to the pool after someone else already found the block, making your work worthless.
Stale shares happen due to network latency between your rig and the pool. You find a valid share, send it to the pool, but the packet takes 200 milliseconds to arrive. In that 200ms, another miner found the block. The network moved on to the next block template, and your submitted share is now for an outdated block — worthless.
Every millisecond of latency between your rig and pool increases your stale share rate. The relationship is roughly linear for small latencies and exponential for larger ones. A rig with 20ms latency might see 1-2% stale shares. The same rig with 200ms latency sees 5-8% stale shares.
This destroys effective hashrate. The calculator shows 100 TH/s generating X revenue. But if 6% of your shares are stale, your effective hashrate is 94 TH/s generating 0.94X revenue. The missing 6% is invisible to the calculator because it only knows about your nominal hashrate, not your effective paid hashrate.
Geographic proximity to pools matters enormously. A rig in North America mining on an Asian pool incurs 150-300ms latency. The same rig on a North American pool sees 10-30ms. The stale share difference can be 5-7%, which is the entire profit margin for many operations.
Cryptocurrencies with shorter block times amplify stale share problems. Bitcoin's 10-minute blocks give your shares lots of time to arrive before the next block. Ravencoin's 1-minute blocks mean shares have ten-x less transit time tolerance.
A 100ms latency barely matters for Bitcoin (1% of 10 minutes). The same 100ms latency is critical for Ravencoin (10% of 1 minute between blocks), dramatically increasing stale rates. Calculators comparing profitability across different coins don't account for this block-time-dependent stale share multiplier.
For GPUs mining algorithms with 15-30 second block times (some altcoins), latency becomes the dominant profitability factor. The difference between mining on a nearby pool versus a distant one can be 10-15% revenue difference purely from stale shares.
The only way to know your real stale share rate is measuring it in your mining software. Most miners display stale share percentage in their output. Compare this across different pools to find which gives you lowest stales.
Run ping tests to prospective pools before committing hashrate. Sustained ping times under 50ms are ideal. Over 100ms is questionable. Over 200ms is profit-destroying for short-block-time coins.
For large operations, deploy geographically distributed rigs on region-appropriate pools rather than concentrating all hashrate on one global pool. North American rigs mine North American pools, Asian rigs mine Asian pools, even if it means using different pools for different locations. The latency savings exceed any pool fee differences.
A coin profitability calculator is a powerful ally, but it's not a crystal ball. Treating its results as a guaranteed future outcome is a quick way to end up disappointed. To really make them work for you, you have to understand their limits and steer clear of common mistakes.
This is the most frequent and costly error miners make. They ignore the inevitable increase in network mining difficulty. As a cryptocurrency gets more popular, more miners jump in, driving competition up. This rising tide directly sinks your earnings potential.
A basic calculator that only looks at today's difficulty is showing you a future that will never exist. Advanced bitcoin mining profitability calculators, like those from Bitbo, factor in a 0.4527678% daily network hashrate increase. This explains why simpler tools can overestimate long-term profits by as much as 300%. Just look at what happened after the 2024 halving: global mining profitability plummeted 52%. You can learn more about these critical adjustments on jblevins.org.
Actionable Tip: Your profitability will almost certainly decline over time. Always use a calculator that allows you to model future difficulty increases or manually temper your expectations by at least 10-15% for long-term projects.
Another huge pitfall is getting tunnel vision on the most obvious cost—electricity—while forgetting the "hidden" expenses that eat away at your bottom line.
Mining profitability calculators fail spectacularly during the 6-12 months before Bitcoin halvings. The price action during these periods is driven by halving speculation rather than fundamental supply/demand, creating disconnects where calculator predictions become meaningless.
A halving cuts miner block rewards in half. Rational models say mining profitability should drop 50% overnight. But halvings are scheduled and public, so the market prices in the supply reduction months in advance. Price pumps 100-200% before the halving, temporarily making mining look incredibly profitable in calculators.
Then the halving actually happens. Price dumps 30-50% post-halving as speculators take profits, while difficulty keeps rising from miners who deployed based on pre-halving calculator predictions. Profitability collapses far below what anyone calculated, destroying late-deploying miners.
Six months before a halving, calculators show mining is extremely profitable because current revenue (pre-halving block rewards) is being multiplied by speculative prices (halving-anticipation pump). New miners see these numbers, buy hardware, and deploy.
But by the time their ASICs arrive and get set up (3-6 month lead time), the halving has occurred. Block rewards are half what the calculator used. Price hasn't doubled to compensate — it maybe increased 20-30% and is now correcting. Difficulty has exploded from everyone who deployed based on the same calculator predictions.
The calculator that showed $20/day profit six months ago now shows $4/day profit for the same hardware. Except it's worse than that, because you bought the ASIC at peak prices during the pre-halving frenzy when demand was highest.
Immediately post-halving, calculators briefly show inflated profitability because difficulty hasn't adjusted yet. It takes 2-4 weeks for difficulty to reflect the new economics. During this window, calculators predict profits based on old (low) difficulty and new (halved) block rewards.
Inexperienced miners see this brief window of calculator-predicted profitability and deploy capital, not realizing difficulty is about to spike 50-100% as the network equilibrates to halved rewards. By the time their hardware comes online, difficulty has adjusted and actual profitability is fraction of what they calculated.
The profitable play is inverse to what calculators show during halving periods. Deploy capacity when calculators look terrible (immediately post-halving, during difficulty adjustment, when speculators have exited and price has corrected). This is when hardware is cheapest and competition is lowest.
Avoid deploying when calculators look amazing (6-12 months pre-halving when speculative price hasn't been offset by halved rewards yet). This is when you're buying expensive hardware to mine into an inevitable profitability cliff.
Run custom calculator scenarios that manually input post-halving block rewards and estimated post-correction prices rather than trusting the calculator's current-state assumptions. Model what profitability looks like assuming price only increases 30% while rewards halve, not the fantasy 100% increase required for calculator numbers to work out.
A coin profitability calculator gives you a number, but a number without context is just noise. The real skill is knowing how to interpret that number against a personal threshold — a minimum acceptable return that determines whether you act or stay on the sidelines. Without a defined threshold, most miners and traders end up reacting emotionally to whatever the calculator shows, chasing marginal profits that evaporate once costs are properly accounted for.
A profitability threshold is a pre-set floor. It is the minimum daily, weekly, or monthly return below which you will not commit capital or hash power. Setting it in advance protects you from the cognitive trap of rationalization, where a mediocre result looks acceptable simply because you want it to be. The threshold forces an objective answer: does this meet my standard or not?
For miners, the threshold calculation starts with your fully loaded cost base. This means electricity, hardware depreciation, pool fees, cooling, and any software subscription costs combined into a single daily figure. Your threshold should sit comfortably above this number, not just above it by a cent.
A practical approach is the two-times cost rule: your estimated daily revenue should be at least double your daily operating costs before you commit to mining a given coin. This buffer absorbs the two threats that calculators cannot predict — a sudden price drop and a difficulty spike. If a coin only clears your costs by 10%, a modest difficulty increase wipes out your margin entirely. If it clears them by 100%, you have meaningful room to absorb volatility before you are operating at a loss.
The rule also applies to hardware purchases. Before buying a new rig, use the calculator to determine how many days of net revenue at current rates are required to recover the hardware cost. This is your break-even horizon. A break-even horizon under 180 days is generally considered acceptable for GPU rigs. For ASICs, which depreciate faster and cannot switch algorithms, a horizon under 120 days is a more conservative and appropriate target given the risk profile.
For traders, the threshold framework is simpler but equally important. Your minimum acceptable ROI should always account for the opportunity cost of holding a different asset over the same period. If Bitcoin returned 40% over a quarter and your altcoin trade returned 15%, the calculator might show a gain, but the threshold-adjusted view shows an underperformance.
Build your threshold around three components: your target ROI percentage, your maximum acceptable holding period, and your exit trigger. The exit trigger is especially important. Define in advance the price level or time window at which you will close the position regardless of emotional attachment. A common and effective structure is a 2:1 reward-to-risk ratio, meaning for every dollar you are prepared to lose on a trade, you require a potential gain of at least two dollars. If the calculator shows a target return that does not meet this ratio at current prices, the setup does not qualify.
A threshold is not static. Market conditions shift, electricity rates change, and your hardware ages. A quarterly threshold review is a minimum maintenance requirement for any serious mining operation or active trading portfolio.
During the review, recalculate your fully loaded daily cost base with current figures. Check whether your mining hardware's efficiency still justifies operation, or whether the hash rate-to-power ratio has fallen to a point where newer equipment would pay for itself within your break-even horizon. For traders, reassess whether your target ROI remains realistic given current market volatility and liquidity conditions for the coins you are trading.
Tracking these reviews in a simple log creates a record of how your thresholds evolved and why. Over time, this log becomes one of your most valuable assets — a calibrated decision framework built on real data rather than assumptions.
A coin profitability calculator answers the question of whether a trade or mining operation makes financial sense today. But there is a second layer of intelligence available to anyone willing to look past their own operation: using profitability data at scale to understand what sophisticated market participants are doing and where capital is flowing before prices reflect that movement.
This is not speculation. Blockchain data is public, and on-chain behavior leaves a clear trail. When profitability conditions favor a particular coin, mining hash power migrates toward it. When a coin's ROI profile improves significantly, wallet activity from high-performing addresses tends to increase before the broader market prices in the shift. Recognizing these patterns gives you a structural edge that no single calculator can provide on its own.
Hash rate migration occurs when miners move their computational power from one coin to another in response to profitability shifts. Because mining profitability calculators update in real time, large mining operations are constantly optimizing across dozens of coins. When significant hash rate flows into a coin, it signals that professional miners with access to the best data and the lowest electricity costs have identified it as the most profitable option available.
You can track this directly. On-chain data platforms publish network hash rate figures for most major proof-of-work coins. A sharp upward move in hash rate, particularly when it outpaces the corresponding increase in difficulty, indicates that new mining capital is entering the network faster than the difficulty adjustment mechanism can respond. This window — between hash rate growth and difficulty catching up — is often when the coin's block reward value is at its most attractive.
For traders who do not mine, this signal serves as a leading indicator of miner conviction. Miners do not allocate hardware and electricity to a coin unless their profitability calculator justifies it. Their collective behavior is an aggregated, financially committed vote on a coin's near-term outlook.
Beyond hash rate, wallet-level data reveals how individual participants position themselves around profitability inflection points. High-performing wallets — those with consistently strong realized returns across multiple market cycles — tend to accumulate positions in coins whose profitability profiles are improving before that improvement is visible in price.
The pattern typically unfolds in three stages. First, transaction volume from a small cluster of experienced wallets increases in a coin that has been dormant or underperforming. Second, the coin's profitability metrics begin improving as price quietly appreciates. Third, broader market attention follows, price accelerates, and the early accumulators begin reducing their positions into the liquidity provided by late entrants.
Identifying wallets at stage one requires tooling that aggregates on-chain data and surfaces behavioral patterns across thousands of addresses simultaneously. Doing this manually is impractical. Wallet Finder automates exactly this process, tracking high-performance wallet behavior in real time so you can identify where smart money is positioning before the profitability story becomes obvious to everyone. Start finding winning wallets at Wallet Finder.
The most complete approach to profitability analysis combines your personal calculator outputs with on-chain intelligence at the network level. The calculator tells you whether a position makes sense given your specific costs and return requirements. On-chain data tells you whether the broader market's most sophisticated participants agree.
When both signals align — your calculator shows a strong ROI profile and on-chain data shows smart money accumulating — the confidence level for acting on that information is materially higher than either signal alone. When they diverge — your calculator looks favorable but experienced wallets are quietly reducing exposure — that divergence is worth investigating before committing capital.
This combined framework turns a profitability calculator from a simple arithmetic tool into one input within a broader intelligence system. The arithmetic is necessary but not sufficient. Position sizing, entry timing, and exit discipline all benefit from the additional context that on-chain data provides, and building the habit of checking both before acting is one of the most practical steps any serious miner or trader can take.
The crypto market moves at lightning speed. A coin that was profitable this morning could be a terrible choice by the afternoon. Using stale data for coin prices, network difficulty, or even your own electricity rate will give you a useless result.
Best Practice: Always refresh the calculator and double-check all your inputs right before making a big decision, like switching coins or buying new hardware. Relying on data that's even a day old can be a very expensive mistake.
By understanding these common errors, you can stop seeing a profitability calculator as an infallible oracle and start using it as what it is: a strategic guide for making smarter decisions in a market that never stops changing.
Even after you get the hang of a coin profitability calculator, a few questions always seem to pop up. Let's tackle the most common ones miners and traders ask.
If you're an active miner, you should be checking it daily. Crypto prices and network difficulty can swing wildly in a matter of hours. The coin that was a goldmine yesterday could be bleeding you dry today. Making this a daily habit lets you pivot your hash power to whatever is most lucrative right now.
The good ones are, yes. Reputable free calculators pull live data for coin prices and network difficulty. The real question is, how accurate is the information you put in? The calculator's final profit estimate is only as good as your inputs. If you fudge the numbers on your electricity cost or hash rate, the result will be garbage.
An accurate calculator is just a reflection of accurate data. It’s a simple truth that’s easy to forget. Spending an extra two minutes to verify your own metrics can be the difference between a reliable forecast and a totally misleading one.
Absolutely not. A calculator gives you a snapshot of profitability based on current market conditions, nothing more. It has no way of knowing what a coin's price will be tomorrow or how network difficulty will change next week. The crypto market is just too volatile for that. Think of it as a tool for making smart decisions today, not a crystal ball for forecasting your annual income.
This is the classic debate, and the answer almost always comes down to your electricity cost. A higher hash rate earns you more crypto, but power efficiency determines your take-home profit. A powerful but energy-hungry rig in a high-cost area could easily operate at a loss. A calculator is the only way to find that perfect sweet spot for your specific setup and costs.
Stale shares create 3-8% invisible earnings loss that no calculator accounts for. Your nominal hashrate might be 100 TH/s, but if 6% of shares arrive at the pool after blocks are found (due to network latency), your effective paid hashrate is only 94 TH/s.
ASIC batch variance means your specific unit might hash 15-20% below the manufacturer's spec sheet that calculators use. Silicon lottery creates performance distribution even within the same model/batch. Only testing your actual hardware reveals true performance.
Pool payout schemes (PPLNS ramp-up periods, minimum payout thresholds, loyalty fee tiers) affect real revenue but aren't modeled in calculators showing only headline pool fees. Switching pools resets these invisible benefits.
Ignore calculator predictions during the 6-12 months before halvings when price is driven by speculation rather than fundamentals. Manually model scenarios assuming block rewards halve while price increases only 20-30% (historical post-halving average, not the 100% required for calculator numbers to work).
Deploy capacity when calculators look terrible (immediately post-halving during difficulty adjustment) not when they look amazing (pre-halving when speculative prices haven't been offset by reward cuts). Hardware is cheapest and competition lowest when profitability appears worst.
Run 12-month forward projections with halving dates marked. Calculate what profitability looks like on each side of the halving event assuming conservative price action. If you can only afford to mine profitably with pre-halving economics, don't deploy.
Almost never, unless you're switching from a dying pool to a healthy one. The 0.5% fee savings is destroyed by: PPLNS ramp-up periods where new miners earn reduced payouts for 3-5 days (10-17% of month at lower revenue), lost loyalty fee tiers many pools offer established miners (1-2% better rates after 90+ days), reset minimum payout thresholds locking earnings until you rebuild balance, and lost preferential share treatment during high-fee periods when pools prioritize established miners.
Only switch pools if the fee difference exceeds 2%, the pool's hashrate is declining (increasing payout variance), or you're experiencing persistent high stale shares indicating poor connectivity. For marginal fee differences, staying loyal generates better long-term returns.
There is no universal figure, because a good daily profit target depends entirely on your individual cost structure and risk tolerance. The practical starting point is calculating your fully loaded daily operating cost, which includes electricity, hardware depreciation, pool fees, and cooling. From there, a daily revenue figure of at least twice your operating cost gives you a meaningful buffer against the two forces most likely to erode mining returns: price volatility and difficulty increases. If your calculator shows a margin thinner than that, the setup lacks the resilience to remain profitable through normal market fluctuations. The target is not a fixed dollar amount but a ratio: revenue relative to fully loaded costs, with enough headroom to absorb adverse conditions without immediately flipping to a loss.
This is one of the most underused applications of a profitability calculator, and it reframes the entire decision. To make the comparison, calculate your estimated net mining revenue over a specific time period, say 90 days, after all costs. Then calculate what your total hardware and electricity spend over those same 90 days would have returned if you had used that capital to buy the coin at the start of the period and held it. If the coin appreciated significantly, the buy-and-hold scenario may have outperformed active mining even before accounting for the operational complexity of running a rig. This comparison does not mean mining is always inferior, but it exposes a hidden opportunity cost that most miners never formally calculate. Running both scenarios side by side before committing to a mining setup is a straightforward discipline that prevents capital from being deployed into the operationally intensive option when the simpler one would have delivered a better return.
This gap is almost always explained by one or more of four factors. First, the calculator was run against a coin price or difficulty figure that changed between when you checked it and when you actually mined. Network difficulty adjusts automatically as hash rate shifts, and even a moderate increase can compress margins significantly over a multi-week period. Second, hidden costs were not fully captured in the inputs, most commonly hardware depreciation and the efficiency loss that occurs as mining equipment ages. Third, pool luck and variance mean your actual block share will fluctuate around the theoretical average, sometimes meaningfully below it over short time windows. Fourth, electricity costs may have changed, particularly for operations on variable-rate utility contracts. The fix is not to distrust the calculator but to audit each of these variables against your actual figures and re-run the calculation with corrected inputs. Accurate inputs produce reliable outputs; the gap between projected and actual earnings is almost always a data quality problem, not a calculator flaw.
Ready to turn on-chain data into actionable trading signals? Wallet Finder.ai helps you discover profitable wallets, track smart money movements in real time, and copy winning strategies before the market catches on. Start your 7-day trial and trade smarter at https://www.walletfinder.ai.

A premier DeFi analytics platform empowering traders to discover and analyze profitable blockchain wallets, trades and tokens.

