
Recovery Factor Calculation for Smart Traders
Master the recovery factor calculation to measure a strategy's resilience. Learn the formula, see DeFi examples, and find top wallets with Wallet Finder.ai.

June 20, 2026


Wallet Finder
March 8, 2026

An impermanent loss calculator is a tool that shows you the dollar-value difference between holding assets in a DeFi liquidity pool versus just keeping them in your wallet. It’s built to show the opportunity cost you’re taking on in exchange for earning those juicy trading fees as a liquidity provider (LP).
Impermanent loss (IL) is one of the most talked-about concepts in decentralized finance, but it’s also one of the most misunderstood. It's not a direct loss of your tokens. Instead, think of it as a potential loss in value compared to just holding onto your assets—what the crypto world calls a "HODL" strategy.
When you deposit a pair of assets, like ETH and USDC, into an automated market maker (AMM), your funds are used to help other people trade. As the market prices of these tokens fluctuate, the AMM automatically rebalances the ratio of your assets in the pool. It's this constant rebalancing that causes impermanent loss.
Let's say the price of one of your assets skyrockets compared to the other. The pool sells off some of that high-performing asset for the less valuable one to keep things balanced. When you finally decide to pull your funds out, you’ll get back a different mix of tokens than you put in—less of the one that went up and more of the one that went down or stayed flat.
The name 'impermanent' is a bit of a trap. The loss is only theoretical while your funds are locked in the pool. The second you withdraw your liquidity at a different price ratio than when you deposited, that loss becomes very real and very permanent.
A visual impermanent loss calculator can really drive this point home.
As you can see from this chart, the bigger the price swing—up or down—the greater your potential impermanent loss.
To put this into perspective, imagine you're providing liquidity to an ETH/DAI pool. You deposit 1 ETH (worth $100) and 100 DAI, making your initial stake $200. Now, let's say ETH doubles in price to $200. Arbitrage traders will jump in to rebalance the pool.
If you were to withdraw at this point, your position would be worth less than if you had simply held your 1 ETH and 100 DAI from the start. This results in a 5.7% loss compared to just holding. It's a perfect example of how volatility can eat into your returns. You can check out more DeFi insights on impermanent loss to get a better handle on these market dynamics.
Figuring out this potential downside isn't just for kicks; it’s an absolute must for any serious LP. Without a solid grasp of IL, you can't know for sure if the trading fees and yield farming rewards you're collecting are actually putting you in the green.
While plugging numbers into an online impermanent loss calculator is definitely the fast lane, taking the time to understand the math behind it gives you a serious edge. Manually calculating impermanent loss pulls back the curtain on what’s actually happening to your assets in a liquidity pool. It’s the difference between being a passive user and an informed provider.
The formula might look a little intense at first glance, but it’s really just built on one simple idea that powers automated market makers (AMMs): the constant product formula. This is the mechanism that ensures the total value in a pool stays balanced, even as the ratio of the two tokens changes with every swap.
Let's break down the math for a standard 50/50 pool.
To figure out impermanent loss, we're simply comparing the value of your position inside the LP against what its value would have been if you'd just held those same assets in your wallet.
The most common formula to get the loss percentage is:
Impermanent Loss (%) = [ (2 * √(price_ratio)) / (1 + price_ratio) ] - 1
Here’s a breakdown of the key variables:
This visual gives a great overview of how providing liquidity can sometimes leave you with less than if you had just HODL'd.
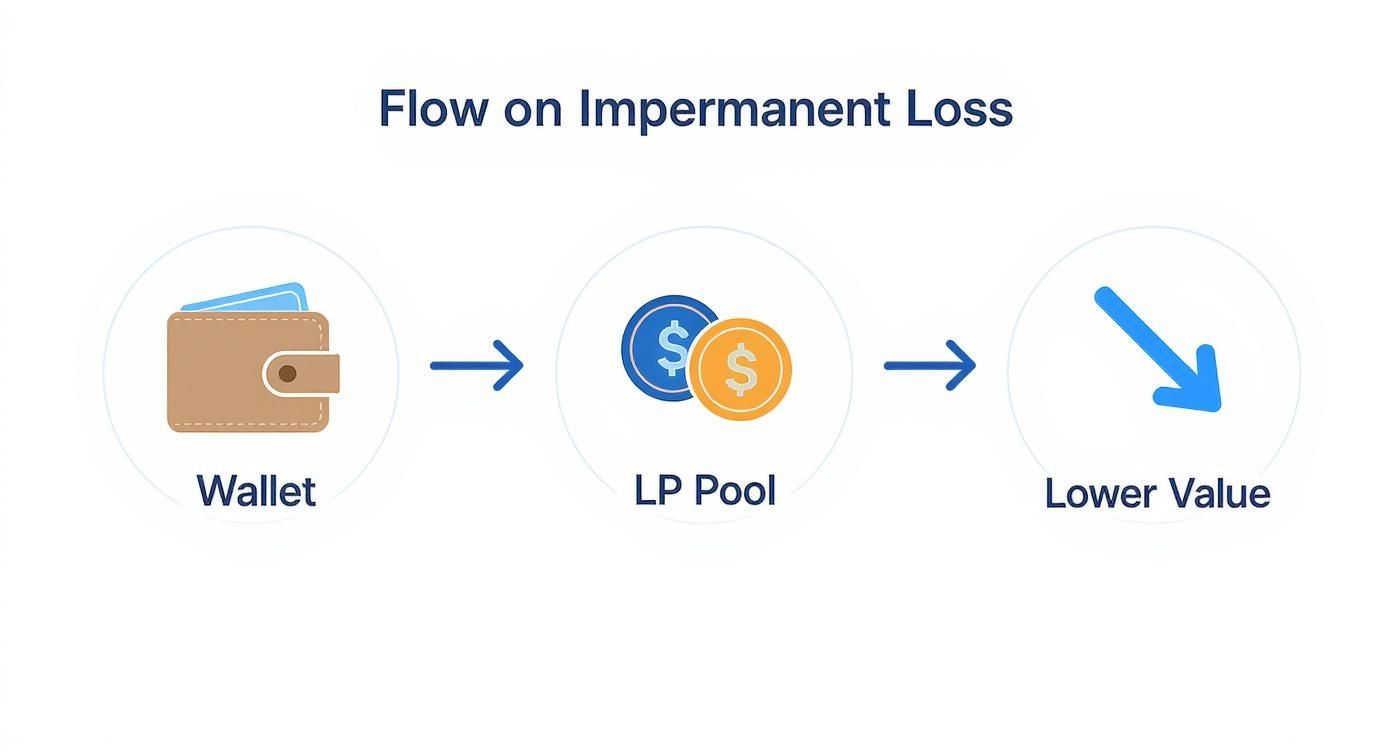
As you can see, the process starts with funds moving from a wallet into a pool. From there, price divergence kicks in, which can shrink the total value of your position over time.
Let's walk through a couple of real-world scenarios to see how this plays out when the market moves.
Imagine you’ve provided liquidity to an ETH/USDC pool, and the price of ETH doubles.
Your impermanent loss is -5.7%. This means your LP position is worth 5.7% less than it would have been if you had just held onto your original ETH and USDC.
Now, what if the opposite happens? The price of ETH gets cut in half.
The impermanent loss is also -5.7%.
A key takeaway here is that impermanent loss doesn't care which way the price moves. All that matters is the magnitude of the change. A 2x move up results in the same IL as a 50% move down.
Running these numbers yourself is the best way to build an intuitive feel for the risks. But to speed things up, here’s a handy reference table that shows the relationship between price changes and potential IL.
This table shows the potential impermanent loss you'd face based on how much the price of one asset changes relative to the other in a 50/50 pool.
Price Change vs Initial PriceImpermanent Loss Percentage1.25x (25% change)-0.6%1.5x (50% change)-2.0%2x (100% change)-5.7%3x (200% change)-13.4%4x (300% change)-20.0%5x (400% change)-25.5%
What this table makes crystal clear is how quickly IL can accelerate once prices really start to diverge. Keeping these figures in mind helps you estimate your risk before jumping into a pool and makes you a much smarter user of any automated impermanent loss calculator.
Manually crunching the numbers is a great way to wrap your head around the mechanics of impermanent loss. But for day-to-day use? An online impermanent loss calculator is your best friend.
These tools do all the heavy lifting for you, giving you a quick snapshot of your LP position's health without touching a single formula. They turn a messy calculation into a simple data-entry task.
Using one is incredibly straightforward. You just need to plug in a few key details about your liquidity pool position. Think of it as giving the calculator the "before" and "after" picture to analyze.
Before you even open a calculator, you’ll want to have these details handy to get an accurate result:
With this info, the calculator can figure out the initial value of your deposit, what your LP tokens are worth now, and—most importantly—what your assets would be worth if you had just held them in your wallet.
Key Tip: Remember, an impermanent loss calculator is laser-focused on one thing: the loss from price divergence. It typically does not factor in any trading fees you've earned or yield farming rewards. Your actual P&L will be different.
Once you punch in your data, the calculator will spit out a few key numbers. Knowing what each one means is crucial for making smart decisions about your investment.
Here’s a checklist of what you'll typically see:
Of course, the DeFi world has spawned more advanced analytics platforms. As of 2024, tools like APY.Vision and Revert Finance offer much more sophisticated tracking for LPs on major AMMs. They go beyond a simple IL calculation by pulling in the fees you've earned and showing you your true net returns. This is critical since LP fee returns of 5% to 30% can often be wiped out by IL during volatile markets.
For a deeper dive into managing this risk, check out our guide on the top tools for monitoring impermanent loss. These platforms give you a much more complete picture of your actual DeFi performance.
Plugging numbers into an impermanent loss calculator gives you a sharp, focused view of one specific risk, but it's far from the full picture. Your actual profit and loss as a liquidity provider (LP) is a constant balancing act between this potential downside and the rewards you earn for taking on that risk.
Think of impermanent loss as a headwind you're flying into. Trading fees and other incentives are the tailwind pushing you forward. Sometimes the tailwind is stronger, and other times... not so much.
The whole reason for providing liquidity in the first place is to get a slice of the trading fees. Every time someone swaps tokens in the pool you're in, a small fee is collected and split among all the LPs. In a pool with tons of volume, these fees can stack up fast, acting as a direct counterbalance to any impermanent loss you're feeling.
A busy pool with constant trading activity can crank out some serious fee revenue. For a lot of successful LPs, the goal isn't to dodge impermanent loss entirely—that's nearly impossible. The real game is making sure the fees you earn consistently outpace the IL.
If your impermanent loss is 5% over a month but you've pocketed 8% in fees, you're still walking away with a net gain.
But don't get complacent. A detailed time-series study on the Balancer BAL/WETH pool in 2023 showed just how wild this relationship can get. Using on-chain data, researchers found that IL could swing from 1% to over 8% with price changes of just 10-20%. The analysis confirmed that even with swap fees, impermanent loss can seriously eat into returns, driving home the need to watch both volatility and trading volume like a hawk.
On top of the standard trading fees, many DeFi protocols sweeten the deal with extra rewards to pull in more liquidity. These incentives, often called yield farming or liquidity mining, can completely flip the script on your position's profitability.
These rewards usually get paid out in the protocol's own native token. This adds another layer to your P&L math:
A position that looks like a loser from an IL perspective alone can suddenly become a big winner once you factor in these extra rewards. The catch? You're now exposed to the price swings of the reward token itself, adding a new risk to manage.
Platforms like Uniswap V3 changed the game by introducing concentrated liquidity. This feature lets you provide your funds within specific price ranges instead of across the entire spectrum from zero to infinity. It's a massive upgrade because it can dramatically boost your fee-earning potential by making your capital work harder.
So what's the trade-off? It also magnifies your exposure to impermanent loss.
If the price of an asset moves outside your carefully chosen range, you stop earning fees completely, and your position gets stuck as 100% of the less valuable asset. Concentrated liquidity offers a shot at much higher returns, but it's not a set-it-and-forget-it strategy. It demands more active management and a solid grasp of how market volatility affects liquidity pool returns. Your risk and reward are both cranked up to eleven, making a clear-eyed assessment of all these factors more critical than ever.
Knowing how an impermanent loss calculator works is one thing, but actually putting that knowledge to work is what keeps your capital safe. Let's move from theory to action. You can actively manage your risk with a few proven strategies designed to limit your exposure to the price divergence that causes IL in the first place.

The core idea here is simple: the less your paired assets move in price against each other, the lower your impermanent loss will be.
Honestly, the most effective way to sidestep a major IL headache is to choose asset pairs that have a strong price correlation. When two assets move together, their price ratio stays stable, which minimizes the constant rebalancing that triggers impermanent loss.
The golden rule for minimizing impermanent loss is to avoid pairing a stable asset with a highly volatile one. A BTC/USDC pool, for example, is far riskier than a wBTC/renBTC pool because the potential for price divergence is massive.
Market conditions are everything in your LP journey. Jumping into a pool during a period of extreme volatility is like sailing straight into a storm. A little strategic timing can make all the difference.
Try to provide liquidity when the market is consolidating or just moving sideways. When prices are stable, your risk of racking up immediate and significant IL is much, much lower. By the same token, exiting your position during these calmer periods can help you lock in your earned fees without taking a big hit from price divergence.
You can get a deeper look into this topic in our guide on pair selection strategies for impermanent loss.
A basic impermanent loss calculator is a fantastic starting point, but it really doesn't paint the full picture. To make truly smart decisions, you need a complete view of your position's performance—and that means factoring in both your IL and the fees you’ve earned.
This is exactly where advanced wallet tracking platforms like Wallet Finder.ai come into play. These tools give you a real-time, on-chain Profit and Loss (PnL) analysis. You can see precisely how much you've earned in trading fees versus how much you've lost to IL. This kind of data-driven insight reveals your true net return and helps you decide with confidence when it’s the right time to exit a pool or switch up your strategy.
Every example you will see in a standard impermanent loss calculator assumes a 50/50 pool — equal value split between two tokens, governed by the constant product formula x × y = k. That assumption works perfectly for Uniswap V2 or any traditional two-token equal-weight pool. But a large and growing portion of DeFi liquidity now lives in pools that deliberately break that assumption. Weighted pools, multi-asset pools, and stableswap pools all operate under different mathematical rules, which means the impermanent loss formula changes alongside them.
Understanding these differences is not a technicality. If you are providing liquidity on Balancer, Curve, or any protocol that offers non-50/50 configurations, plugging your numbers into a standard calculator will give you the wrong answer. The actual IL you face can be meaningfully higher or lower depending on the pool architecture, and knowing which way it skews before you deposit is the difference between an informed position and an expensive surprise.
Balancer introduced the concept of weighted pools, which allow assets to be held in ratios other than 50/50 — for example, 80/20 or 60/40. The underlying formula generalizes the constant product rule into a weighted geometric mean, but the IL mechanics follow a clear and intuitive logic: the further a pool is weighted toward one asset, the less exposed you are to impermanent loss when that asset moves in price.
Consider an 80/20 ETH/USDC pool. Because 80% of the pool's value is denominated in ETH, the pool rebalances far less aggressively when ETH's price changes. Arbitrageurs have less incentive to extract from the pool because the pool does not need to sell off large quantities of ETH to maintain its ratio. The result is a materially lower IL for price increases in the 80% asset.
Here is how the math plays out at a 2x ETH price increase across different pool weights:
A standard 50/50 ETH/USDC pool produces the familiar 5.7% impermanent loss at a 2x price move. An 80/20 ETH/USDC pool at the same 2x move produces roughly 2.5% impermanent loss — less than half. A 95/5 configuration reduces it further to approximately 0.6%. The trade-off is that a heavily weighted pool earns far fewer fees from the minority asset side, and the pool's price discovery efficiency drops. But for a long-term ETH holder who wants exposure to fee income without dramatically diluting their ETH position, an 80/20 weighted pool is a structurally different product from a 50/50 pool — not just a stylistic preference.
The inverse is also true. The 20% asset in an 80/20 pool is disproportionately exposed to impermanent loss if it moves significantly. If you are providing liquidity in a pool where your chosen volatile asset sits at the minority weight, your IL from that asset's movement is amplified, not reduced. This is a nuance that most impermanent loss guides skip entirely, and it is exactly the kind of blind spot that leads LPs to misread their actual risk.
Stableswap pools, pioneered by Curve Finance, are built for assets that are designed to maintain a near-constant price ratio — stablecoin pairs, liquid staking tokens, and wrapped versions of the same underlying asset. The AMM formula powering these pools is fundamentally different from the constant product formula. It blends a constant sum curve (which would produce zero slippage but can be drained) with a constant product curve (which prevents full drainage but produces high slippage near the extremes). The result is a curve that is nearly flat around the peg and only bends sharply if prices deviate significantly.
For an LP providing liquidity to a USDC/USDT pool on Curve, impermanent loss under normal conditions is negligible — measured in fractions of a basis point — because the price ratio almost never moves. The pool does not need to rebalance, so arbitrageurs have nothing to extract. But the stableswap formula does not eliminate impermanent loss; it defers it to the depeg scenario.
If one stablecoin loses its peg and trades at $0.90, the pool will accumulate the depegging asset and shed the sound one. An LP who deposited an equal USDC/USDT split could withdraw mostly the depegged token, representing a real and significant loss. The stableswap formula compresses IL to near-zero within the expected operating range but makes the tails much more consequential. This is why auditing the assets in any Curve-style pool for peg integrity is not optional — it is a core part of the risk assessment that a standard impermanent loss calculator cannot perform for you.
Balancer also supports multi-asset pools that can hold three, four, or more tokens simultaneously. The mathematical interaction between these assets adds complexity, but the LP-level takeaway is relatively intuitive. In a three-asset pool holding ETH, BTC, and USDC in equal thirds, your impermanent loss from ETH's price movement is partially buffered by the fact that BTC is also in the pool and may be moving in a correlated direction.
Multi-asset pools effectively spread your exposure across more price ratios simultaneously. For assets with strong positive correlation, this can reduce net impermanent loss compared to a single volatile pair. For uncorrelated or inversely correlated assets, the pool can produce IL from multiple directions at once.
The critical implication for anyone using an impermanent loss calculator is that single-pair IL tools simply cannot model multi-asset pool dynamics accurately. If you are in a Balancer three-token pool, you need either a pool-specific calculator or a full on-chain PnL tracker that reads your actual position data rather than modeling it from first principles.
Every discussion of impermanent loss eventually reaches the same conclusion: fees can offset it. But that observation is not a strategy. The real question — and the one that almost no impermanent loss guide answers with specificity — is exactly how much fee income you need to break even at a given level of impermanent loss, and whether the pool you are considering is realistically capable of generating that amount.
This is the break-even fee rate framework, and working through it before you deposit converts a vague intuition ("the fees might cover it") into a concrete go/no-go decision. Combined with a good impermanent loss calculator, it is the analytical foundation that separates deliberate LP strategy from hope-based liquidity provision.
Before evaluating fee income, you need a clear estimate of the IL you are taking on. This is where the impermanent loss calculator does its job. But rather than running a single scenario, experienced LPs run a range of scenarios that reflect their actual price expectations.
If you are depositing into an ETH/USDC pool and your thesis is that ETH could move 50% in either direction over the next 90 days, your base-case IL exposure is approximately 2.0%. If you think a 3x move is plausible over a longer horizon, your tail-case IL is approximately 13.4%. These two numbers bracket the range of opportunity cost you are accepting.
It is worth emphasizing here that both a 50% increase and a 50% decrease produce the same 2.0% IL. Direction does not change your impermanent loss. Only magnitude does. This counterintuitive fact means that bullish conviction on an asset does not reduce your IL risk as an LP. Whether ETH goes to $6,000 or drops to $2,000 from a $4,000 entry, your IL at that magnitude of move is mathematically identical.
Once you have your IL estimate, you have the denominator for the break-even calculation: your fee income needs to exceed this percentage of your deposited capital over the same time horizon.
The break-even fee rate is straightforward to derive. If you are depositing $10,000 into a pool and your expected IL over 90 days is 2.0%, you need to earn $200 in fees to break even on the opportunity cost of providing liquidity versus simply holding. That translates to a 2.0% return on capital over 90 days, or approximately an 8% annualized fee yield as a minimum threshold.
This is a higher bar than most LPs initially assume, because the fee yield figure quoted by most DeFi dashboards is an annualized APR based on recent volume. That number fluctuates dramatically. A pool reporting 15% APR based on last week's volume may deliver 3% APR over your actual 90-day holding period if volume drops. The break-even framework forces you to stress-test the fee income assumption, not just accept the headline number.
A useful rule of thumb for this stress-test: take the pool's 30-day average fee APR and apply a 50% haircut to model a conservative scenario. If the haircut APR still clears your break-even threshold, the position has a reasonable margin of safety. If it does not, the pool is dependent on exceptional volume conditions to remain profitable, which is a risk that compounds on top of the IL you are already absorbing.
Once you know your required fee yield, the next check is whether the pool's historical fee generation is structurally capable of delivering it. The key metric here is the volume-to-liquidity ratio (sometimes called the V/L ratio), which measures how efficiently the pool's liquidity is being used.
A pool with $10 million in total liquidity generating $100,000 in daily volume has a V/L ratio of 1%. At a standard 0.3% fee tier, that pool generates approximately $300 per day in total fees, distributed pro-rata across all LPs. A $10,000 position in that pool represents 0.1% of total liquidity and earns roughly $0.30 per day — about $27 over 90 days, or a 0.27% return. If your break-even threshold was 2.0%, you are structurally short by a factor of seven.
Contrast that with a pool of the same size but $1 million in daily volume. The same $10,000 position earns roughly $270 over 90 days — a 2.7% return that now clears a 2.0% break-even threshold with a margin. The impermanent loss did not change. The fee income changed because the V/L ratio is ten times higher.
This is why pool selection is not just about finding a low-IL pair. It is about finding the intersection of low price divergence risk and high capital efficiency. Stablecoin pools offer near-zero IL but often have low V/L ratios because they attract enormous amounts of liquidity chasing modest volume. High-volatility pools have elevated IL but sometimes generate enough fee income to compensate. The break-even framework makes this trade-off explicit and quantifiable rather than intuitive and approximate.
One cost that virtually every online impermanent loss calculator omits is the total transaction cost of entering, managing, and exiting an LP position. On Ethereum mainnet, the gas cost of depositing into a Uniswap V3 position, managing range boundaries if you are using concentrated liquidity, and eventually withdrawing can easily reach $50 to $150 in a single cycle depending on network congestion. On a $1,000 position, that friction alone represents 5% to 15% of capital — larger than the IL in most moderate-movement scenarios.
For smaller positions, this makes mainnet LP on complex protocols genuinely difficult to justify on a pure return basis. Layer 2 networks and alternative chains dramatically reduce this friction, which is one reason LP activity has migrated substantially toward Arbitrum, Base, and Optimism over the past two years. When running the break-even calculation, always add your estimated round-trip gas cost as a fixed dollar amount on top of the IL percentage, then recalculate the annualized fee yield required to cover both.
Once you work through all four steps, you will have a concrete picture of whether the pool you are considering can realistically generate enough fee income to offset your IL exposure, cover your transaction costs, and leave you with a net positive return. If the math does not work under conservative assumptions, no amount of optimism about volume or price stability will fix it.
For LPs who want to run this framework against live positions without manually pulling V/L ratios and fee data, Wallet Finder provides on-chain PnL tracking that surfaces actual fee income alongside your realized and unrealized impermanent loss in a single view — so the break-even analysis updates in real time as market conditions change.
Even after you've run the numbers through a calculator, some questions about impermanent loss always seem to pop up. Let's clear the air and tackle some of the most common ones I hear from other liquidity providers.
Yes, but there's a key nuance. The loss is only "impermanent" or on-paper while your tokens are still working in the liquidity pool. The second you pull your liquidity out, if the price ratio is different from when you went in, that loss becomes permanent and realized.
You might get lucky and the token prices could swing back to your original entry ratio, erasing the IL. But waiting around for that to happen is a gamble, and it's not a strategy I'd recommend relying on.
Absolutely. In fact, that's the entire point of being a liquidity provider. If you're in a pool with a ton of trading activity, the fees you collect can easily eclipse any impermanent loss from price swings. This is how you actually turn a profit.
The real game isn't just about dodging impermanent loss. It's about making sure your earnings from fees and any extra rewards are consistently higher than your IL. A winning LP position is one where (Trading Fees + Rewards) - Impermanent Loss = a Positive Return.
Most of the simple online tools don't. A standard impermanent loss calculator is built for one specific job: to show you the potential loss from price divergence in isolation. It deliberately leaves out trading fees and yield farming rewards so you can see the pure risk factor.
To get the full picture of your performance, you'll need a proper portfolio tracker. These tools calculate your total Profit and Loss (PnL) by stacking up all your earnings against the IL, giving you a true sense of whether your position is actually making money.
The safest bets are pools where the two assets have a very high price correlation. When the tokens in a pair move together, their price ratio stays stable, which dramatically cuts down the risk of impermanent loss.
You typically see this in two main types of pools:
Yes, and the difference is significant enough that treating a Uniswap V3 position the same as a V2 position in your calculations will give you badly wrong numbers. In a standard V2 pool, your liquidity is spread across the entire price curve from zero to infinity. In a Uniswap V3 concentrated liquidity position, you define a specific price range — for example, ETH between $3,000 and $5,000 — and your capital only works within that band.
The benefit is capital efficiency: because your liquidity is concentrated rather than thinly spread across all prices, you earn a much larger share of the fees generated while the price trades within your range. A well-placed concentrated position can earn five to twenty times the fee income of an equivalent V2 position at the same fee tier.
The cost is amplified impermanent loss within the range and a hard stop outside it. If ETH moves above $5,000 or below $3,000 in the example above, your position converts entirely to the less valuable asset and stops earning fees completely. Your IL at the boundary of a tight range is substantially higher than the standard 50/50 formula predicts, because the pool was rebalancing more aggressively the whole way there. For concentrated liquidity positions, use a V3-specific calculator that accepts your range boundaries as inputs — the standard formula is not a safe approximation.
This is the extreme end of the IL curve, and the math produces a total loss of the appreciating asset. If you deposit ETH and a token that subsequently collapses to near zero, the AMM will continuously sell your ETH to purchase more of the collapsing token in order to maintain the pool ratio. By the time the secondary token is worthless, the pool has exhausted your ETH position entirely. You are left holding a large quantity of a token worth nothing, and none of the ETH you originally deposited.
The impermanent loss formula confirms this: as the price ratio approaches zero (the secondary token losing all value), the IL approaches 100% of your ETH-equivalent position. In practice, the loss is permanent long before the token reaches absolute zero because by the time the price has dropped 90% to 95%, the IL has already consumed the majority of your appreciating asset.
This is why experienced LPs treat the choice of the second asset in any pair as a credit decision, not just a yield calculation. The yield on a high-APR pool is almost always compensation for the risk that the secondary token's value goes to zero. Whenever you are tempted by a pool offering unusually high fee income or farming rewards, the first question to ask is whether those rewards are structurally sustainable — and what happens to your ETH position if they are not.
Tax treatment of impermanent loss varies by jurisdiction and remains an area of limited explicit regulatory guidance in most countries. In the United States, the IRS has not issued specific rules on LP positions, but the general framework that tax practitioners apply is as follows.
The act of depositing tokens into a liquidity pool may be treated as a taxable disposal of the original tokens, establishing a new cost basis at the deposit price. When you withdraw, if you receive fewer tokens or tokens of lower combined value than you deposited, the difference may qualify as a capital loss — but only if the position is actually closed. Unrealized impermanent loss while your funds remain in the pool does not trigger a deductible event under any current interpretation.
Trading fees earned from LP positions are generally treated as ordinary income in the period they are received or become accessible, creating a tax liability even in years where the overall LP position produces a net loss after accounting for IL. This asymmetry — fees taxable as income, losses potentially deductible only as capital losses — can result in a higher effective tax burden than the raw PnL numbers suggest. Given the complexity and the limited precedent, consulting a tax professional with specific DeFi experience before reporting LP activity is strongly recommended.
Ready to stop guessing and get a live, accurate view of your DeFi positions? Wallet Finder.ai gives you on-chain PnL tracking that automatically factors in your earned fees against any impermanent loss. It’s the data you need to make smarter, more profitable decisions. See your true returns today at https://www.walletfinder.ai.

A premier DeFi analytics platform empowering traders to discover and analyze profitable blockchain wallets, trades and tokens.

