
Recovery Factor Calculation for Smart Traders
Master the recovery factor calculation to measure a strategy's resilience. Learn the formula, see DeFi examples, and find top wallets with Wallet Finder.ai.

June 20, 2026


Wallet Finder
March 11, 2026
A buy sell indicator is a tool that uses math to comb through historical price, volume, or on-chain data and spit out signals for when to get into or out of a trade.
Think of it like a traffic light for the market. It’s designed to flash a potential green light (buy), red light (sell), or yellow light (hold). These aren't crystal balls, of course, but they give you objective, data-driven insights to help manage risk and spot opportunities that you might otherwise miss.
At its core, a buy sell indicator turns a firehose of complex market data into simple, visual cues right on your trading chart. Instead of getting overwhelmed by a chaotic screen of price candles, traders use these tools to cut through the noise and focus on what really matters: potential shifts in market direction, momentum, or volatility.
It's like trying to guess how fast a car is moving just by watching it go by. You could make a decent guess, but you wouldn't be precise. An indicator is like the car's speedometer—it gives you a clear, objective reading of whether the trend is accelerating, slowing down, or about to reverse.
The real mission of any buy sell indicator is to swap emotional, gut-feeling decisions for a systematic, evidence-based approach. We’ve all been there—fear of missing out (FOMO) and panic selling are the twin demons that can wreck a portfolio. Indicators create rules-based triggers that force you to trade with discipline.
For instance, a simple moving average smooths out wild price swings to show you the real underlying trend. One classic example is the 200-day moving average (MA). A historically solid rule for major indices like the Dow is to buy when the price is above a rising 200-day MA and get out when it drops below. It's a method that helped traders sidestep massive meltdowns like the 2008 financial crisis.
While there are hundreds of indicators out there, they mostly fall into a few key categories, with each one built to answer a different question about the market. Getting a handle on these categories is the first step to building a trading system that actually works for you.
If you're looking for more practical tools, you might want to check out our guide on the top 7 tools for entry and exit signal alerts.
The real value of an indicator isn't just the signal it produces, but the discipline it enforces. It encourages traders to wait for confirmation, respect their strategy, and avoid impulsive decisions driven by market hype or fear.
To get you started, here’s a quick breakdown of the main indicator types you'll run into.
Every indicator has adjustable parameters — the RSI's lookback period, the moving average's length, the Bollinger Band's standard deviation multiplier. Traders obsessively backtest different settings to find the "perfect" combination that would have generated maximum historical returns. This optimization process creates catastrophic overfitting that guarantees future underperformance.
The math is seductive. You backtest RSI with periods from 2 to 50, test every combination, and discover that RSI(13) generated 73% win rate over the past five years while the standard RSI(14) only achieved 68%. You excitedly switch to the "optimized" parameter and deploy real capital, only to watch it fail immediately.
The problem is degrees of freedom. When you test fifty different parameter values, you're not finding a fundamental truth about market structure — you're finding the random combination that best fit the specific noise pattern of your historical dataset. It's like adjusting a lock's combination by trying every possible sequence until one opens it, then claiming you've discovered the "optimal" lock-picking method.
RSI(13) didn't outperform RSI(14) because thirteen periods has special predictive power. It outperformed because the specific sequence of price movements in your backtest period happened to align better with a thirteen-period calculation. Change the data slightly (different dates, different market) and RSI(13) becomes worse than RSI(14).
The statistical term for this is "multiple comparisons problem." Every additional parameter value you test increases the probability that one will appear to work purely by chance. Test fifty values, and mathematical certainty says at least one will show strong performance even if all fifty are actually useless.
Optimized indicators almost always underperform in live trading compared to their backtest performance. The gap between historical and forward results directly correlates to how heavily you optimized. Light optimization (testing 3-5 reasonable parameter values) causes modest degradation. Heavy optimization (testing hundreds of combinations) guarantees complete strategy failure.
Industry studies show strategies optimized to historical data decline by 30-70% in forward performance. A backtest showing 60% win rate might deliver 35-40% in real trading. If your backtest barely cleared 55% win rate, live trading might be break-even or losing.
This is why professionals use out-of-sample testing. After optimizing on data from 2015-2020, they validate on completely separate 2021-2022 data that wasn't used during optimization. If performance collapses on out-of-sample data, the optimization was overfitting, not discovering real market edges.
The only reliable optimization method is walk-forward analysis. Instead of optimizing once on all historical data, you iteratively optimize on rolling windows and test on the next period. Optimize on Year 1 data, test on Year 2. Optimize on Year 2, test on Year 3. Average the Year 2 and Year 3 results to get realistic performance expectations.
This mimics real trading where you must periodically re-optimize as markets evolve. If your indicator's performance stays relatively stable across multiple walk-forward periods, it might reflect genuine market structure rather than overfitting.
But if performance swings wildly between periods, or only works when you use different parameters for each period, you're curve-fitting noise. The indicator has no real predictive power — you're just finding different random patterns in each dataset.
The brutal truth is that most heavily optimized indicators are worse than just using standard default parameters that thousands of other traders use. The defaults (RSI 14, MA 50/200, Bollinger 20-period 2-SD) survive because they're robust across many market conditions, not because they're optimal for any specific condition.
Every buy/sell indicator you'll ever use falls into one of three buckets, each built to answer a specific question about what the market is doing right now. Think of them like different specialists on a medical team. One checks the patient’s general health, another measures their heart rate, and the third assesses their mood swings. Getting a handle on these three types is your first real step toward building a trading strategy that actually makes sense.
Instead of just slapping random indicators on your chart and hoping for the best, understanding their purpose lets you pick the right tool for the job. You wouldn't use a thermometer to check blood pressure, right? Same logic applies here—you don't use a volatility indicator to confirm a trend.
Let's break down what each of these categories actually does.
Trend-following indicators are your trading compass. Their one and only job is to show you the market's general direction. They cut through the noise of day-to-day price swings to reveal the underlying current, helping you figure out if you should be hunting for buys or sells. Their goal is simple: keep you on the right side of the market.
Key Actionable Uses:
The most famous trend indicator is the Moving Average (MA). It just calculates the average price of an asset over a set period, smoothing it out into a single, flowing line on your chart. When the price stays consistently above the MA, you’re likely in an uptrend. If it's below, you're in a downtrend.
If trend indicators are your compass, momentum oscillators are your speedometer. They measure the speed and strength of price moves, telling you if a trend is picking up steam or about to run out of gas. These tools bounce back and forth between set levels, which helps you spot overbought (potentially overpriced) or oversold (potentially underpriced) conditions.
Momentum doesn't just measure speed; it measures conviction. A price move on strong momentum is more likely to continue, while a move on weakening momentum may be nearing a reversal.
Key Actionable Uses:
These indicators are gold for timing your entries and exits. For example, if your moving average confirms you're in an uptrend, you might wait for the RSI to dip into oversold territory before pulling the trigger on a buy.
Finally, volatility indicators act like the market's barometer, measuring how much prices are swinging around. They tell you if the market is calm and cruising or completely chaotic. This is critical for managing your risk and spotting potential breakout moves before they happen.
The textbook example is Bollinger Bands (BB). This indicator draws three lines on your chart: a moving average in the middle and two outer bands that are usually set two standard deviations away from it.
Key Actionable Uses:
Volume is another huge piece of this puzzle, telling you how much conviction is behind a move. To really get a feel for the tug-of-war between buyers and sellers, you can learn more about how Cumulative Volume Delta provides key insights into who's actually in control. When you start combining these different types of indicators, you get a much clearer, more complete picture of what the market is telling you.
Some indicators look phenomenal in backtests, showing perfect buy signals at every bottom and sell signals at every top. But when you trade them live, the signals appear, disappear, and reappear as new price data arrives. This repainting behavior makes historical performance completely misleading — the perfect signals in your backtest never actually existed in real-time.
Repainting happens when an indicator recalculates its historical values as new data arrives. What showed as a buy signal three bars ago might retroactively change to no signal once the current bar closes. Your backtest sees the final, post-repainting values and thinks the indicator was brilliantly accurate. Real traders saw the preliminary signals that later disappeared.
The most common repainting source is indicators using "future" data to calculate past signals. Zig Zag indicators are notorious for this — they draw beautiful trendlines connecting swing highs and lows, but those swing points are only identified after price moves far enough in the opposite direction to confirm them.
In backtest, Zig Zag shows a sell signal exactly at the top. But live trading reveals the signal didn't trigger until price had already fallen 10-15% to confirm the swing high was complete. You enter the trade 10-15% late, destroying the profitability the backtest promised.
Pivot point indicators suffer similar issues. They mark support and resistance levels that look predictive in hindsight but required future price action to calculate. The "support level" that perfectly caught the bounce wasn't drawn until after the bounce occurred.
Even seemingly straightforward indicators can repaint if coded incorrectly. Some moving averages recalculate their entire history when parameters change or when new data updates. What showed as a bullish crossover two days ago might retroactively shift to bearish when today's price arrives.
The test is simple: does the indicator's value at historical bar N ever change after bar N+1, N+2, or later bars arrive? If yes, it repaints. Non-repainting indicators calculate their values using only data available up to that bar, and those values never change regardless of future price action.
Practical detection: Mark a signal on your chart, wait for several new bars to form, then scroll back. If the signal moved, changed, or disappeared, the indicator repaints. Many platforms even explicitly label indicators as "Repainting" in their documentation, though many traders ignore these warnings.
The worst are partially repainting indicators. The final signal doesn't repaint, but preliminary signals during the bar formation do. You see a buy signal appear mid-bar, enter the trade, then watch the signal vanish before the bar closes. Your backtest never saw these false preliminary signals because it only evaluated completed bars.
Some repainting is acceptable if you understand it and wait for confirmation. If you know your indicator needs three bars after a swing high to confirm it, you can incorporate that delay into your strategy. The problem is traders who backtest repainting indicators without understanding the real-time delay, creating impossible performance expectations.
The professional solution is avoiding repainting indicators entirely or using only their non-repainting versions. Many platforms offer "On-Close" indicator variants that only calculate when bars complete, eliminating intra-bar repainting. These show worse backtest performance (because they include the confirmation delay) but deliver realistic real-time results.
Alternatively, explicitly delay your backtests by the confirmation period. If your indicator needs three bars to confirm signals, backtest as if you enter three bars after each signal triggers. This reveals the true performance including the necessary wait time.
Picking the right buy sell indicator can feel like staring into a massive toolbox—sure, there are dozens of options, but each one is built for a specific job. One might be a sledgehammer, perfect for riding long, powerful trends. Another is more like a scalpel, designed to spot quick reversal opportunities in a choppy, sideways market.
It's not about finding the single "best" indicator. That's a myth. The real skill is learning which tool works best for the current market conditions and your personal trading style.
To get there, you have to look past the textbook definitions and see how these tools perform in the wild. Some indicators are built to follow the market's direction, others measure its internal energy, and a third type gauges its wild emotional swings.
This flowchart breaks down the three core functions that indicators measure: Trend, Momentum, and Volatility.
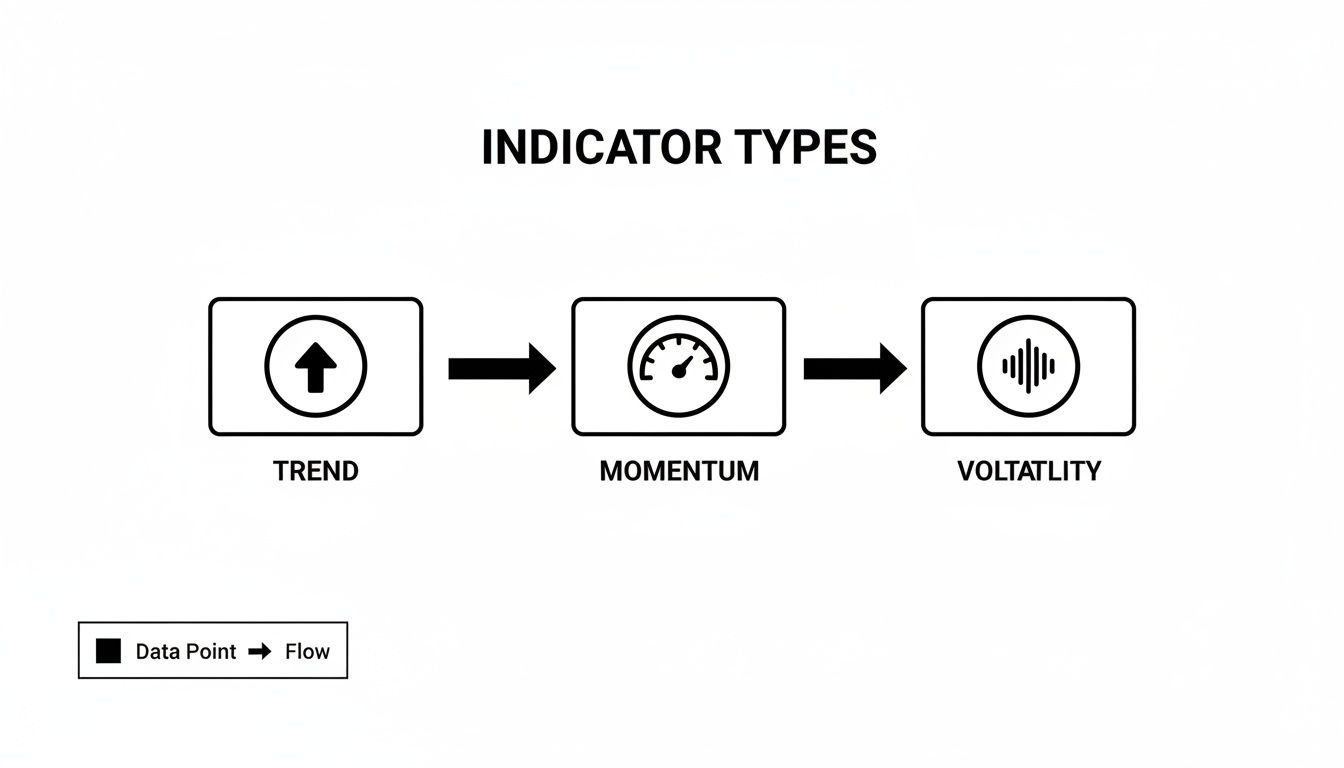
Before you even add an indicator to your chart, the first step is knowing what you're trying to accomplish. Do you need to confirm a trend, measure buying pressure, or anticipate a breakout? Answering that will point you to the right tool.
Let's put the most popular indicators to the test. Every single one has distinct strengths that make it shine in certain scenarios and glaring weaknesses that make it a liability in others.
A trend-following indicator like a Moving Average, for example, will drive you crazy with false signals in a sideways market. But in that same environment, a momentum oscillator like the RSI would be right at home, helping you pinpoint tops and bottoms.
This is exactly why blindly slapping the same indicator on every chart, for every asset, is a recipe for disaster. You need a more thoughtful approach—one that matches the tool to the environment.
This table gives you a head-to-head comparison of four of the most common indicators. I’ve broken them down by their core function, the ideal market conditions for using them, and the specific signals they generate.
Moving Averages are the foundational trend-following tool, best deployed in markets showing a strong directional move either up or down. A buy signal occurs when price crosses above the MA line and holds there, or when a faster-period MA crosses above a slower one. The sell signal is the mirror image: price crossing and staying below the MA, or the faster MA crossing below the slower. Their reported win rate of roughly 30 to 50 percent varies considerably by the period chosen, which reflects the core limitation of trend-following tools — they perform well when a trend is sustained but generate frequent false signals in choppy or sideways conditions.
The RSI is a momentum oscillator that earns its strongest results in ranging, sideways markets where price oscillates between predictable levels. A buy signal triggers when the RSI moves out of oversold territory below 30 and recovers upward; a sell signal triggers when it exits overbought territory above 70 and turns back down. With a reported win rate of approximately 71 percent at the standard period-14 setting, the RSI is the standout performer in this group, though that figure applies specifically to ranging market conditions and should not be expected to hold in a strongly trending environment.
The MACD straddles the line between momentum and trend, making it most useful for identifying the emergence of a new trend or a shift in momentum rather than timing entries within an established move. Its buy signal is a crossover of the MACD line above the signal line, and its sell signal is the reverse. The reported win rate of 37 to 45 percent is the lowest in this group, which reflects the MACD's tendency to lag price and fire signals after the early portion of a move has already occurred.
Bollinger Bands are the most versatile tool of the four, functioning usefully in both ranging and breakout environments. In a ranging market, price touching the lower band during an uptrend is a buy signal, while touching the upper band during a downtrend is a sell signal. In a breakout context, a decisive close above the upper band after a squeeze is a buy signal, and a break below the lower band is a sell. Their reported win rate of 65 to 70 percent reflects this adaptability, though extracting that performance requires correctly reading which of the two market contexts is currently in play before applying the signal.
Looking at the data, one thing becomes crystal clear: an indicator’s effectiveness is completely situational. No single tool wins every time.
A trader's job isn't just to find good signals, but to understand the context in which those signals are generated. The best buy sell indicator is the one that aligns with the current market's personality.
This is where real performance data becomes so valuable. In a massive backtest covering over 100 years of market history, the Relative Strength Index (RSI, period 14) and Bollinger Bands were the clear standouts. The RSI(14) pulled off an impressive 71.64% win rate, absolutely crushing the 50-period SMA (30.85%) and MACD (37.56%). It just goes to show how powerful it can be for spotting overbought and oversold extremes. You can dive deeper into these results and learn more about technical indicator performance.
So, how do you pick the right tool for the job? It all comes down to what you're trying to do and what the market is doing right now.
Here’s a simple framework to guide your decision:
By starting with the market’s behavior, you can pick an indicator that’s naturally suited for that environment. This dramatically improves its reliability and cuts down on frustrating false signals. It’s a much smarter approach than trying to force one indicator to work in all conditions.
Indicators calibrated during specific market conditions fail catastrophically when regimes change. The RSI parameters that worked perfectly during 2020's low-volatility trending markets generated endless false signals during 2022's high-volatility chop. Traders who optimize indicators on recent data are systematically preparing for the last war, not the next one.
Market regimes are distinct periods characterized by volatility level, trend persistence, and correlation structures. Low-volatility regimes feature smooth trends where trend-following indicators excel. High-volatility regimes feature violent whipsaws where momentum oscillators shine. Regime shifts happen suddenly, rendering indicators optimized for the previous regime worse than useless.
ATR (Average True Range) expanding 100-200% from lows to highs marks major regime changes. An indicator calibrated when ATR was 50 will be far too sensitive when ATR hits 150. What used to be a significant overbought reading is now routine intraday noise. Your signals fire constantly, destroying edge through commission costs and emotional fatigue.
Moving average crossovers worked beautifully in 2019-2020 when Bitcoin trended smoothly upward for months. Traders optimized MA periods, discovered 50/200 crossovers generated 70% win rates, and deployed capital. Then 2022 arrived with violent 20-40% swings over weeks. The same MA crossovers whipsawed endlessly — bullish Monday, bearish Wednesday, bullish Friday — racking up losses on every false breakout.
The win rate collapsed from 70% to 35% not because the indicator broke, but because the market regime changed from trending to ranging. Trend-following tools systematically fail in ranging markets. No amount of parameter optimization fixes this because the fundamental market structure shifted.
More subtle are correlation regime changes affecting cross-asset strategies. An indicator using stock-bond correlation worked when correlation was stable. When correlation flips (stocks and bonds falling together instead of alternating), the indicator's signals become inverse to reality.
Crypto correlation regimes shift violently. Altcoins tracking Bitcoin with 0.9 correlation suddenly decouple to 0.3 correlation during regime changes. Indicators using Bitcoin as a leading signal for altcoins stop working entirely. Your backtest showing Bitcoin moves predict altcoin moves was calibrated during high-correlation regime and fails during low-correlation periods.
Professionals don't optimize indicators once and deploy forever. They implement regime detection that adjusts indicator parameters or switches between different indicator types based on current market structure.
Simple regime detection: calculate 30-day ATR vs 180-day ATR. If ratio exceeds 1.5, you're in high-volatility regime — use momentum oscillators and tighter stops. If ratio below 0.7, you're in low-volatility regime — use trend-following indicators and wider stops.
More sophisticated approaches use machine learning to classify regimes based on multiple features (volatility, volume patterns, correlation structures). The system automatically selects indicator sets appropriate for detected regime, or adjusts parameters dynamically.
Without regime awareness, you're trading as if market structure is constant. This works until it catastrophically doesn't. The regime shift wipes out months of profits in weeks as your indicators signal in exactly the wrong direction for the new environment.
Relying on just one buy/sell indicator is a rookie mistake. It’s like trying to navigate a ship with only a compass—sure, it tells you which way is north, but it says nothing about the storm brewing ahead or the iceberg hiding just under the surface. This tunnel vision is a fast track to false signals and expensive trading errors.
The secret to stacking the odds in your favor is confluence. This is just a fancy term for getting multiple, unrelated indicators to agree on the same trade idea. When your trend, momentum, and volume indicators all flash the same signal, you've got something far more reliable. It's the market's equivalent of getting a second and third opinion before making a big decision.
You don't need a perfect, mythical indicator. Instead, smart traders build simple, repeatable systems that combine the strengths of a few proven tools. Below are two straightforward strategies you can start using right away to build much stronger, more confident signals.
This one is all about going with the flow. The goal is to identify a strong, dominant market trend and then use a momentum tool to pinpoint the perfect moment to jump in during a temporary dip. It’s for traders who’d rather ride the wave than try to swim against it. The plan is simple: confirm the bigger trend, then patiently wait for a pullback to buy.
Here is the step-by-step action plan:
Tools Needed:
Actionable Checklist:
This combination ensures you aren't just buying at random. You're strategically entering a strong trend at a much better price.
Breakout trading is exciting. It’s about catching those sudden, explosive price moves that happen after the market has been quiet for a while. The problem? Many breakouts are fakes, designed to trap eager traders. This strategy helps you tell the real deal from the imposters by using trading volume as your lie detector.
Tools Needed:
An explosive price move without a corresponding spike in volume is a major red flag. It suggests there's no real conviction behind it, and the breakout is likely to fizzle out and reverse.
Here’s how to put the pieces together to spot a high-probability breakout:
The breakout confirmation strategy unfolds in four sequential steps, each one building on the last to filter out weak signals and isolate only the highest-probability setups.
The first step is identifying the setup. Using Bollinger Bands, you are watching for the upper and lower bands to contract significantly toward each other, forming what is known as a squeeze. When the bands are this narrow, the market has entered a low-volatility consolidation phase, and that compression of energy typically precedes an explosive directional move in one direction or the other.
The second step is the trigger. Once the squeeze is in place, you wait for price to break decisively above the upper band as a potential buy signal or below the lower band as a potential sell signal. This price action tells you the breakout has begun, but confirmation has not yet arrived, so no trade is placed at this stage.
The third step is confirmation, and it is the most important filter in the sequence. You check whether trading volume has surged meaningfully above its recent average at the moment of the breakout. High volume signals that real market participation is behind the move, which makes it substantially more likely to follow through. A breakout on thin or average volume lacks that participation and should be treated with significant skepticism, as these low-volume moves frequently reverse back into the prior range.
The fourth and final step is execution. Once the breakout candle has fully closed with volume confirmation behind it, you enter the trade and place a stop-loss just inside the boundary of the broken range. At this point your position is active, your risk is clearly defined, and every condition in the sequence has been satisfied before a single dollar was committed.
By waiting for all conditions—the squeeze, the price break, and the volume spike—you can filter out weak signals and focus only on the most promising opportunities. This methodical approach is what separates guessing from strategically using a buy/sell indicator.
While the old guards like RSI and Moving Averages are still foundational, the trading world never sits still. To really get an edge, you have to look past the standard toolkit and tap into deeper, more modern data streams. This is doubly true in crypto, where the blockchain itself is a wide-open book of market activity.
This is exactly where on-chain analysis changes the game. Instead of just staring at price charts, on-chain indicators dive into raw blockchain data. They measure things like investor sentiment, the flow of capital, and the overall health of the network, offering a layer of context that price action alone just can't give you.
Think of on-chain metrics as an X-ray of the market. They let you see what different players are doing, from the smallest retail holders to the massive "whale" wallets that can move markets. This gives you a much richer picture of supply and demand dynamics. You can learn more about the fundamentals in our complete guide to on-chain analysis.
Here are a few powerful examples of what this looks like in practice:
On-chain indicators shift the focus from what the price is doing to what investors are doing. This provides a leading edge, as investor behavior often precedes major price movements.
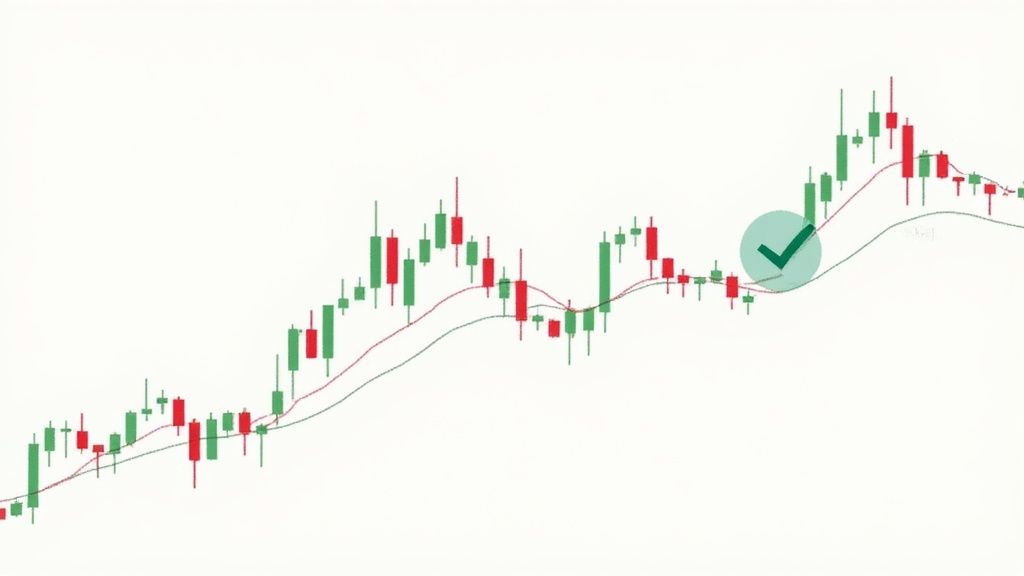
This screenshot from a platform like TradingView shows how traders can overlay multiple advanced indicators to build a more complete market picture.
The chart visualizes how a combination of price, volume, and specialized indicators come together to form a comprehensive trading dashboard.
Beyond just on-chain data, a new wave of technical indicators is using smarter algorithms that can actually adapt to changing market conditions. Unlike old-school tools with fixed formulas, these adaptive indicators are much better at filtering out the market noise and locking onto real trends.
For example, some modern tools now use artificial intelligence to analyze tons of data points at once, creating a much more dynamic buy sell indicator. These systems can even learn from their past performance to get more and more accurate over time.
One such tool, the Trend Speed Analyzer (TSA), produced a staggering 478% return in backtests on volatile currency pairs. That blew the 63% gain from a simple buy-and-hold strategy out of the water. With a 56% win rate and a 1.7 profit factor, its ability to latch onto genuine trends shows just how powerful these modern, adaptive algorithms can be. You can dive into a detailed breakdown of these innovative indicator findings to see exactly how they work.
These advanced tools represent the next step in technical analysis, offering a smarter way to navigate today's complex markets.
A buy sell indicator produces a signal. What it cannot produce is judgment. The difference between a trader who profits consistently and one who loses money on technically correct signals is almost always the presence or absence of a validation framework — a set of conditions that must be met before a signal is acted upon. Without this layer, even a high-probability indicator becomes a mechanism for impulsive execution.
A signal validation framework is not a second set of indicators. It is a checklist of contextual conditions that confirm the signal is occurring in an environment where it is likely to behave as expected. The framework answers three questions before any trade is placed: Is the signal occurring in the right market phase? Is there sufficient volume behind the move to suggest real participation? And does the signal align with or contradict the higher timeframe trend?
Every indicator performs differently depending on whether the market is trending, ranging, or transitioning between the two. A momentum oscillator like the RSI produces reliable reversal signals in a ranging market but generates chronic false signals in a strongly trending one, because an overbought reading in a bull trend can persist for weeks before price actually corrects. Conversely, a moving average crossover works well in a trending environment but produces whipsaw signals in sideways conditions where price crosses back and forth through the average without meaningful follow-through.
The practical step is to classify the market's current phase before interpreting any signal. The simplest approach is to check the slope and spacing of two moving averages simultaneously. If a shorter-period MA is cleanly above a longer-period MA with clear separation and both are sloping in the same direction, the market is trending. If the two MAs are intertwining and nearly flat, the market is ranging. This two-second check determines which category of indicators deserves trust and which ones should be treated with skepticism.
Applying the wrong indicator to the wrong market phase is the single most common source of repeated small losses in systematic trading. The signal is not wrong; the context in which it is being applied is wrong. A validation framework prevents this by building the phase check into the routine before a signal is even evaluated.
Volume is the most underused validation layer available to most traders. Price movement without corresponding volume expansion is structurally weak. It indicates that few participants are behind the move, which means the move is more susceptible to reversal as soon as any meaningful selling or buying pressure arrives from the other side.
The validation rule is straightforward: a buy signal should be accompanied by volume that is at or above the recent average for that asset and timeframe. A sell signal should show the same. When a breakout occurs on volume that is well below average, the probability that the breakout fails and price returns into the prior range is significantly elevated. This is not a theoretical concern; it is a consistently observable pattern across asset classes and timeframes.
For crypto specifically, volume analysis carries additional weight because the asset class trades on multiple exchanges simultaneously and is highly sensitive to whale activity. A price spike on thin volume on a decentralized exchange may reflect a single large order that has temporarily moved the market rather than genuine broad-based demand. Checking whether volume is confirming price action before entering on an indicator signal eliminates a meaningful proportion of false entries without requiring any additional indicators.
The final validation layer is timeframe alignment. Every signal exists within a larger context, and signals that occur in the direction of the higher timeframe trend have a statistically better outcome than counter-trend signals. This is sometimes called multi-timeframe confluence, and it is one of the most reliable structural edges available to any systematic trader.
The practical application is simple. If you are trading off a four-hour chart, check the daily chart before acting on any signal. If the daily chart shows a clear uptrend, long signals on the four-hour chart have the wind behind them and short signals carry additional risk because they require the larger trend to either pause or reverse. If the daily chart is in a clear downtrend, short signals on the four-hour chart are structurally favored and long signals require additional confirmation before they justify the risk.
This check adds no complexity to the analysis. It is a 15-second review that fundamentally changes the expected value of acting on any given signal. A buy sell indicator signal taken with all three validation layers aligned — correct market phase, volume confirmation, and higher timeframe trend alignment — is a qualitatively different trade than the same signal taken without that confirmation. The framework does not guarantee winning trades, but it systematically improves the quality of the trades you take and reduces the frequency of entries that had no structural basis to begin with.
Technical indicators are built from price and volume data. They are backward-looking by design, calculating values based on what has already happened in the market. This is not a flaw — it is simply the nature of the input. The implication is that any edge derived purely from technical indicators is, at best, a probabilistic assessment of what is likely to happen based on patterns that have historically repeated. What technical indicators cannot do is tell you what the market's most sophisticated and well-capitalized participants are doing right now.
This is the gap that on-chain intelligence fills when used alongside traditional buy sell indicators. Blockchain data is not backward-looking. It is a real-time record of exactly what every market participant — from the smallest retail wallet to the largest institutional-scale address — is doing with their capital. When on-chain behavior from high-performing wallets aligns with a technical signal, the combined signal carries a level of conviction that neither source could produce independently.
Not all on-chain activity carries equal informational weight. The wallet behavior that matters for trading decisions is the behavior of addresses with a documented track record of profitable positioning across multiple market cycles. These wallets — often called smart money in market analysis — tend to accumulate positions before price moves are widely recognized and reduce exposure before corrections that, in hindsight, seemed obvious.
Identifying this behavior requires tracking realized profit and loss across wallet addresses, filtering for consistent win rates over extended periods, and monitoring position changes in real time. When a cluster of high-performing wallets begins accumulating a specific asset while your technical indicators are showing an early-stage bullish setup, the probability that the technical signal resolves favorably is meaningfully higher than when the same technical signal appears without that on-chain confirmation. The wallets with the best track records are, in aggregate, a more reliable forward-looking signal than any formula applied to historical price data.
The reverse is equally useful. If your buy sell indicator is generating a buy signal but on-chain data shows that experienced wallets are quietly reducing their exposure to the same asset, that divergence is a reason to wait rather than act. It does not mean the technical signal is wrong, but it does mean the risk profile of acting on it has changed.
The practical integration does not require abandoning your existing indicator system. The workflow addition is a pre-trade check that takes place after your technical setup has been identified but before you execute. Once your indicators have flagged a potential entry, you check the on-chain positioning of high-performance wallets in that asset to assess whether their behavior is consistent with or contradictory to your technical thesis.
When both sources align, you have the highest-confidence version of the trade available to you. When they diverge, you have two choices: wait for alignment to develop, or reduce your position size to reflect the lower-conviction environment. Both responses are more disciplined than ignoring the divergence and executing at full size based on the technical signal alone.
Wallet Finder makes this integration practical by surfacing high-performance wallet activity in real time, allowing you to check on-chain positioning against your technical setups without manually tracking individual addresses across multiple block explorers. The combination of technical signals with smart money confirmation is one of the most structurally sound approaches to trade validation available in crypto markets today. Start finding winning wallets at Wallet Finder.
The reason the combined approach outperforms is structural. Technical indicators identify patterns in price behavior. On-chain intelligence identifies patterns in participant behavior. Price is a lagging reflection of what participants are doing with their capital. When participant behavior and price pattern analysis point in the same direction, the lag between participant action and price response becomes your entry window.
Acting on a technical signal with on-chain confirmation means entering after sophisticated capital has already positioned but before the price has fully reflected that positioning. This is the structural definition of buying before the move rather than into it. It is not a guarantee of any specific outcome, but it represents the most complete and logically consistent use of available market data, combining what historical price patterns suggest with what current participant behavior indicates. That combination is the most reliable basis for a high-confidence trade decision that systematic trading has to offer.
Even after you get the hang of how a buy sell indicator is supposed to work, a few questions always pop up when you try to put it all into practice. Let's tackle some of the most common ones head-on with practical answers to give you some extra clarity and confidence.
Think of this as a final sanity check before you start clicking buttons. It’s all about making sure you’re using these tools realistically and safely.
This is the million-dollar question, but the honest answer is: there isn't one. No single indicator is the "most accurate" in every single situation. An indicator's effectiveness really boils down to the market condition, the asset you're trading, and your timeframe. It’s the classic case of needing the right tool for the job.
For instance, plenty of backtesting shows the RSI can have a high win rate for spotting overbought and oversold levels, but it shines brightest in ranging (sideways) markets. On the flip side, the 200-day Moving Average is a historically reliable workhorse for confirming long-term trends in major stock indices, but it will give you tons of false signals in a choppy, directionless market.
The search for a single, perfect indicator is a trap. Success comes from learning to diagnose the market’s personality—trending, ranging, or volatile—and then deploying the indicator best suited for that specific environment.
The smartest approach is to look for confluence—using a combination of indicators to confirm signals—and to adapt your toolkit to what the market is telling you right now.
Absolutely not. Relying on a single indicator for your trading decisions is a recipe for disaster. Indicators are just math formulas based on past price data. Because of this, they are reactive, not predictive, and they can and will give you false signals.
A solid trading strategy uses indicators as just one piece of a much larger puzzle. That puzzle should always include other forms of analysis, like:
Above all else, your risk management rules need to be your top priority. Setting a stop-loss to define your maximum acceptable loss is the one thing that will protect your capital over the long run. Never, ever ignore it, no matter how perfect an indicator's signal looks.
Getting started is actually pretty simple on most modern trading platforms. It doesn't matter if you're using TradingView, MetaTrader, or the charting tools baked into your broker's website—the process is nearly identical.
Here’s a quick 3-step guide:
(fx).Pro-Tip: Always practice on a demo or paper trading account first. It lets you get a feel for how different indicators behave without risking a single dollar.
Mark a signal on your live chart, wait for 3-5 new bars to form, then scroll back to the marked signal. If it moved, changed, or disappeared, the indicator repaints. Non-repainting indicators calculate values using only data available at that bar, and those values never change.
Check platform documentation for "Repainting" warnings many indicators include. Zig Zag, Pivot Points, and some custom indicators are notorious for repainting — they identify swings or levels only after future price confirms them, making backtests look perfect while live signals lag significantly.
Use "On-Close" indicator variants that only calculate when bars complete, eliminating intra-bar repainting. Alternatively, explicitly delay backtests by the confirmation period (if indicator needs 3 bars to confirm, backtest as if entering 3 bars after each signal).
You overfitted the parameters to historical noise rather than discovering real market structure. Testing 50 different RSI periods and selecting the best performer (RSI 13 vs standard RSI 14) finds the random combination that best fit your specific backtest data, not a fundamental edge.
Forward performance typically declines 30-70% from optimized backtests due to multiple comparisons problem — testing many parameter values guarantees one appears good by pure chance. Use out-of-sample testing: optimize on 2015-2020 data, validate on separate 2021-2022 data never used in optimization.
Implement walk-forward analysis: optimize on Year 1, test on Year 2, optimize on Year 2, test on Year 3. If performance stays stable across periods, it reflects real structure. If it requires different parameters each period, you're curve-fitting noise. Default parameters (RSI 14, MA 50/200) often outperform heavily optimized values.
No, these have 0.85+ correlation — they're calculating nearly identical information from different formulas, not independent confirmation. Requiring all three to align just delays entries without filtering false signals. You're getting the same signal measured three ways, not three independent verifications.
True confluence requires combining uncorrelated indicators from different categories: one trend (MA), one momentum (RSI), one volatility (ATR), one volume (OBV). These measure different market dynamics with low correlation, providing genuine multi-factor confirmation.
Calculate pairwise correlation between your indicators on historical data. Any pair above 0.70 correlation is functionally redundant — pick one and drop the other. The removed indicator contributed <15% unique information while increasing parameter complexity and overfitting risk.
Signal strength is a function of how many independent factors are aligned at the same time rather than any single metric crossing a threshold. A strong signal has at least three elements working together: the indicator itself is generating a clear reading rather than hovering ambiguously near a boundary level, the market phase is appropriate for that indicator type, and volume is supporting the price movement that triggered the signal. When all three are present, the probability of the signal resolving in the expected direction is meaningfully higher than when only the indicator reading is present. The practical rule is that a signal without volume confirmation and market phase alignment is a watch-list candidate, not an entry trigger. Acting only on fully confirmed setups reduces trade frequency but significantly improves the quality of the trades taken, which is the structural foundation of any profitable systematic approach.
The gap between backtest performance and live trading results is one of the most common frustrations in systematic trading, and it has several consistent explanations. The most significant is overfitting: indicators optimized on historical data to produce impressive-looking results have often been tuned so specifically to past market conditions that they lack the flexibility to perform across new environments. A related problem is that backtests typically assume you can enter and exit at the exact price the signal fired, which is unrealistic in live markets where slippage, spread, and execution delays affect every trade. A third factor is market regime change. Indicators calibrated during a trending period will underperform during an extended ranging period, and vice versa, because the market's behavior has structurally changed in ways that historical data did not anticipate. The most practical response is to treat backtest results as a rough directional guide rather than a performance forecast, to test across multiple market regimes rather than a single favorable period, and to reduce position size significantly when deploying a system in live conditions for the first time until real performance validates the backtest assumptions.
A leading indicator attempts to predict future price movement by measuring conditions that historically precede a directional change. Momentum oscillators like the RSI are the most common examples; they identify overbought and oversold conditions before price has necessarily reversed. A lagging indicator confirms what has already happened by calculating values based on historical price data. Moving averages are the clearest example; a moving average crossover confirms that a trend has changed after the price has already moved. Neither type is superior in all circumstances, and the practical approach is to use both in complementary roles. Leading indicators are most useful for identifying potential entry and exit zones in advance, particularly in ranging markets where price regularly revisits predictable levels. Lagging indicators are most useful for confirming trend direction and filtering out counter-trend signals that would otherwise produce losses. Using a leading indicator for timing combined with a lagging indicator for trend confirmation is one of the most structurally sound two-indicator combinations available, because each one compensates for the primary weakness of the other.
Ready to move beyond basic indicators and see what the smartest traders are doing in real time? Wallet Finder.ai turns on-chain data into actionable signals, allowing you to discover and mirror the strategies of top-performing crypto wallets. Start your 7-day trial and trade with an edge.

A premier DeFi analytics platform empowering traders to discover and analyze profitable blockchain wallets, trades and tokens.

