
Recovery Factor Calculation for Smart Traders
Master the recovery factor calculation to measure a strategy's resilience. Learn the formula, see DeFi examples, and find top wallets with Wallet Finder.ai.

June 20, 2026


Wallet Finder
March 4, 2026
Impermanent loss happens when the value of tokens in a DeFi liquidity pool changes compared to holding them directly. This can reduce your returns, especially if prices fluctuate significantly. To manage this risk, tools that provide real-time tracking, analytics, and alerts are essential. Below are the top tools to help you monitor and manage impermanent loss effectively:
Wallet Finder.ai offers real-time alerts and wallet performance tracking, priced at $26 to $49 per month.
APY.vision covers IL tracking and cross-chain analytics with detailed IL analysis, available on free and premium plans.
DefiLlama provides TVL tracking and protocol health insights for free macro-level monitoring, completely free to use.
Defi-Lab delivers advanced simulations and risk tools at a research-level analytics depth, available on a subscription basis.
Zapper combines a unified dashboard with simple portfolio tracking, available on free and premium tiers.
Each tool offers different features for managing impermanent loss. Choose based on your needs, whether that is free macro-level insights or detailed analytics for advanced strategies.

Wallet Finder.ai is a comprehensive tool for tracking DeFi wallets. It helps you monitor your portfolio, track profit and loss, and assess risks like market changes and impermanent loss. With features like real-time updates, historical data analysis, and wallet integration, it’s built to keep you informed and in control.
Stay updated with instant Telegram alerts about wallet activities. Whether it’s a major market shift or a critical portfolio update, you’ll get notified right away, helping you make timely decisions. To refine your tracking even further, explore Top Tools for Token-Specific Filtering and learn how to focus only on the assets that truly matter to your trading strategy.
The platform provides visual tools like graphs and charts to analyze past performance. These insights can help you identify trends and manage risks better. Plus, you can export blockchain data for offline analysis, giving you the flexibility to dive deeper into your wallet activity.
Wallet Finder.ai allows you to connect your wallets to track your positions across liquidity pools. You’ll get real-time performance metrics to refine your entry and exit strategies. Advanced filters make it easy to sort wallets by profitability, create custom watchlists, and even learn from the strategies of top-performing wallets.
Managing impermanent loss is a big deal for DeFi providers, and APY.vision steps in with tools that make it easier. This platform specializes in tracking liquidity pool gains and impermanent loss, offering detailed analytics to help users stay on top of their investments. With more than 70,000 users and billions of dollars in tracked assets, APY.vision has become a go-to resource for DeFi investors aiming to keep a close eye on their positions. Its tracking features work hand-in-hand with other advanced tools covered in this article.
One of APY.vision’s standout features is its broad multi-chain and protocol support. It works across 11+ blockchains and supports a variety of protocols, making liquidity and yield tracking effortless. This cross-chain functionality lets users keep tabs on transactions across multiple DeFi platforms from one place.
Supported networks include leading ecosystems like Ethereum, Solana, Avalanche, Fantom, Polygon, Optimism, Arbitrum, and Binance Smart Chain (BSC). Thanks to this extensive coverage, users can monitor their entire DeFi portfolio from a single dashboard, no matter which chains they’re using.
"Chainstack offers support to an extensive range of networks that our users prefer and are currently on. Their RPC nodes are stable and perform well, which is why we recommend them for their services." – Tom Chan, Founder and Core Developer, APY.vision
Another powerful feature of APY.vision is its ability to provide historical analytics. The platform offers detailed profit-and-loss reports, showing how much users have gained or lost over time. By organizing and indexing DeFi analytics data, it helps users make smarter decisions about when to enter or exit liquidity pools.
"The goal of the APY.vision platform is to aggregate and index DeFi analytics data, essentially providing a historical profit and loss breakdown for its users." – Chainstack Blog
Users can also analyze historical impermanent loss trends to understand how market conditions have impacted their liquidity positions over time. This kind of insight is invaluable for planning long-term strategies and navigating the ups and downs of the DeFi landscape.
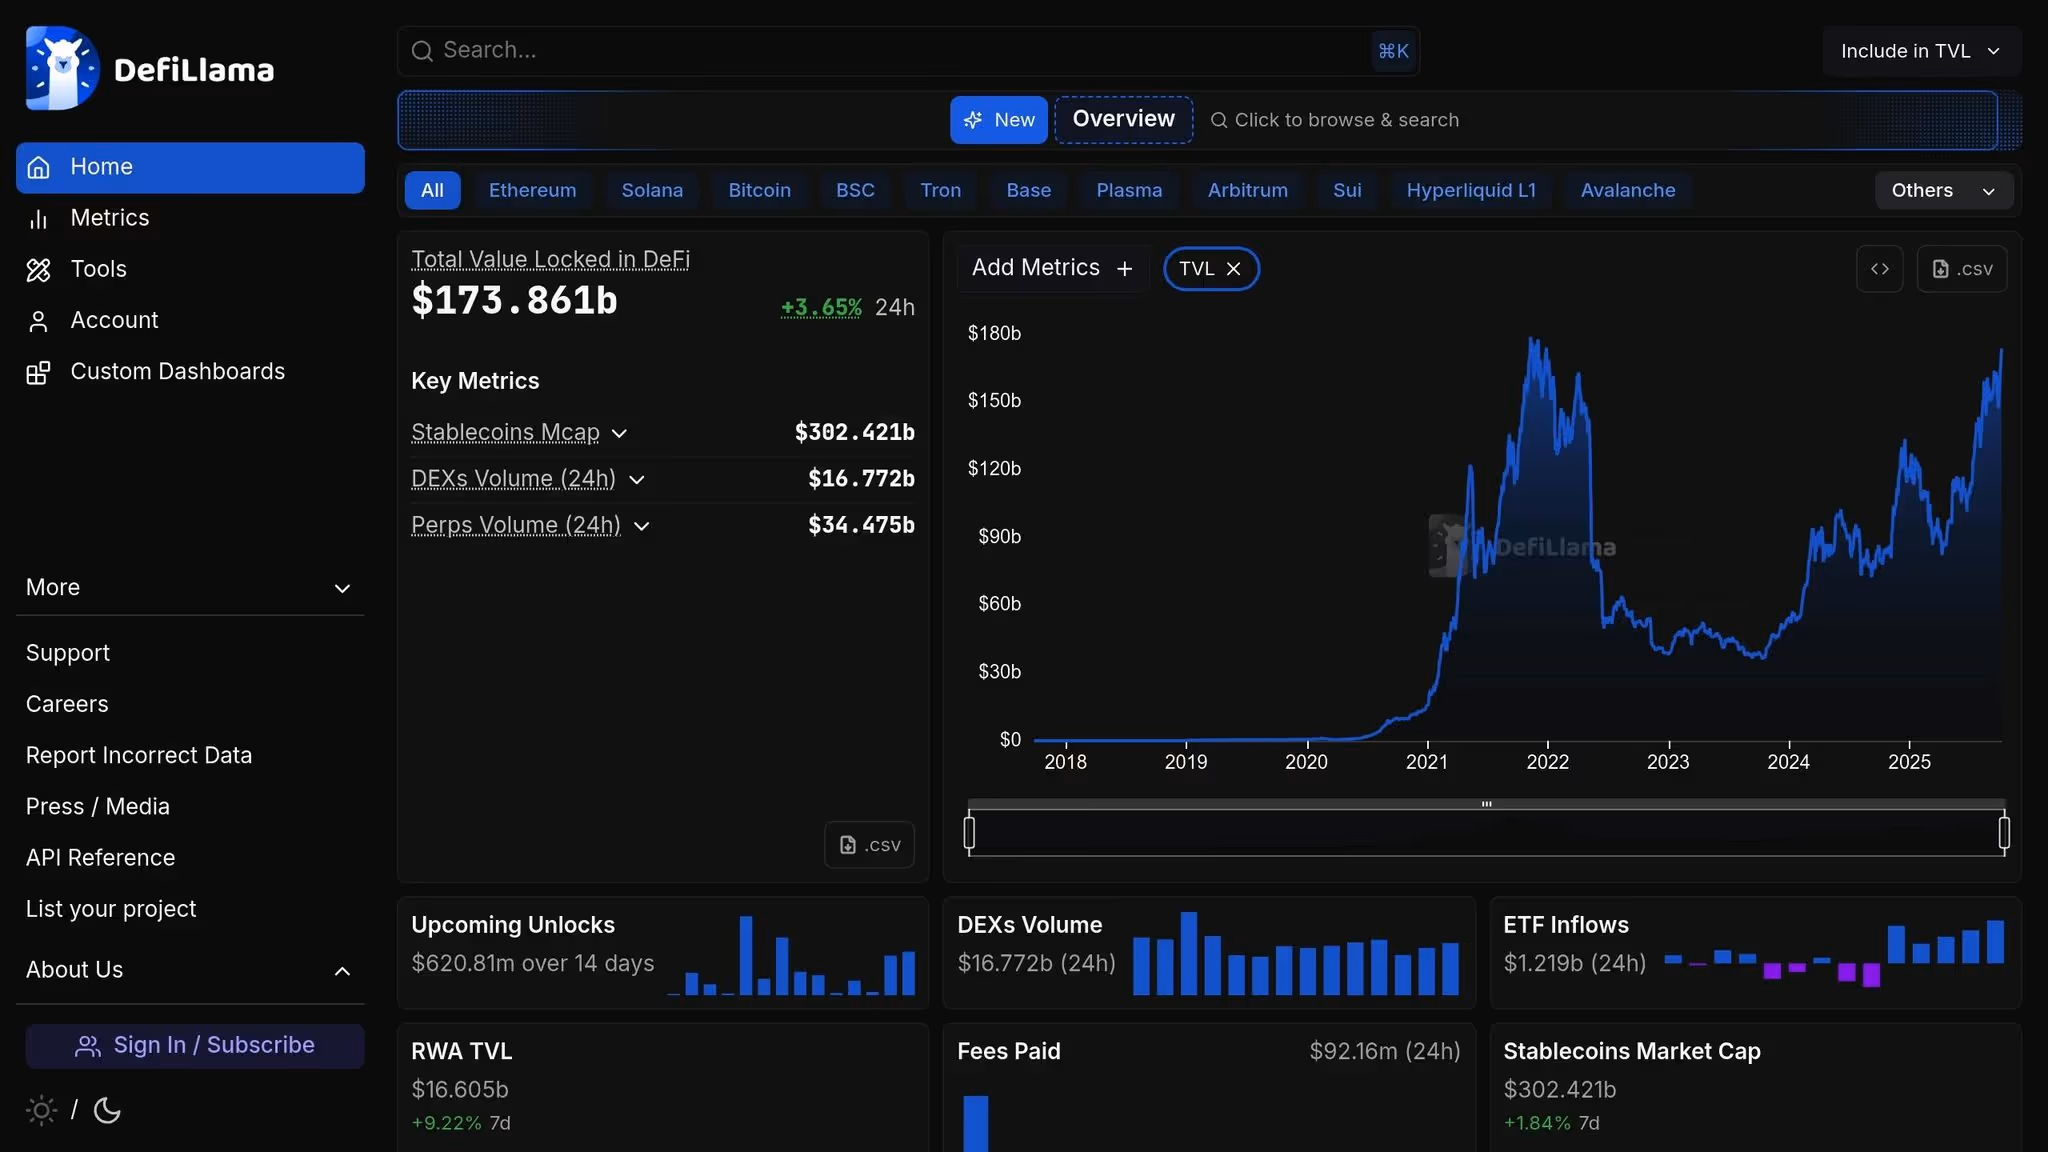
DefiLlama is a data aggregator that tracks Total Value Locked (TVL) across various DeFi protocols. While its primary focus is on TVL, the platform’s data can provide liquidity providers with a clearer picture of the overall health of different protocols. This information can be helpful when evaluating risks like impermanent loss. Keeping an eye on TVL trends can indirectly guide your approach to managing such risks.
DefiLlama covers a wide range of blockchains, giving users access to performance data across established networks like Ethereum and Polygon, as well as newer ecosystems. It tracks major decentralized exchanges and yield farming platforms, making it easier to monitor TVL trends that may signal market shifts or changes in pool stability. This broad support helps users stay informed about the performance of protocols across multiple chains.
The platform provides live TVL data that updates throughout the day. While DefiLlama doesn’t offer traditional price alerts, its real-time TVL tracking acts as a useful tool for identifying changes in pool activity. Sudden shifts in TVL can indicate evolving conditions, helping users spot unusual activity and respond quickly. These real-time updates offer a macro-level view of protocol health, complementing insights from other tools.
DefiLlama also provides historical TVL charts, which can be used to analyze trends over time. These charts are useful for identifying protocols with steady TVL growth compared to those experiencing higher volatility. Additionally, the platform allows users to export data in CSV format, making it easier to perform custom analyses or integrate the data with other tools. The ability to compare protocols over time adds another layer of insight, helping liquidity providers make more informed decisions about managing risks like impermanent loss.
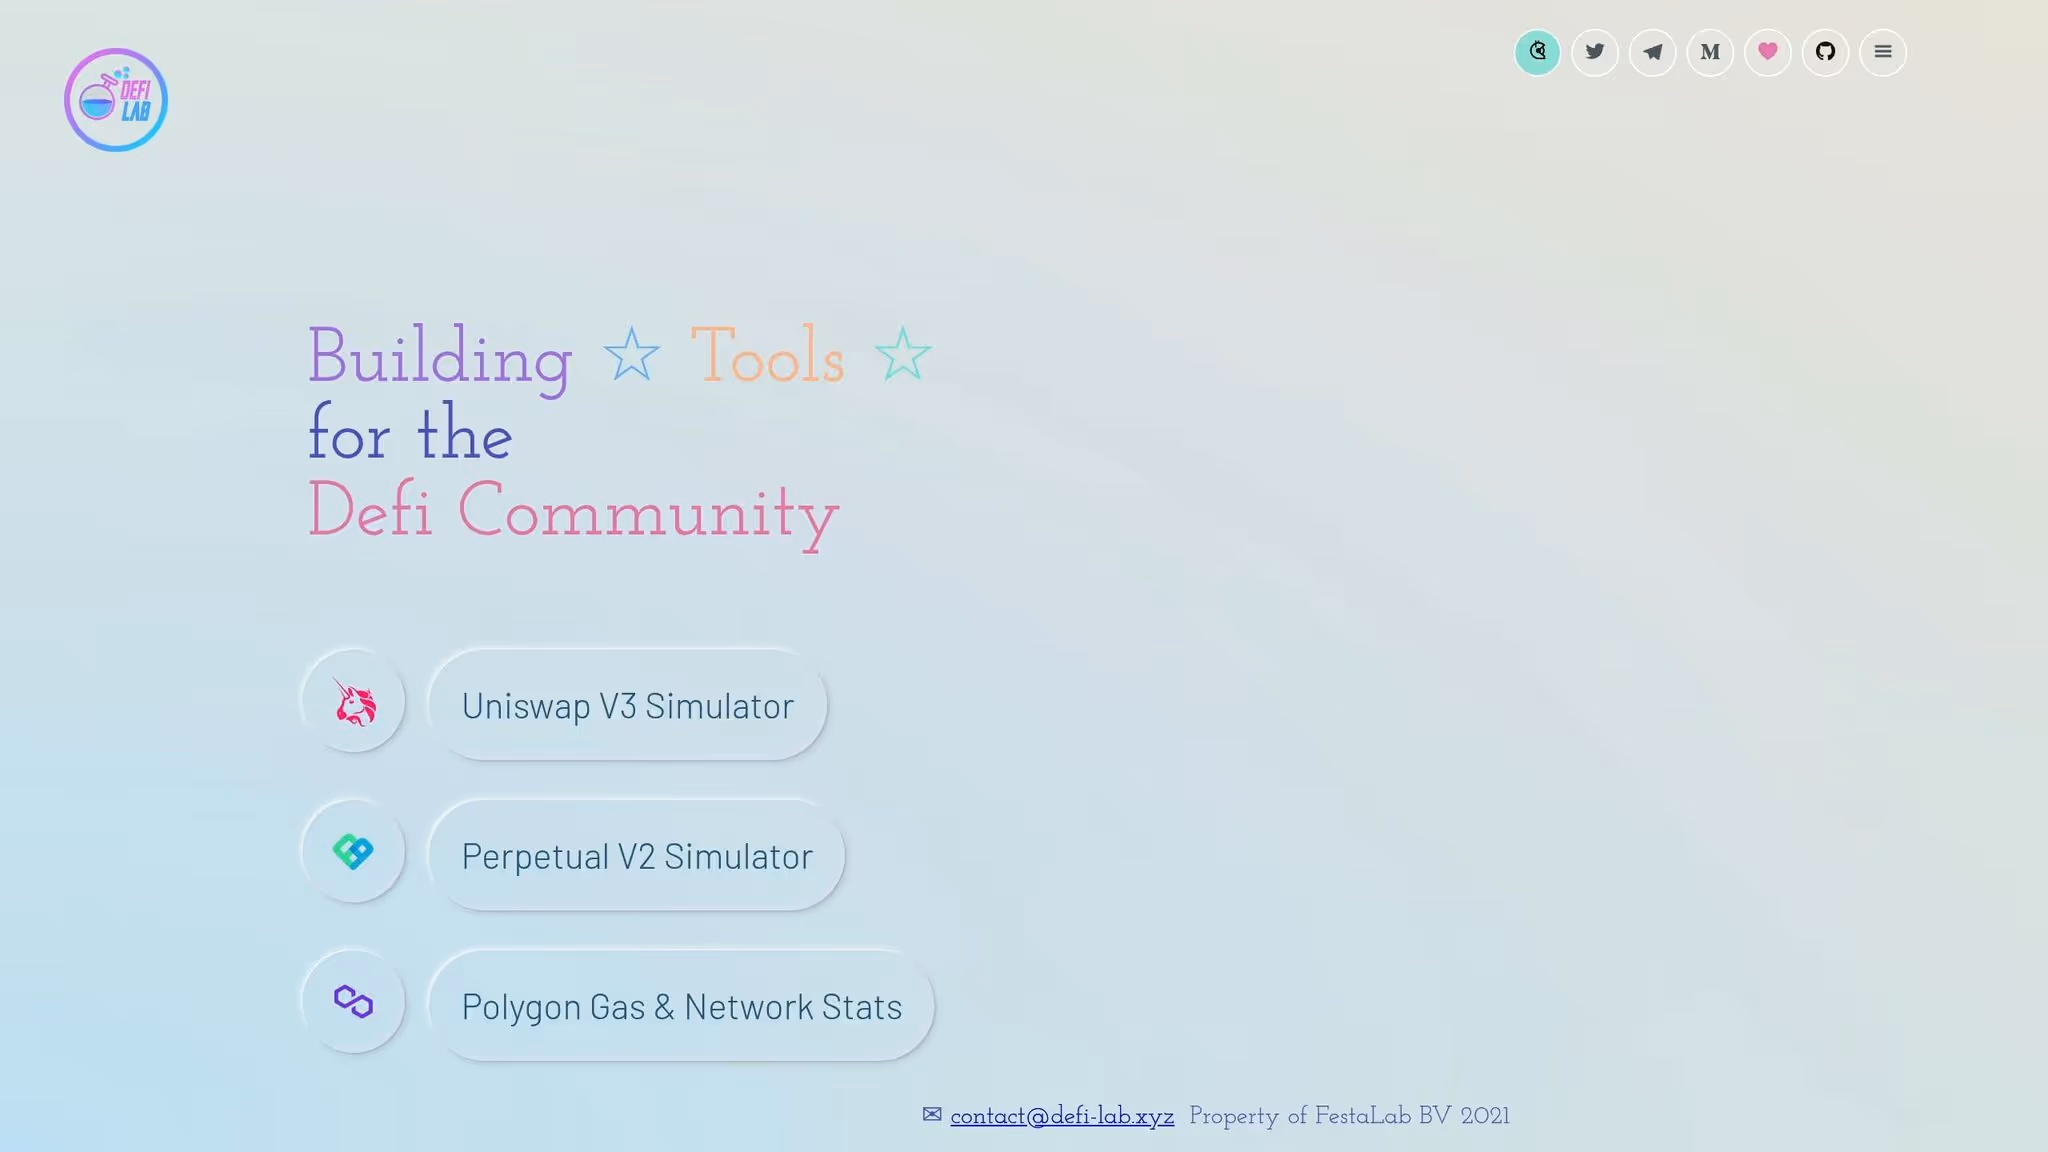
Defi-Lab is a platform designed to help DeFi liquidity providers track and analyze impermanent loss. While it offers tools like real-time tracking, historical data analysis, and wallet integration, the specifics of these features aren’t fully detailed here. For the most accurate and up-to-date information, check out the platform's official resources.

Zapper brings all your DeFi positions together in one simple dashboard. It works seamlessly with popular wallets like MetaMask, WalletConnect, Torus, Trezor, Ledger, and Fortmatic, allowing you to view and manage multiple protocols in one place. This unified setup is especially helpful for keeping track of impermanent loss across various liquidity pools.
Connecting your wallet to Zapper is quick and easy, with plenty of options for linking your preferred wallet. Once connected, Zapper automatically pulls in all your crypto assets and DeFi positions from different protocols. The dashboard organizes everything into one clear view, making it much easier to track your liquidity positions across platforms like Uniswap, SushiSwap, and other automated market makers. This eliminates the hassle of checking each protocol separately, giving you a better understanding of your overall exposure to impermanent loss.
Zapper doesn’t stop at wallet integration - it also provides strong cross-protocol monitoring. It keeps an eye on your liquidity pools and yield farming activities across leading platforms. Beyond that, it tracks lending and borrowing positions, offering a complete view of how your DeFi strategies are performing. This broad visibility helps liquidity providers identify positions that might be facing significant price changes, making it easier to address potential issues before they turn into bigger losses.
Zapper also offers customizable dashboards and alerts to help you stay on top of price changes. While the platform is great for most users, those with more advanced strategies - like borrowing to provide liquidity or using complex LP token techniques - might find the tracking tools less detailed for in-depth analysis. For these users, additional tools may be needed to dive deeper into impermanent loss trends. That said, Zapper’s historical analytics and alerts still provide valuable insights to improve your impermanent loss management.
The article covers impermanent loss monitoring tools at the portfolio level but does not address the specific mechanics and monitoring requirements of concentrated liquidity positions, which represent the dominant liquidity provision model on Uniswap V3 and its forks and introduce a fundamentally different impermanent loss profile than the full-range liquidity positions that earlier DeFi monitoring tools were designed to track. Concentrated liquidity position monitoring requires a distinct set of metrics and alert thresholds compared to full-range LP monitoring because the impermanent loss dynamics, out-of-range risk, and fee accrual behavior of concentrated positions change continuously as price moves relative to the defined tick range, creating a real-time management problem that static portfolio snapshots cannot adequately address.
In a Uniswap V2 or Curve stable pool position, impermanent loss accumulates gradually as price diverges from the entry ratio, and there is no binary state change that affects the position's behavior. In a Uniswap V3 concentrated liquidity position, the position exists in one of two states at any given moment: active within range, where it earns fees proportional to its share of active liquidity and accumulates impermanent loss at an amplified rate relative to V2, or out of range, where it earns zero fees while sitting entirely in one asset of the pair. This binary behavior means that monitoring a concentrated liquidity position requires tracking proximity to range boundaries as a continuous real-time metric rather than periodically checking portfolio performance, because the transition from in-range to out-of-range can happen within minutes during volatile market conditions and the consequences for fee income are immediate.
Price-to-range proximity is the core real-time metric for concentrated liquidity monitoring. It expresses the current price as a percentage of the distance to the nearest range boundary, which quantifies how close the position is to transitioning out of range. A position whose lower tick boundary is 8% below current price and whose upper tick boundary is 12% above current price has an asymmetric proximity profile that expresses both the directional bias of the current range and the urgency of monitoring. As proximity to either boundary falls below 5%, the risk of imminent out-of-range transition rises substantially in markets with typical hourly volatility, and monitoring frequency should increase accordingly.
Fee-to-impermanent loss ratio is the metric that determines whether a concentrated liquidity position is generating net positive returns or net negative returns at any point in time, and it is the figure that most impermanent loss monitoring tools fail to surface explicitly despite it being the most actionable single number available to an LP. The ratio compares cumulative fee income earned since position inception against cumulative impermanent loss accumulated over the same period. A ratio above 1.0 indicates that fees have exceeded impermanent loss and the position is net profitable relative to holding. A ratio below 1.0 indicates the position is currently net negative relative to holding, and the degree to which it is below 1.0 quantifies the gap that future fee accrual must close to reach break-even.
Break-even horizon calculation extends this metric by projecting how long a position will take to achieve net positive returns given its current fee accrual rate and impermanent loss trajectory. If a position has accumulated $340 in impermanent loss and is earning $45 per day in fees at current volume levels, the simple break-even horizon is approximately 7.5 days of continued in-range operation at current fee rates. This projection is inherently uncertain because both fee rates and impermanent loss can change with market conditions, but it provides a practical basis for deciding whether to maintain the position, adjust the range, or close and redeploy capital. Positions with break-even horizons exceeding 30 days at current fee rates warrant reconsideration because they indicate that the fee income is insufficient relative to the impermanent loss risk being accepted for the chosen range width and price tier.
Amplified impermanent loss sensitivity in concentrated positions scales with the inverse of the range width relative to a full-range position. A Uniswap V3 position concentrated in a range covering 20% of the full price curve experiences impermanent loss approximately 5 times faster than a V2 full-range position when price moves the same absolute percentage. Monitoring tools that apply V2 impermanent loss formulas to V3 positions systematically understate the risk, which is a meaningful accuracy failure for narrow-range positions in volatile markets. Accurate concentrated liquidity impermanent loss monitoring requires implementing the V3-specific formula that accounts for liquidity concentration and the square root price representation used in Uniswap V3 tick math.
Rebalancing trigger design for concentrated liquidity positions requires balancing three competing costs: the impermanent loss that accumulates while in range, the opportunity cost of zero fee accrual while out of range, and the transaction costs and swap slippage associated with closing and reopening a position at a new range centered on the current price. Naive rebalancing strategies that reset the range whenever price moves outside the current boundaries optimize for maximum time in range at the cost of excessive transaction fees that consume the fee income the strategy is designed to capture. Optimal rebalancing strategies set trigger conditions that account for the expected fee income from the new position, the transaction cost of rebalancing, and the price momentum that determines whether an out-of-range event is likely to be transient or persistent.
Gas-adjusted rebalancing thresholds calculate the minimum expected fee income required from a new position to justify the transaction cost of rebalancing. For a position on Ethereum mainnet where a full close-and-reopen cycle costs $40 to $120 in gas depending on network conditions, the new position must earn at least that amount in fees within its expected operating period to break even on the rebalancing cost alone, before accounting for the swap slippage incurred during position asset rebalancing. On Layer 2 networks where rebalancing costs $0.50 to $5.00 per cycle, the gas-adjusted threshold is dramatically lower and more frequent rebalancing becomes economically rational. Monitoring tools that surface the current estimated rebalancing cost alongside the expected daily fee income at the proposed new range make this calculation explicit rather than requiring the LP to estimate it separately.
Out-of-range duration tracking records the cumulative time a position has spent out of range since inception, which is the primary determinant of total opportunity cost from zero fee accrual periods. Positions that spend more than 20 to 30 percent of their operating time out of range are experiencing structural range-to-volatility misalignment, meaning the chosen range width is too narrow for the actual price volatility of the pair. The appropriate diagnostic response is widening the range to reduce out-of-range frequency at the cost of lower capital efficiency and fee concentration, or accepting the current range width and implementing a more systematic rebalancing protocol with lower trigger thresholds. Tracking out-of-range duration as a running percentage of total position age provides the empirical basis for this range-width calibration decision that no amount of prospective modeling can substitute for.
Managing impermanent loss effectively means having tools that offer precise monitoring and cost-conscious options. Here is a breakdown of key features, advantages, limitations, and pricing for each tool.
Wallet Finder.ai provides real-time wallet tracking, profitable trade discovery, Telegram alerts, data export, and personal wallet analysis. Its main advantages are identifying successful trading strategies, flexible subscription plans, and advanced filtering tools. The primary limitation is its focus on wallet-based analysis as a newer platform. Pricing runs $26 to $37 per month for Basic and $34 to $49 per month for Premium, with one-week trials available at $12 for Basic and $17 for Premium.
APY.vision covers automated IL calculations, yield farming analytics, portfolio tracking, and historical performance data. It stands out for accurate impermanent loss calculations, wide DeFi protocol coverage, and detailed analytics. The main drawbacks are complexity for beginners and premium features requiring a paid subscription. A free tier is available with premium plans at varying prices.
DefiLlama offers protocol TVL tracking, yield comparisons, cross-chain analytics, and portfolio management. Its advantages include an extensive database, free access to most features, and reliable data aggregation. The limitations are minimal personal portfolio tools and basic IL tracking. It is completely free to use.
Defi-Lab delivers advanced IL simulations, risk assessment tools, strategy backtesting, and portfolio optimization. It offers detailed modeling, research-grade analytics, and customizable parameters. The steep learning curve makes it best suited for advanced users. Pricing is subscription-based with varying rates.
Zapper provides a multi-protocol dashboard, wallet integration, cross-chain support, and position tracking. Its strengths are easy wallet connection, a unified view across protocols, and a beginner-friendly interface. It lacks detailed IL analysis for complex strategies and has limited advanced features. Basic features are free with premium tiers available.
Each tool brings something unique to the table, so it is important to weigh their features and pricing against your specific needs for managing impermanent loss.
Wallet Finder.ai stands out for offering real-time insights into profitable wallets, letting users follow successful trading strategies. For those curious about the platform, short-term trials are available at $12 for the Basic plan and $17 for Premium.
When weighing costs versus features, think about your trading volume and strategy complexity. For casual liquidity providers, DefiLlama is a great option since it’s completely free and provides solid monitoring tools. Zapper, on the other hand, offers a mix of free basic features with optional premium upgrades, making it a balanced choice for those looking for simplicity and flexibility.
Active traders may find subscription-based tools worthwhile. For instance, spending $37–$49 per month on a tool like Wallet Finder.ai can help reduce potential impermanent loss, which could save money in the long run.
The depth of analysis varies widely across these tools. Defi-Lab offers advanced, research-level modeling for seasoned users, while Zapper keeps things straightforward with an easy-to-use interface and broad protocol coverage. Meanwhile, Wallet Finder.ai takes a unique approach by focusing on wallet tracking, offering insights into timing and strategies based on successful traders' behavior. This can be particularly helpful for managing impermanent loss in a more strategic way.
The article covers monitoring tools comprehensively but does not address the instruments available for actively hedging impermanent loss exposure once it has been identified and quantified through those tools. Impermanent loss hedging is the logical next step after monitoring because identifying IL exposure without any mechanism for reducing it limits the practical value of sophisticated monitoring to informational awareness rather than actionable risk management. Several hedging approaches have become operationally accessible to individual and institutional liquidity providers over the past two years, and understanding their cost structures and effectiveness characteristics allows LPs to select the approach appropriate to their position size, holding horizon, and risk tolerance.
The theoretical foundation for impermanent loss hedging is that IL is mathematically equivalent to a short volatility position: the LP profits from fee income when prices are stable and loses relative to holding when prices are volatile. This equivalence means that instruments that provide long volatility exposure can offset IL, and the hedging problem reduces to finding long volatility instruments whose cost is less than the expected fee income from the LP position, creating a net positive expected return even after hedging costs. The practical challenge is that pure long volatility instruments in crypto markets carry option premium costs that frequently exceed the fee income from LP positions in low-fee tiers or in pairs with moderate volatility, which means hedging is economically viable only for a subset of positions and must be evaluated on a case-by-case basis rather than applied universally.
At-the-money straddle positions provide the most direct long volatility hedge for LP impermanent loss because a straddle profits from price movement in either direction and loses only when price remains near the strike price, which is the opposite payoff profile to an LP position. Purchasing a straddle with a strike near the current price of the LP pair's denominating asset offsets impermanent loss from large price moves in either direction while the straddle's maximum loss scenario (price remaining stable) corresponds to the LP position's best-case scenario of maximum fee income without significant IL. The net position of a long straddle plus an LP position creates a payoff structure with reduced variance compared to the LP position alone.
The practical implementation challenge is that at-the-money options on most crypto assets are expensive relative to realized volatility, reflecting the volatility risk premium that option sellers charge. Delta-hedged options positions reduce the cost of the straddle hedge by selling out-of-the-money options against the straddle legs, creating a defined-range volatility position rather than unlimited long volatility. A strangle sale against the straddle purchase reduces the premium cost by collecting option premium from strikes beyond the LP position's range boundaries, reasoning that impermanent loss beyond those price levels is less relevant once the LP position is already out of range and earning zero fees. This approach requires more active management but can reduce hedging cost by 30 to 50 percent compared to a naked straddle purchase while still providing meaningful IL protection within the LP operating range.
Protocol-native IL protection products have emerged from several DeFi projects specifically to address the retail LP hedging market. Bancor V3 introduced single-sided liquidity provision with protocol-funded IL protection as a core product feature, though the protocol suspended IL protection in June 2022 during the bear market when the protection mechanism became underfunded relative to claims. Bumper Finance has developed a hybrid derivative product positioned specifically as LP IL insurance. The track record of protocol-native IL protection products during severe market stress in 2022 revealed that insurance products that rely on protocol token emissions to fund protection payouts face solvency risk during precisely the market conditions when IL is highest and claims most frequent, which is the adverse selection problem that makes this product category structurally challenging to design sustainably.
Perpetual futures basis positions provide an alternative hedging approach that does not require options infrastructure and is accessible on most major centralized exchanges. Since impermanent loss from price appreciation in one asset of a pair is mathematically equivalent to being short that asset's outperformance relative to its pair counterpart, a short perpetual futures position on the outperforming asset can offset the IL from holding the pair in the LP position. For an ETH/USDC concentrated liquidity position, a short ETH perpetual position sized proportionally to the ETH notional exposure in the LP position hedges against ETH price appreciation that would otherwise generate impermanent loss by rebalancing the LP toward USDC.
The sizing of perpetual hedges requires accounting for the dynamic gamma exposure of a concentrated liquidity position. Unlike a fixed spot position where the notional to hedge is constant, the effective ETH exposure in a V3 LP position changes continuously as price moves within the range because the pool's internal rebalancing mechanism adjusts the proportion of ETH versus USDC held at each price point. A static perpetual short sized at entry will underhedge when price rises within range (as the LP acquires more ETH exposure) and overhedge when price falls within range. Dynamic hedge rebalancing that adjusts the short position size in response to price movements within the range maintains hedging accuracy at the cost of additional rebalancing transactions, with rebalancing frequency determined by the same gas-adjusted threshold analysis that governs LP position rebalancing decisions.
Funding rate cost assessment is the critical economic viability check for perpetual futures hedging strategies. Perpetual futures carry a funding rate paid from long to short (or short to long depending on market conditions) that represents the ongoing cost of maintaining the hedge. In bull market conditions where ETH perpetuals trade at persistent positive funding, short ETH perpetual hedges generate funding income that partially offsets hedging costs and may actually improve the overall position economics. In bear market conditions or during risk-off episodes, funding may flip to negative, increasing the cost of maintaining short hedges. Monitoring the daily funding rate cost against the daily fee income from the LP position provides the real-time economic viability signal for continuing the hedging strategy versus closing the hedge and accepting unhedged IL risk when hedging costs exceed fee income margins.
The integration of impermanent loss monitoring data from tools like those covered in this article with hedging instrument selection and sizing creates a complete risk management workflow that converts impermanent loss from an unavoidable DeFi tax into a manageable and partially controllable risk factor. Platforms that surface real-time IL accumulation, fee-to-IL ratios, and position range proximity provide the inputs needed to make hedging decisions with quantified context rather than estimates.
Reducing impermanent loss starts with choosing tools that match your trading habits and comfort with risk. This thoughtful approach ties back to the ideas shared earlier.
Keeping an eye on dashboards regularly can help you catch opportunities and make better decisions about when to enter or exit positions using up-to-date data.
Always weigh impermanent loss against liquidity rewards to get a clear picture of your actual earnings potential. This kind of careful evaluation helps you figure out if the rewards from providing liquidity outweigh any potential losses.
Picking the right liquidity pools becomes easier when you use detailed analytics. Look for pools with less volatile asset pairs or ones with higher transaction fees - both of which can help reduce impermanent loss and boost your returns. Advanced tools like whale asset tracking can also help you fine-tune your strategy to balance risk and reward. These methods work well with the monitoring tools discussed earlier.
If you’re in the U.S., think about balancing costs and features when managing risk. Free platforms like DefiLlama are great for basic monitoring, while paid tools like Wallet Finder.ai offer unique insights, such as tracking successful trading strategies through wallet analysis.
Taking advantage of educational materials and connecting with Web3 communities can provide extra knowledge that complements the data from your monitoring tools. As DeFi continues to evolve, staying informed through multiple sources can give you an edge in managing impermanent loss.
The tools and tips shared here give you a solid starting point for smarter DeFi decisions. Your success will depend on how consistently you monitor, analyze, and adjust your strategies based on market trends and your own risk preferences. Use these insights to improve your liquidity positions and keep impermanent loss in check.
When you deposit assets into a DeFi liquidity pool, impermanent loss occurs if the value of those assets changes compared to just holding them in your wallet. This happens because of price shifts between the paired tokens in the pool.
Keeping an eye on impermanent loss is important since it can affect how much profit you make. For liquidity providers - especially in markets with lots of price swings - understanding this risk is key. It can help safeguard your earnings and guide smarter choices about joining DeFi pools.
Tools like APY.vision and DefiLlama make it easier to track and manage impermanent loss by breaking down the performance of liquidity pools. They provide essential metrics like historical returns, impermanent loss estimates, and detailed profit-and-loss summaries. This helps users grasp the financial outcomes of their investments.
These platforms also let users compare potential earnings across different DeFi pools, spot trends, and make smarter, data-backed decisions to minimize risks. With their clear and straightforward analytics, investors can fine-tune their strategies and manage their liquidity positions more effectively.
When choosing a tool to keep an eye on impermanent loss in your DeFi investments, focus on features like real-time analytics, tools for assessing risk, and detailed tracking of your positions. These functions are key to making smarter decisions and minimizing potential losses.
It’s also helpful to pick tools that provide easy-to-understand visualizations of your portfolio and alerts you can customize to stay on top of market movements. These features are crucial for handling the ups and downs of DeFi markets and managing impermanent loss more effectively.
Concentrated liquidity positions require fundamentally different monitoring than full-range V2 positions because they introduce a binary in-range or out-of-range state that causes immediate cessation of fee accrual when price exits the defined tick boundaries, unlike V2 positions that earn fees continuously regardless of price movement. The most critical real-time monitoring metric is price-to-range proximity, which expresses the current price as a percentage of the distance to the nearest tick boundary and quantifies how urgently the position requires attention. When proximity to either boundary falls below 5 percent of the position's range width, the risk of imminent out-of-range transition is high enough in normally volatile markets to warrant immediate evaluation of rebalancing options.
Amplified impermanent loss sensitivity in V3 positions scales with the inverse of range width: a position concentrated in a range covering 20 percent of the full price curve accumulates impermanent loss approximately 5 times faster than an equivalent V2 full-range position for the same price movement. Monitoring tools that apply V2 IL formulas to V3 positions systematically understate risk for narrow-range deployments. Fee-to-impermanent loss ratio is the single most actionable metric, comparing cumulative fee income against cumulative IL to determine whether the position is net positive relative to holding. Extending this to a break-even horizon calculation — dividing the current IL deficit by the current daily fee accrual rate — provides a practical time estimate for evaluating whether to maintain, adjust, or close the position. Positions with break-even horizons exceeding 30 days at current fee rates and volume indicate structural range-to-volatility misalignment that widening the range or closing the position is better suited to address than continued monitoring alone.
Three categories of hedging instruments are operationally accessible for LP impermanent loss hedging, each with distinct cost structures and implementation complexity. At-the-money straddle options provide the most direct long volatility hedge, profiting from price movement in either direction and directly offsetting the IL payoff profile. The primary limitation is option premium cost: in crypto markets, ATM options frequently carry premiums equivalent to 8 to 15 percent of notional per month, which exceeds the fee income of most LP positions in 0.05 percent or 0.30 percent fee tiers at moderate volume. Delta-hedged defined-range options positions reduce this cost by 30 to 50 percent through selling out-of-the-money strikes against the core hedge, but require active management and options market access that many individual LPs lack.
Perpetual futures basis hedging is the most accessible approach for individual LPs, requiring only a centralized exchange account. A short perpetual position on the appreciating asset offsets IL from price divergence, with sizing calculated from the notional asset exposure in the LP position. The critical economic viability check is daily funding rate cost compared against daily LP fee income: when funding costs on the short perpetual position exceed the fee income margin, hedging costs destroy the profitability of the combined position and the hedge should be reduced or closed. Dynamic rebalancing of the perpetual position size as price moves within the LP range maintains hedging accuracy for concentrated positions but introduces additional transaction costs requiring gas-adjusted threshold analysis equivalent to LP rebalancing decisions. Protocol-native IL protection products have shown structural solvency vulnerabilities during high-IL stress periods, making their long-term reliability lower than exchange-based instruments for serious risk management purposes.

A premier DeFi analytics platform empowering traders to discover and analyze profitable blockchain wallets, trades and tokens.

