
Recovery Factor Calculation for Smart Traders
Master the recovery factor calculation to measure a strategy's resilience. Learn the formula, see DeFi examples, and find top wallets with Wallet Finder.ai.

June 20, 2026


Wallet Finder
February 16, 2026
Crypto funding rates are periodic payments between traders in perpetual futures markets. Their purpose is to keep the contract's price anchored to the asset's spot price.
Think of it as the invisible force ensuring a derivative—which never expires—faithfully tracks the real-time value of the crypto it represents. It's the balancing act that keeps the entire system in equilibrium.
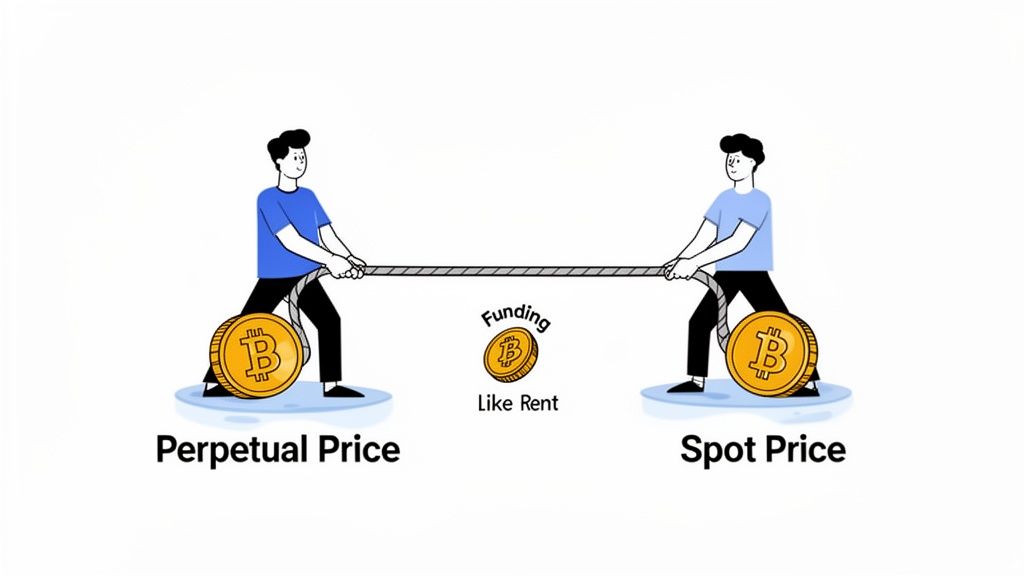
Picture a tug-of-war. On one end is the price of a Bitcoin perpetual futures contract. On the other is the spot price of Bitcoin. The goal is to keep the rope centered. Funding rates are the constant, tiny adjustments—the gentle tugs—that stop one side from overpowering the other.
This balancing act happens through small payments exchanged directly between traders, not fees paid to the exchange. It's a peer-to-peer settlement. A simple way to think about it is paying a little 'rent' to hold a position that's more popular than the other side of the trade.
The direction of payments depends entirely on market demand. The system is designed to incentivize traders to take the less popular side of a trade, which naturally nudges the contract price back toward the spot price.
It boils down to two scenarios:
The core function of funding rates is to create equilibrium. By making it more expensive to hold the majority's position, the market discourages overcrowding and maintains the crucial price peg between the derivative and its underlying asset.
For any serious trader, funding rates are more than a cost; they're a powerful, real-time gauge of market sentiment, revealing where collective leverage is building up.
For instance, a consistently high positive rate shows the market is overwhelmingly long. This creates the perfect conditions for a "long squeeze" if the price suddenly reverses, forcing leveraged longs to liquidate.
These rates are a direct reflection of trader positioning, with costs varying across exchanges based on liquidity and volatility. To compare rates, a good resource is CoinMarketCap's funding rate data.
Understanding this dynamic is the first step toward building sophisticated trading strategies. By monitoring funding, you get a clearer picture of market psychology, helping you sidestep crowded trades and spot potential reversals.
Every perpetual futures exchange settles funding payments at fixed 8-hour intervals — typically 00:00, 08:00, and 16:00 UTC on Binance, Bybit, and OKX. These predictable timestamps create systematic price manipulation opportunities that sophisticated traders exploit at retail's expense. If you don't know this is happening, you're the one getting taken.
The mechanics are straightforward: in the 15-30 minutes before a settlement window, traders holding losing funding positions have strong incentives to close them to avoid paying. A trader sitting on a large long in a high positive funding environment is about to pay fees. The rational move is closing just before settlement — and when thousands of traders act simultaneously, predictable price pressure follows.
When positive funding is high (longs paying shorts), expect downward pressure in the 15-30 minutes before each 8-hour settlement. Long holders closing to avoid payment creates sell pressure. When funding is deeply negative (shorts paying longs), expect upward pressure before settlement as shorts rush to close. These pre-settlement squeezes can move prices 1-3% in liquid markets and 5-10% in less liquid altcoins.
The key factors that determine how strong the pre-settlement move will be:
Large players don't just respond to the funding cliff — they create it. A whale holding a massive short into high positive funding can absorb the payment as a cost, add to the short in the pre-settlement window when long liquidations are imminent, then trigger cascading liquidations by moving price slightly below key support during peak settlement pressure. The funding payment they absorbed as "cost" is more than offset by the larger short they ran into the engineered cascade.
This is why abnormally high funding rates rarely persist — whales with capital absorb those costs as setup fees for manufacturing liquidation events.
Never initiate new long positions in the 30 minutes before settlement during high positive funding environments. You're entering at peak manipulation risk — the exact window when sophisticated money engineers downward pressure.
The period immediately after settlement often sees relief rallies as sell pressure evaporates. Short-term price pops of 0.5-1.5% in the first 15 minutes post-settlement are common in high-funding environments. Track settlement times using Coinglass's countdown timers, and set alerts for the 15-minute pre-settlement window when funding exceeds 0.05%.
To understand what crypto funding rates are telling you, you need to look under the hood. The calculation is a specific formula designed to keep the perpetual futures market tethered to reality. It all boils down to two key parts: the Interest Rate and the Premium.
The funding rate is simply these two components added together. While exchanges might have slight tweaks in their formulas, this fundamental structure is universal.
The first piece is the Interest Rate. Think of this as the basic cost of keeping your position open. In a swap like BTC/USDT, you’re dealing with two currencies. This component reflects the difference in borrowing costs between them.
For example, the formula looks at whether it costs more to borrow USDT or BTC. Exchanges typically set a fixed daily interest rate to account for this. A common rate is 0.03% per day, which works out to 0.01% for each 8-hour funding window. This part of the calculation is usually stable and predictable.
The second, more dynamic component is the Premium. This is where market sentiment comes into play. The premium is the gap between the perpetual contract's price and the asset's spot price. Funding rates exist to close this gap.
The gap's size depends on buying and selling pressure in the perpetuals market:
This component makes funding rates a powerful real-time indicator of what traders are thinking.
A volatile premium is the market's way of shouting its intentions. When the premium spikes, it shows a rush of demand for leverage on one side of the trade, forcing the funding rate to adjust and restore balance.
To make this crystal clear, here’s a breakdown of the components.
ComponentWhat It MeasuresHow It Influences the RateInterest RateThe cost difference of borrowing the base and quote currencies.Provides a stable, baseline cost for holding a position.PremiumThe price gap between the perpetual contract and the spot market.Creates dynamic shifts based on bullish or bearish market sentiment.
By combining the steady Interest Rate with the ever-changing Premium, the final funding rate provides a complete picture of both the fundamental cost of capital and immediate, sentiment-driven market pressures.
Funding rates are one of the purest, real-time gauges of market psychology available. They’re more than a fee; they’re a live reading of the collective greed and fear driving the derivatives market. Learning to read them is like learning to read the room—it gives you a massive edge.
This real-time feedback comes from the two parts of the funding rate: a stable interest rate and a volatile premium. The premium directly reflects the tug-of-war between buyers and sellers fighting for leverage.
This graphic breaks down the simple but powerful calculation.
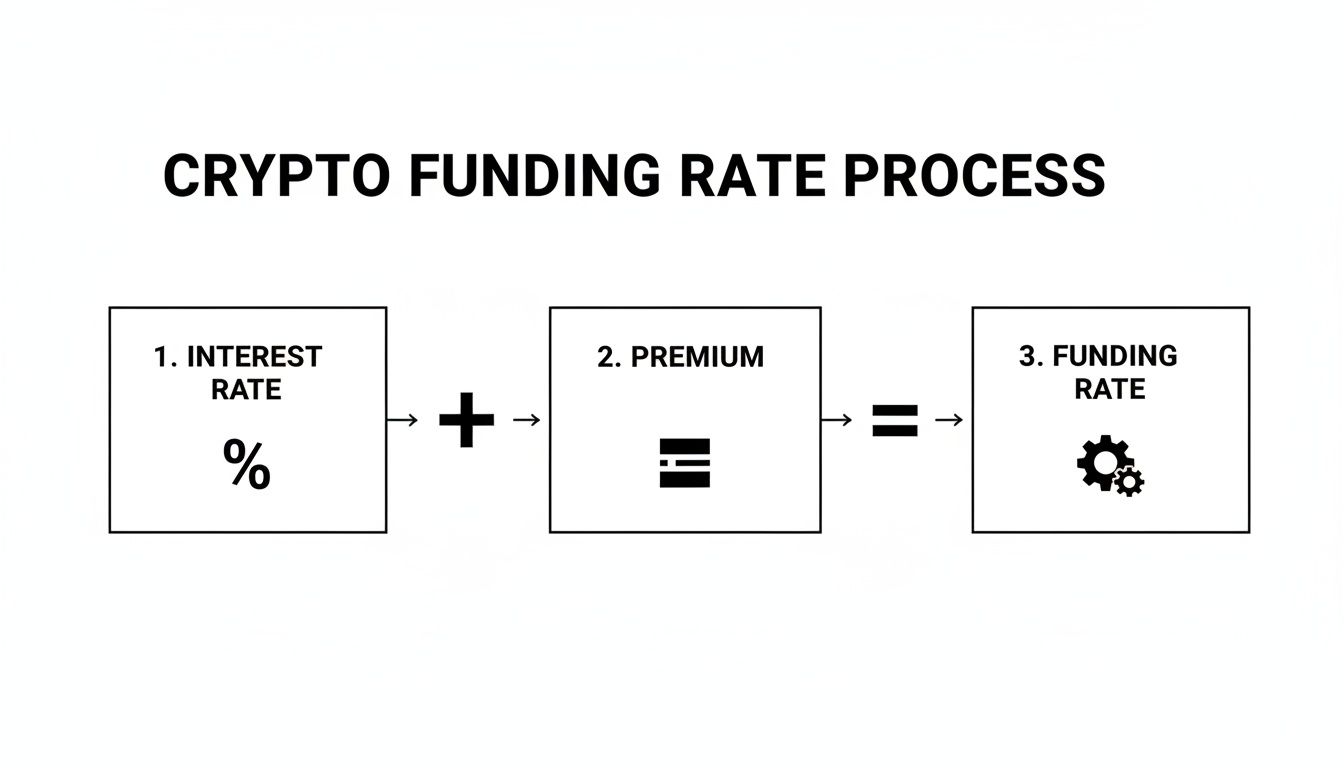
The steady interest rate provides a baseline, but it's the premium—driven by raw market sentiment—that really tells the story.
When the market is euphoric, traders pile into long positions. This buying frenzy pushes the perpetual contract price above the spot price, creating a positive premium and a positive funding rate. In this environment, longs pay shorts to keep their positions open.
Consistently high positive funding rates are a red flag. It means the market is top-heavy with bullish leverage, creating a fragile situation. This is the perfect setup for a "long squeeze," where a small price dip can trigger a domino effect of forced liquidations, causing a sharp crash.
When fear takes over, traders rush to short the market. This selling pressure pushes the perpetual contract's price below the spot price, resulting in a negative funding rate. Now, shorts have to pay longs.
Deeply negative rates are a powerful sign of widespread panic. As grim as it sounds, this is often the fuel a massive rally needs. This is where you get a "short squeeze," where a small move up forces shorts to buy back their positions, triggering an explosive chain reaction that sends prices soaring. Historically, major market bottoms have occurred during times of extreme negative funding.
Funding rates act as a contrarian's best friend. Extreme greed (high positive rates) often signals a local top, while extreme fear (deep negative rates) frequently points to a local bottom.
The article correctly identifies deeply negative funding as a potential reversal signal. But this creates a dangerous trap: retail traders treat negative funding as a reliable "buy the bottom" signal and get slowly bled dry when bear markets sustain negative funding for months. The signal isn't wrong — it's the timing assumption that kills you.
The 2022 bear market is the defining example. BTC funding rates on major exchanges averaged -0.01% to -0.03% per 8 hours from May through November — roughly -14% to -43% annualized drag on long positions. Traders who read "deeply negative = capitulation" in May 2022 and went long collected small funding payments while watching BTC fall from $28,000 to $15,500 — a -45% price loss that no funding collection could offset. The fee drag on top of price losses turned a painful trade into a catastrophic one.
Negative funding persists when short demand structurally exceeds long demand — not just during panic, but as a sustained feature of a downtrend. Three conditions sustain it:
Negative funding alone cannot tell you whether you're at maximum fear or midway through a sustained downtrend. Layer these additional conditions to separate genuine capitulation from a bear market trap:
Never act on negative funding alone. Treat it as a necessary but insufficient condition for a reversal. And if funding stays more negative than -0.05% per 8 hours for more than 7 consecutive days, that level signals structural bearishness — the trend is your enemy, not a contrarian opportunity.
Funding rate analysis is powerful, but it becomes a superpower when paired with other data, like insights from the blockchain. Learning to interpret crypto on-chain data provides a complete picture.
Imagine seeing high positive funding rates (greed). If you then see on-chain data showing a huge flow of coins to exchanges from long-term holders, the alarm bells should ring. This suggests smart money is preparing to sell into retail-driven hype. The combination of signals is far more reliable than either one alone.
Here’s how you can layer these two data sources for smarter trades:
By cross-referencing derivatives sentiment with actual on-chain behavior, you can make far more confident decisions and identify high-conviction opportunities.

Understanding crypto funding rates is one thing; turning that knowledge into profitable trades is another. By spotting specific patterns, you can build clear, rules-based strategies that give you an edge.
Let's break down three powerful, actionable strategies you can use today.
Often called a "carry trade," this strategy is market-neutral. You aren’t betting on price direction; you’re simply aiming to profit from the funding payments. It's a popular way to generate a relatively steady income from the derivatives market.
The idea is simple: find a perpetual contract with a high positive funding rate, short it, and then buy the same amount of the underlying asset on the spot market. This creates a hedged position. Now you collect funding payments from over-leveraged longs, while your spot holding protects you if the price rises.
Execution Checklist
This strategy thrives on market greed. When bullish hype pushes funding rates to extreme levels, arbitrage traders provide liquidity and collect a premium for taking the less popular side of the trade.
Risk Management for ArbitrageYour biggest risk isn't a price crash—it's basis risk. This is the danger that the gap between the perpetual and spot price changes against you, potentially wiping out your funding profits. Always monitor the price difference between the two markets.
The carry trade described above is a real strategy — but it has a built-in self-destruction mechanism. As more arbitrageurs enter the same position (shorting perp, buying spot), their collective short pressure on the perpetual contract directly compresses the funding rate they're trying to collect. The trade eats itself.
The decay is fast on watched assets. If a BTC perpetual shows 0.10% funding per 8 hours (~109% annualized carry), each new arbitrageur entering pushes that rate lower. As the trade crowds, the rate compresses to 0.03%, then to the 0.01% baseline where zero risk premium remains. By that point, the opportunity has eliminated itself.
The typical decay timeline on major assets:
For smaller altcoins, decay takes longer — sometimes days. But the illiquidity slowing decay also increases basis risk, as spot and perp prices can diverge more violently.
Even a perfectly hedged arbitrage can produce large losses through basis risk — the risk that spot and perpetual prices diverge against your position before they converge. Here's the specific scenario that wipes out arbitrageurs:
You short BTC perpetual at $95,000 and buy BTC spot at $94,800 (normal $200 premium). Unexpected bullish news hits. Perpetual spikes to $98,000 on leverage-driven demand while spot moves to $97,000. The basis widens from $200 to $1,000. Your position shows a +$2,200 gain on spot and a -$3,000 loss on the short — a net -$800 loss despite being "hedged". If that mark-to-market loss approaches your margin threshold, you face forced liquidation at the worst moment, right before the basis would have collapsed back to normal.
Running the trade sustainably means:
This strategy is for traders who hunt for major market tops and bottoms. The premise is that extreme market sentiment, reflected in funding rates, often precedes a sharp reversal.
When rates are extremely high and positive, it’s a sign of extreme greed and a potential market top. When rates are deeply negative, it signals widespread fear and a potential market bottom.
Entry and Exit Signals
Before executing a contrarian play, it's crucial to see how it would have performed historically. You can learn more about how to backtest trading strategies to validate your approach.
Sometimes, the most valuable signal simply tells you to stay in a winning trade. That’s where funding rates become a powerful tool for trend confirmation.
A healthy, sustainable uptrend is usually marked by neutral or slightly positive funding rates. This indicates that while there’s bullish interest, the market isn't dangerously over-leveraged. Similarly, a strong downtrend often has slightly negative funding rates, showing persistent but not panicked bearish sentiment.
How to Use Funding for Confirmation
It’s tempting to view funding rates as a crystal ball, but relying on them without understanding their limits is a recipe for disaster. These numbers reflect past and present sentiment, not a guaranteed future outcome.
Treating funding rates as a standalone, predictive tool is one of the most common and costly mistakes. A nuanced approach, blending their signals with a broader market view, is essential.
Here’s the most important takeaway: funding rates are a lagging, not a leading, indicator. They tell you how the market is positioned now, reflecting the collective sentiment that has already built up.
A market can stay "overheated" with high positive funding rates for a surprisingly long time during a powerful uptrend. Shorting too early based on a high rate alone can lead to significant losses.
Never assume a high funding rate guarantees an immediate price correction. It only signals that the conditions for a reversal are in place, but it doesn't tell you when or if that reversal will happen.
This is why context is everything. Combine funding rate data with technical analysis, order book flow, and on-chain metrics to build a complete picture.
While extreme funding rates get all the attention, neutral rates are just as revealing. A rate hovering around the 0.01% baseline can mean several things:
Dismissing a neutral rate as "boring" is a mistake. You might miss a quiet accumulation phase or fail to recognize the stability in an ongoing trend.
No market indicator lives in a bubble. Major economic news, regulatory shifts, or changes in global risk appetite can override any signal from funding rates.
For instance, a deeply negative funding rate might scream "short squeeze," but if it happens during a global market crash, that bullish reversal probably isn't coming. Macro fear will almost always overpower localized sentiment in the derivatives market.
Use this simple checklist to ensure you're using funding rates as a tool, not a trap.
DoDon't✅ Use rates as a confirmation tool alongside other analyses.❌ Rely on funding rates as a standalone signal for entries or exits.✅ Look for extremes as a sign of a crowded trade.❌ Assume a high rate means an immediate top or a low rate means a guaranteed bottom.✅ Pay attention to neutral rates to gauge trend health.❌ Ignore the broader market context and macroeconomic news.✅ Understand an asset's typical funding rate behavior.❌ Chase high yields in arbitrage trades without managing basis risk.
To use funding rates effectively, you need solid, real-time data. The right tool can turn complex market sentiment into a clear, actionable signal.
Dedicated platforms are essential for monitoring and analysis, allowing you to spot arbitrage opportunities, see crowded trades, and get a feel for the market without hopping between ten different browser tabs.
For a bird’s-eye view, data aggregators are indispensable. Two platforms dominate this space:
Here’s a look at the Coinglass dashboard. Green indicates positive rates (longs pay shorts), while red means the opposite.
From a quick glance, a trader can immediately identify assets with extreme funding rates, flagging potential contrarian plays or arbitrage chances.
While aggregators are great for market-wide analysis, don't overlook the tools built into the exchanges themselves. Major platforms like Binance and Bybit display funding rate data directly on their trading interfaces.
The main advantage here is convenience and pinpoint accuracy for that specific platform. When executing a trade, you want the exact funding rate for the venue you're using.
For developers, most exchanges also provide this data through public endpoints. To pull this info programmatically, you'll need to learn more about finding the right API for crypto prices and funding data.
Choosing the right tool depends on your goal. This table breaks down the best options available.
Tool/PlatformKey FeaturesBest ForCostCoinglassHistorical data, liquidation maps, open interest chartsAll-around market analysis and spotting arbitrage.Free, with a paid tier for advanced features.Velo DataClean UI, excellent data visualization, asset-specific trendsTraders who prioritize visual analysis and sentiment tracking.FreeExchange DashboardsReal-time data, direct integration with trading interfaceTraders who need the most accurate, platform-specific data.Free
Ultimately, a combination of these tools often works best. Use an aggregator like Coinglass to find opportunities, then switch to your exchange's native dashboard to execute with precision.
Here are quick, clear answers to the most common questions traders ask about crypto funding rates.
Funding rates are constantly recalculated to keep the perpetual contract price anchored to the spot price. On most major exchanges like Binance, Bybit, and OKX, this happens every 8 hours.
However, this isn't a universal rule. During extreme volatility, some platforms might increase the frequency to as often as once per hour. When the funding time hits, payments are settled directly between traders.
Yes, absolutely. A funding rate arbitrage trade is designed to be market-neutral, but it is not risk-free. The biggest risk is basis risk.
Basis risk occurs when the gap between the perpetual contract price and the spot price widens against your position. Losses from this price move can easily wipe out any profits you've made from collecting funding payments. This is why these trades require active monitoring.
Not always. While sky-high positive rates often indicate an over-leveraged market ripe for a correction, a powerful bull run can sustain high rates for a long time.
It's better to view a high rate as a yellow warning light, not a red stop sign. It signals that conditions for a long squeeze are building, but it doesn't tell you when it will happen. Smart traders use funding rates as a confirmation tool alongside other analysis, never in isolation.
It's normal for funding rates to vary across exchanges for the same asset. This is typically due to:
Yes. In the 15-30 minutes before each 8-hour settlement (typically 00:00, 08:00, 16:00 UTC on major exchanges), expect directional pressure opposite to the dominant funding side. High positive funding creates downward pre-settlement pressure as longs close to avoid fees. Deeply negative funding creates upward pressure as shorts close.
The effect amplifies with funding rate magnitude, open interest size, and asset illiquidity. Altcoins with high OI can move 5-10% in these windows while BTC rarely moves more than 1-2%. Avoid initiating new positions in the 30 minutes before settlement during extreme funding. Consider entering 5-10 minutes after settlement when pressure releases and relief moves often follow.
Funding can stay deeply negative for months in sustained bear markets. The 2022 bear market saw negative funding from May through November — nearly six consecutive months. Traders who bought based on "deeply negative = imminent short squeeze" collected small payments while suffering -45% price losses as BTC fell from $28,000 to $15,500.
Negative funding is not a reliable standalone buy signal. It becomes high-conviction only when combined with falling open interest (short sellers also exiting), rising spot volume on green candles (organic demand appearing), and on-chain whale accumulation. Negative funding in isolation with declining volume means the downtrend is likely continuing.
Funding rate measures sentiment — which side is paying to hold, and how much. It's a crowding and conviction indicator. Open interest measures total capital committed to futures. Rising OI signals new money entering; falling OI signals positions closing.
The most powerful signals come from divergence between the two: high positive funding + falling OI means longs are exiting while still appearing bullish — the highest-conviction top signal. Deeply negative funding + falling OI means shorts are covering — the highest-probability bottom signal. When funding and OI move in the same direction, the current trend has confirmation. When they diverge, the trend is running out of fuel.
Ready to stop guessing and start tracking what the smartest traders are doing? Wallet Finder.ai gives you the on-chain intelligence to discover top-performing wallets and mirror their strategies in real time. Find your edge and act on market-moving signals before anyone else by visiting https://www.walletfinder.ai today.

A premier DeFi analytics platform empowering traders to discover and analyze profitable blockchain wallets, trades and tokens.

