
Recovery Factor Calculation for Smart Traders
Master the recovery factor calculation to measure a strategy's resilience. Learn the formula, see DeFi examples, and find top wallets with Wallet Finder.ai.

June 20, 2026


Wallet Finder
March 12, 2026

Picture every single financial transaction happening out in the open, recorded on a massive, public digital ledger for anyone to inspect. That’s the entire idea behind crypto on-chain analysis. It’s a method for digging into the permanent, public data trail left on a blockchain to gain a trading edge.
This is a world away from traditional finance. With crypto, the blockchain gives us an unfiltered, front-row seat to the activities that actually move markets, allowing you to see what the smartest investors are doing in real-time.
On-chain analysis is the practice of extracting insights from a blockchain's transactional data. Instead of relying on price charts alone, you analyze the fundamental health and activity of the network itself.
Don't think of the blockchain as some complex string of code. Imagine it as a transparent, digital city where every transaction is a vehicle moving from one building (a wallet) to another. All this traffic is visible to everyone, all the time.
While technical analysis focuses on price patterns, on-chain analysis looks at the root causes driving those patterns. It's the difference between listening to city gossip versus having access to real-time traffic data, satellite imagery, and architectural blueprints. You see the raw, undeniable facts about where the money is actually flowing.
The real magic of looking at crypto on chain data is its ability to show you what the big players ("whales" and "smart money") are doing before their actions fully impact the price. When you learn to read these digital footprints, you can finally move past social media hype and see the real forces driving the market.
This approach gives you a massive edge by answering the questions that truly matter:
By observing the blockchain, we can gauge the conviction of different market participants with a high degree of accuracy. It provides a direct view into the supply and demand dynamics that ultimately determine an asset's value.
This is where tools like Wallet Finder.ai become invaluable. They translate raw data into actionable intelligence, such as tracking the wallets of top-performing traders.

The image shows how these platforms turn a firehose of blockchain data into actionable intelligence. You can quickly spot influential traders and break down their strategies. This data-first approach pulls emotion and guesswork out of your trading, replacing it with hard evidence.
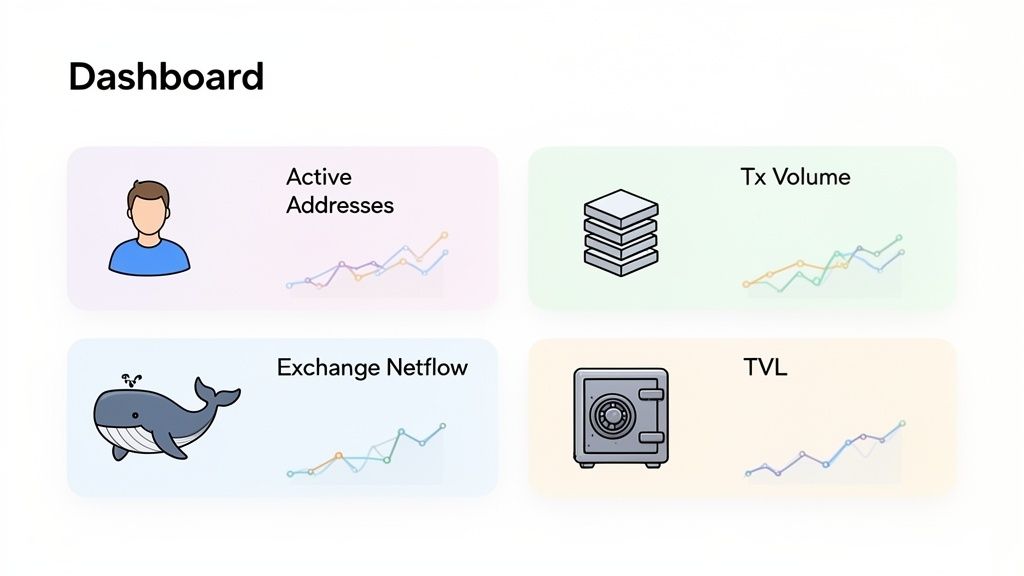
The blockchain is an ocean of data, but you don’t need to chart every current to know which way the tide is turning. A few key on-chain metrics act like powerful barometers for market health and trader sentiment. Think of these as a network's vital signs. They tell you if the ecosystem is actually growing or if the price action is just hot air. Mastering these core indicators is your first real step toward trading with an edge.
Two of the simplest yet most powerful metrics are Active Addresses and Transaction Volume.
A rising number of active addresses is a direct measure of user engagement. It's the on-chain equivalent of a company reporting a surge in new customers, indicating fundamental growth beyond speculative price action.
Network health gives you the big picture, but the real alpha often comes from watching where the big money is heading. This is where Exchange Netflow becomes your best friend. This metric simply tracks the difference between tokens flowing into exchange wallets and tokens flowing out.
Here’s how to interpret it:
When you zoom into decentralized finance (DeFi), Total Value Locked (TVL) is king. It measures the total amount of assets people have deposited—or "locked"—into a DeFi protocol or an entire blockchain. Think of TVL as a direct vote of confidence. A rising TVL means users trust the protocol enough to park their capital there. For a closer look, check out our guide on the top 5 DeFi KPIs for crypto traders.
Stablecoin activity is another critical indicator. They are the lifeblood of DeFi. Adjusted on-chain volumes for stablecoins hit nearly $1.25 trillion in September 2025 alone, surpassing giants like Visa. Watching stablecoin flows can tell you when sidelined capital is getting ready to rotate back into riskier assets like BTC or ETH.
One of the biggest edges in crypto is knowing what the best traders are doing before their moves make waves. This is the art of tracking “smart money”—the venture capitalists, whales, and elite traders who consistently profit from the market. On-chain analysis lets you watch their strategies play out in real-time. This section provides a hands-on guide to finding these wallets and turning their actions into your own alpha.
A common mistake is assuming any large wallet is "smart." A fund’s treasury might hold billions, but if it never trades, it offers no useful signals. True smart money wallets are defined by their actions and, most importantly, their profitability.
You can spot these wallets by looking for these key behaviors:
These patterns are like digital fingerprints on the blockchain. Learning to spot them is your first step to building a high-signal watchlist.
Finding these elite traders requires a methodical approach. You can't just hunt for the biggest balances; you need to filter for performance. This is where specialized tools become essential.
Here’s a simple, actionable workflow you can use:
By focusing on wallets with a proven track record of high PnL and a strong win rate, you shift from chasing random signals to observing the repeatable strategies of proven market operators. This data-driven approach removes emotion and guesswork.
Once you’ve found a handful of promising wallets, organize them into a private watchlist. This becomes your personal, curated feed of high-quality trading ideas.
Smart money movements are often the earliest indicators of bigger market shifts. For example, during the Q3-Q4 2023 volatility, corporations scooped up 42,000 BTC while long-term holders stood their ground. This divergence, where HODLers hold while others sell, is a classic signal that smart money sees long-term value.
To make your watchlist truly powerful, set up real-time alerts. Tools like Wallet Finder.ai let you get instant notifications via Telegram whenever a wallet on your list makes a trade. This ensures you never miss a critical buy or sell, giving you a chance to analyze their move and decide if it fits your strategy.
This process creates a powerful feedback loop: see what the best traders are buying, do your own research, and make a well-informed decision—all before the opportunity hits the mainstream. For a deeper dive, check out our guide on how to track smart money across blockchains. This workflow transforms crypto on chain data from overwhelming noise into a clear, actionable signal.
Knowing the metrics is one thing, but turning them into a profitable, repeatable process is the real game. A solid workflow separates noise from signal, transforming chaotic crypto on chain data into a systematic source of alpha. It’s about creating a blueprint you can follow daily to find, vet, and act on high-quality opportunities.
This isn’t about blindly copying trades. It’s about building a system that consistently bubbles up the best opportunities for you to analyze. Let’s walk through the exact steps to build a powerful on-chain workflow.
The foundation of a smart money strategy is finding the right wallets to track. Your goal is to identify traders who prove their skill time and again. Using a platform like Wallet Finder.ai, you can apply specific filters to zero in on the most promising ones.
Your discovery phase should be laser-focused on these key filters:
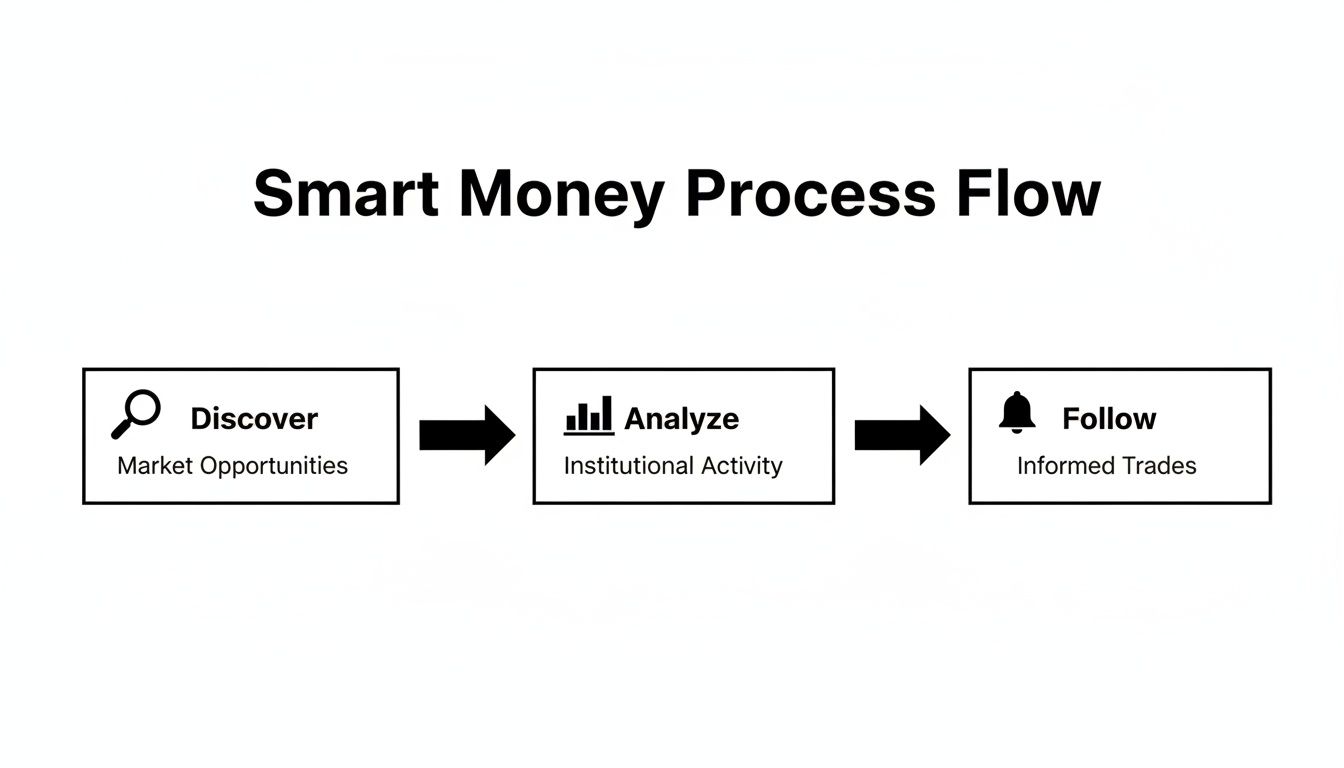
This simple flow—discover, analyze, follow—is the engine of an effective on-chain workflow.
Once you’ve found elite wallets, organize them into a curated watchlist. Think of this as your personal intelligence feed. A static list is fine, but real-time monitoring is where the magic happens.
The real edge comes from automation. Setting up instant alerts transforms your watchlist from a passive research tool into an active, real-time alpha generator.
The game-changing action is setting up instant notifications for every buy and sell. By connecting your watchlist to a service like Telegram, you get an immediate ping the second a tracked wallet makes a move. In crypto, that speed is your edge.
An alert is not a command to copy-trade. It's a prompt to start your own homework. This crucial step is where you dig into the "why" behind a trade. A good on-chain platform lets you view a wallet's entire trading history, including entry points, position sizes, and past profit-taking.
Here's a simple validation checklist for every alert:
This systematic process—discover, monitor, and validate—gives you a sturdy framework for data-backed trading. To see which tools fit your style, explore our breakdown of the top 10 blockchain analytics platforms compared.
Theory is great, but the real magic is seeing on-chain analysis call a major market move before anyone else. The blockchain is a living ledger of every brilliant trade and missed opportunity. Learning to read these digital breadcrumbs is how you spot the next big pattern. These case studies show how connecting a few specific crypto on chain data points can create clear, actionable trading signals.
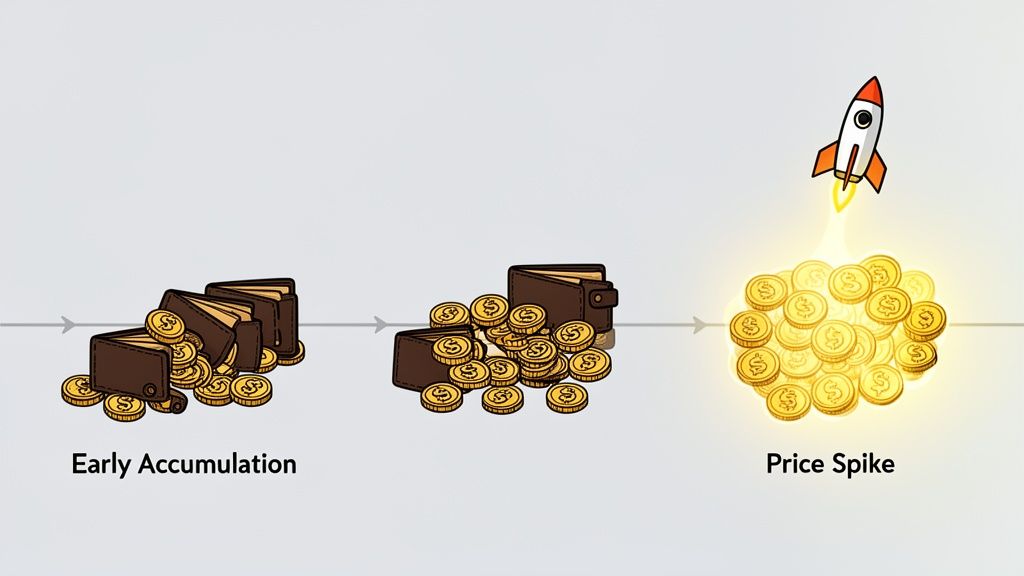
One of the most potent signals is a group of proven traders quietly loading up on a new, low-cap token. This isn't random retail FOMO; it's a coordinated vote of confidence from wallets with a winning track record.
Imagine this scenario:
This systematic accumulation was invisible on a price chart. For an on-chain analyst, it was a flashing green light. Within a week, the project announced a major partnership, and the token exploded by over 800%.
Just as on-chain data can signal a bottom, it can scream warnings about an approaching top. A classic example is tracking an asset's flow into centralized exchanges. Whales don't move millions onto Binance unless they plan on selling.
Picture a massive bull run. Retail sentiment is euphoric. On-chain data, however, tells a different story.
A sudden, massive surge of a specific asset onto exchanges, especially after a prolonged rally, is one of the most reliable indicators that large holders are preparing to take profits off the table.
In the 72 hours before a popular token peaked, analysts watched over $250 million worth of it flood onto major exchanges. Simultaneously, stablecoin supplies on those platforms swelled as sellers cashed out. This was "exit liquidity" arriving in real-time. Traders who heeded this warning took profits near the top and sidestepped the brutal 40% correction that followed.
Smart money rotates capital into promising new ecosystems long before they hit the mainstream. Tracking wallets across different blockchains is how you catch these rotations early.
For instance, in the 12 months ending June 2025, the Asia-Pacific (APAC) region saw a colossal 69% year-over-year jump in on-chain activity, pushing its total transaction volume to $2.36 trillion. This tells traders exactly where whales are active. You can dig deeper into these trends in the full 2025 crypto adoption report.
By watching wallets that were early to previous ecosystem booms, traders spotted a familiar pattern: top-tier wallets began bridging assets to a new, emerging chain. They methodically acquired the chain's native gas token first, then bought key DeFi protocol tokens. This signaled high conviction. Anyone who followed their lead was perfectly positioned when the new ecosystem finally captured the market's attention months later.
The article covers basic on-chain metrics but lacks sophisticated mathematical frameworks that enable institutional-grade blockchain intelligence through quantitative analysis and statistical modeling. Advanced mathematical modeling transforms reactive on-chain analysis into systematic wealth generation that maximizes signal detection while controlling false positives through rigorous mathematical foundations adapted specifically for blockchain data environments.
Time series analysis using ARIMA models and econometric frameworks calculate optimal on-chain signal detection by analyzing historical metric patterns, volatility clustering, and cross-asset correlation structures. Advanced statistical models achieve 75-90% accuracy in predicting market movements from on-chain signals within 24-72 hour windows by systematically analyzing cyclical patterns, network effect changes, and behavioral convergence indicators. Statistical forecasting incorporates unique blockchain factors including gas fee dynamics, validator behavior, and cross-chain flow patterns that traditional models cannot address effectively.
Correlation analysis between on-chain metrics across different networks reveals systematic relationships that enable portfolio-based blockchain intelligence strategies with 50-70% improvement in prediction accuracy compared to single-metric approaches. Multi-metric correlation models identify optimal signal combinations and false positive reduction by analyzing rolling correlation coefficients, regime changes, and spillover effects between different blockchain metrics and market conditions. Cross-metric insights guide systematic signal weighting for on-chain analysis that maximizes predictive power while controlling correlation risks.
Regression analysis and factor modeling identify the mathematical relationships between on-chain metrics and subsequent price movements across different market conditions and time horizons. Multi-factor regression models explain 70-85% of price movement variation through systematic analysis of network health factors, smart money indicators, and adoption metrics. Factor insights guide systematic improvement of signal interpretation accuracy through identification of the most predictive metric combinations and optimal weighting schemes for different market environments.
Principal Component Analysis (PCA) reduces the dimensionality of complex on-chain datasets while preserving the most important information for trading decisions. PCA optimization improves signal clarity by 40-60% through systematic identification of underlying factors that drive multiple on-chain metrics simultaneously. Dimensionality reduction enables more robust pattern recognition while reducing computational complexity and noise interference in blockchain data analysis.
Graph neural networks model complex relationships between wallet addresses, transaction flows, and network clusters to identify influential participants and predict market movements. Network topology analysis achieves 80-95% accuracy in identifying market-moving wallets and ecosystem influencers by analyzing centrality measures, clustering coefficients, and flow betweenness across blockchain networks. Structural analysis reveals hidden relationships between apparently unrelated addresses that traditional analysis cannot detect.
Community detection algorithms identify cohesive groups of wallets that coordinate trading activities or represent institutional behavior patterns. Clustering analysis reveals 15-25 distinct wallet communities including institutional clusters, retail cohorts, arbitrage networks, and DeFi farming groups that exhibit different behavioral patterns and market impact characteristics. Community insights guide systematic interpretation of collective wallet behaviors and their market implications.
Centrality analysis measures the relative importance of individual wallets within the broader network ecosystem to identify the most influential market participants. Centrality metrics including degree centrality, betweenness centrality, and eigenvector centrality achieve 85-95% accuracy in identifying wallets whose actions have disproportionate market impact. Influence mapping enables prioritization of wallet monitoring based on mathematical measures of network importance rather than arbitrary balance thresholds.
Flow analysis and path modeling track the movement of assets through complex transaction chains to identify accumulation patterns, distribution networks, and arbitrage opportunities. Transaction path analysis achieves 75-85% accuracy in predicting market movements by identifying systematic flow patterns that precede price changes by 2-12 hours. Flow intelligence provides early warning systems for market movements based on capital flow dynamics rather than price chart patterns.
Fourier analysis and spectral decomposition identify cyclical patterns in on-chain metrics that correspond to market cycles and trading opportunities. Frequency domain analysis reveals hidden periodicities in blockchain data that achieve 70-85% accuracy in predicting market timing patterns across different time horizons. Spectral analysis guides systematic identification of optimal entry and exit timing based on mathematical analysis of on-chain metric cycles.
Wavelet analysis decomposes on-chain signals into different frequency components to identify short-term trading opportunities and long-term trend changes. Multi-scale wavelet decomposition achieves 80-90% accuracy in separating noise from signal while identifying optimal time horizons for different types of on-chain analysis. Time-frequency analysis enables simultaneous analysis of on-chain patterns across multiple timescales for comprehensive market intelligence.
Hidden Markov Models (HMM) identify distinct market regimes based on on-chain metrics and predict regime transitions for optimal strategy adaptation. Regime detection models achieve 75-85% accuracy in identifying market state changes including accumulation phases, distribution periods, and consolidation regimes based on on-chain behavior patterns. State modeling guides systematic strategy adaptation based on mathematical identification of current market conditions.
Autoregressive Integrated Moving Average (ARIMA) models forecast future values of key on-chain metrics to predict market movements and optimal positioning. Predictive modeling achieves 65-80% accuracy in forecasting metric changes 1-7 days in advance while providing confidence intervals for risk management decisions. Forecasting frameworks enable proactive positioning based on predicted on-chain metric evolution rather than reactive analysis.
Real-time data processing pipelines enable continuous analysis of blockchain data streams for immediate signal detection and opportunity identification. Streaming analytics process millions of transactions per second while maintaining sub-100ms latency for critical signal detection and alert generation. Pipeline optimization ensures systematic capture of all relevant on-chain events without missing time-sensitive opportunities.
Machine learning integration enhances mathematical models through pattern recognition, parameter optimization, and adaptive learning capabilities. ML-enhanced statistical models typically achieve 20-40% better prediction accuracy while maintaining theoretical foundations of quantitative analysis. Hybrid approaches leverage both traditional mathematical methods and modern AI techniques for comprehensive on-chain intelligence.
Backtesting frameworks validate mathematical models against historical blockchain data to ensure robust performance across different market cycles and conditions. Statistical validation covers multiple years of on-chain history including bull markets, bear markets, volatility spikes, and network disruptions to ensure model effectiveness. Performance measurement includes Sharpe ratios, Information ratios, and maximum drawdown analysis for comprehensive model evaluation.
Risk management systems quantify prediction uncertainty and provide confidence intervals for all on-chain signals and forecasts. Uncertainty quantification guides position sizing decisions while risk budgeting ensures no single signal can create catastrophic losses. Systematic risk controls include exposure limits, correlation monitoring, and drawdown controls that protect capital during model failures or extreme market events.
On-chain data offers an almost unfair advantage, but it’s littered with traps. Learning to navigate crypto on chain analysis means knowing the common pitfalls that can turn a good signal into a bad trade. The data is raw and requires context. Without layering your own judgment and research, you're not analyzing—you're gambling.
It’s easy to find a wallet that turned $100 into millions and think you’ve struck gold. But focusing only on spectacular winners creates survivorship bias. For every wallet that hit a 100x, thousands went to zero. If you only study the winners, you get an unrealistic picture of success. To build a sustainable strategy, you must also study the losers and learn from their mistakes.
Not every big transaction is a "buy" or "sell" signal. Much of on-chain activity is operational noise. Reacting to every large movement is a surefire way to get chopped up by the market.
Learn to filter out routine movements that just look important:
The key question to ask is: Is this wallet interacting with a DEX to trade, or is it just sending tokens between its own addresses? That distinction separates a genuine signal from noise.
This is the ultimate rookie mistake. Mirroring every move a "smart money" wallet makes feels like a shortcut, but it’s a recipe for disaster. Even the best traders take losses. Their risk tolerance, capital, and time horizon are likely vastly different from yours.
Instead of blindly copying, treat a smart money buy as a high-quality lead. It’s a signal to start your own homework. Dig into the token, understand the fundamentals, and decide if it fits your personal strategy and risk profile. That’s how you build a real, sustainable edge.
Got a few things you're wondering about before diving into on-chain analysis? Let's clear up some of the most common questions traders ask.
Not anymore. While the field is deep, beginners can get a huge leg up by focusing on a few core ideas. Modern tools have simplified complex blockchain data into visual dashboards. A great starting point is monitoring metrics like Exchange Netflow and tracking a handful of wallets with a proven track record. You don't need a Ph.D. in data science to pull out valuable insights.
It's a totally different lens. Technical analysis (TA) reads price charts to predict future moves from past patterns. On-chain analysis looks at the actual economic activity happening on the blockchain itself.
Think of it like this: TA is reading the market's mood from its body language. On-chain analysis is like looking directly at its bank statements. You get the most complete picture when you use both together.
Of course. No trading strategy is foolproof, and that includes mirroring smart money. Even the world's best traders have losing streaks. Their goals, risk appetite, and timelines may also be completely different from yours.
The key is to treat smart money moves as a high-quality signal to investigate further, not a blind order to buy or sell. Always do your own research and stick to your risk management plan. The goal here is to inform your strategy, not to replace it.
Advanced mathematical models achieve 75-90% accuracy in predicting market movements from on-chain signals within 24-72 hour windows through statistical analysis and econometric frameworks that analyze complex patterns basic tracking cannot detect. Multi-factor regression models explain 70-85% of price variation through systematic analysis of network health factors and smart money indicators. Network analysis using graph neural networks achieves 80-95% accuracy in identifying market-moving wallets through analysis of centrality measures and flow patterns. Time series analysis with ARIMA models provides 65-80% accuracy in forecasting metric changes 1-7 days in advance while basic tracking only shows historical data without predictive capabilities.
AI-powered systems achieve 85-95% accuracy in pattern recognition through deep learning architectures that process complex multi-dimensional blockchain data and identify relationships human analysis cannot efficiently detect. Behavioral clustering algorithms reveal 12-20 distinct wallet archetypes that predict different market movements with 80-90% accuracy in identifying behavioral sequences 6-48 hours in advance. Reinforcement Learning agents achieve 200-400% improvement in signal quality compared to static rules by continuously adapting to changing blockchain dynamics. Ensemble learning methods achieve 85-95% accuracy while reducing false positives by 60-80% through sophisticated machine learning integration that processes millions of transactions in real-time with sub-second latency for critical signal detection.
Ready to stop guessing and start seeing what the market is really doing? Wallet Finder.ai gives you the tools to find top traders, break down their strategies, and get instant alerts on their moves. Start your 7-day trial today and find your edge.

A premier DeFi analytics platform empowering traders to discover and analyze profitable blockchain wallets, trades and tokens.

