
Recovery Factor Calculation for Smart Traders
Master the recovery factor calculation to measure a strategy's resilience. Learn the formula, see DeFi examples, and find top wallets with Wallet Finder.ai.

June 20, 2026


Wallet Finder
March 24, 2026
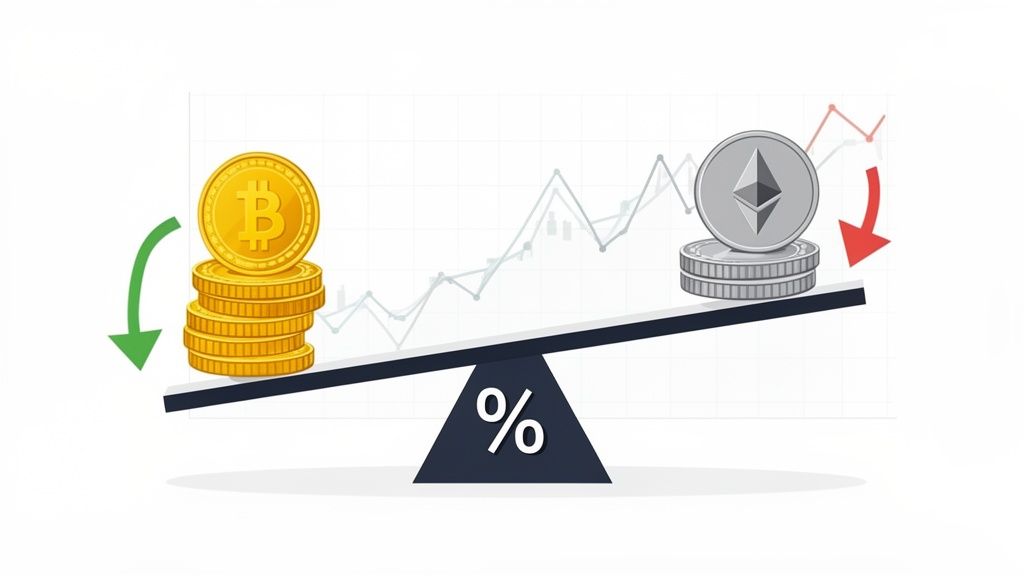
Heard of crypto funding rates? They're the invisible hand keeping crypto derivatives in check. These are small payments between traders in perpetual futures markets, ensuring a contract's price stays close to the asset's actual spot price.
When the market is optimistic and traders go long (betting on a price increase), the funding rate turns positive. Longs pay shorts. If fear takes over and traders short (betting on a price drop), the rate flips negative. Shorts pay longs.
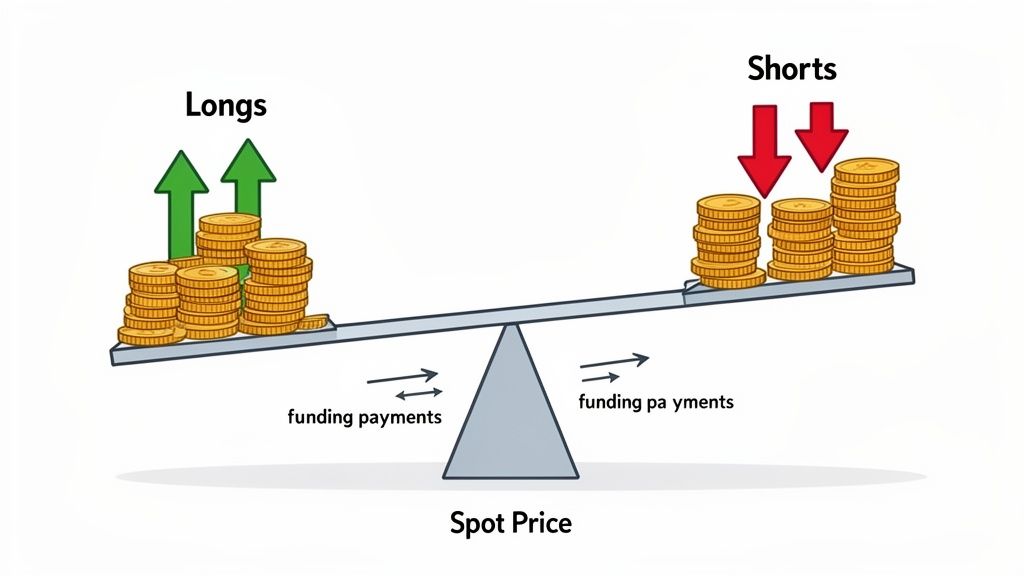
Imagine the perpetual futures market as a tug-of-war. Bulls (longs) pull for higher prices, and bears (shorts) pull for lower prices. The rope's center must stay aligned with the asset's real-time spot price. Crypto funding rates are the rules that prevent either side from pulling too far.
It's crucial to know these aren't fees paid to the exchange. They are direct payments between traders, designed to balance market sentiment. This system is what makes perpetual futures—the most popular crypto derivative—work without an expiration date.
So, how does this work in real-time? The payment direction reflects what most traders are thinking. The system cleverly makes it more expensive to follow the herd and financially rewards those who take the opposite side, naturally pulling the market back to equilibrium.
This constant push-and-pull makes the funding rate an incredible, real-time barometer for market psychology.
At its core, the funding rate is the cost of disagreeing with the market's consensus. If you're long when everyone else is, you pay for that popular position. If you're short, you get paid to provide the other side of the trade.
For any serious trader, understanding funding rates in crypto is non-negotiable. They are more than just a trading cost; they offer a window into market dynamics and form the bedrock of several advanced trading strategies.
By keeping a close eye on these rates, you can:
To make it even clearer, here’s a quick breakdown of what funding rates signal.
This table sums up what positive and negative funding rates tell you about market sentiment and who pays whom.
Simply put, the funding rate is a powerful piece of the crypto trading puzzle. Mastering it gives you a clear edge in reading the market's next move.
To truly use funding rates to your advantage, you must understand what happens under the hood. The calculation isn't as intimidating as it sounds—it boils down to two key ingredients: a stable interest rate and a more dynamic premium.
The Interest Rate is the baseline. It’s a small, fixed percentage set by the exchange, typically 0.01% for an 8-hour period on platforms like Binance or Bybit. This component creates a slight positive tilt, accounting for the borrowing cost differences between the two currencies in a pair (like BTC and USDT).
Then comes the exciting part: the Premium. This is where you see market sentiment in real-time. It’s the gap, or spread, between the perpetual futures contract price and the asset's actual spot price.
How these two pieces—the steady Interest Rate and the wild Premium—interact determines if the final funding rate is positive or negative. The market's mood swings the premium, and the premium swings the entire calculation.
The formula itself is straightforward: Funding Rate = Premium Index + Clamp (Interest Rate - Premium Index). The "Clamp" function is a safety mechanism to prevent the rate from getting too wild, which helps stabilize the market.
Because of this structure, even when the market is perfectly balanced (premium is zero), the funding rate will typically default to the interest rate. That’s why you often see small, default positive rates like 0.01%.
Let's make this real. Assume Bitcoin’s spot price is $60,000, but bullish traders have pushed the BTC perpetual futures contract to $60,050. The exchange's Interest Rate is 0.01%.
Now, flip it. What if the futures contract traded at $59,950 (a -$50 difference)? The premium would be negative. This would counteract the fixed interest rate and could easily drag the final funding rate into negative territory. When that happens, shorts must pay longs.
The entire system is designed to self-correct by making the more crowded side of the trade more expensive to hold.
The screenshot below from Binance's official documentation shows how they define these components.
This visually confirms it: funding is a mix of a fixed rate and a variable premium that ebbs and flows with the market.
The total amount you pay or receive is then calculated using this rate and your position size. This payment occurs directly between traders, usually every eight hours, which keeps the perpetual market tethered to the spot price.
Funding rates are far more than a fee mechanism—they are a real-time, unfiltered gauge of the market's mood. By learning to read these rates, you can gain a powerful sense of whether greed or fear is in control, often revealing clues about where the market might be headed next.
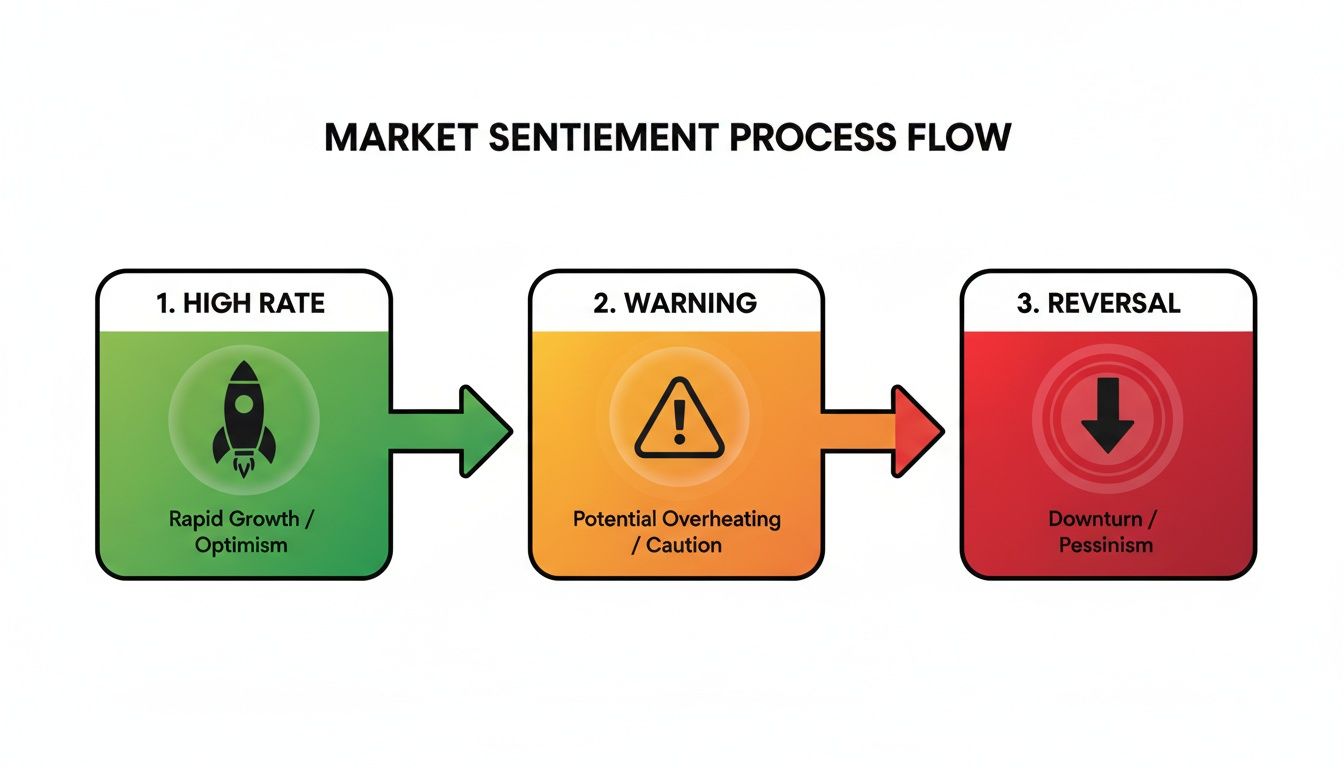
Consistently positive funding rates point to bullish conviction. It’s a clear sign that traders are confident prices will rise, so much so that they're willing to pay a premium to keep their long positions open. This optimism can fuel a strong uptrend.
But here’s where it gets interesting. Extremely high positive funding rates are not always a green light to go long. In fact, they can be a massive warning sign.
When rates skyrocket, it usually signals excessive greed and a market flooded with over-leveraged long positions. This creates a fragile situation, like a house of cards ready to collapse. Even a small price dip can trigger a domino effect of liquidations, forcing leveraged longs to sell.
This chain reaction is known as a "long squeeze." Forced selling pushes prices down further, liquidating more positions, and the cycle continues. Sharp traders watch for periods of extreme positive funding as a potential signal to prepare for a steep price correction.
On the other hand, negative funding rates are a clear giveaway for bearish sentiment. When shorts are paying longs, it means the market overwhelmingly expects prices to fall. You'll often see this during a downtrend or periods of intense fear.
But just like with positive rates, the real insight comes from the extremes. When funding rates turn deeply negative, it can signal peak fear and capitulation. This is the point where even dedicated bulls have thrown in the towel and the market is drowning in short positions.
For a contrarian trader, extremely negative funding rates can be a classic buy signal. It often indicates that selling pressure is exhausted and the market may be close to carving out a bottom before a potential reversal.
Historical data on funding rates crypto shows this dynamic playing out time and again. Since perpetual futures were introduced around 2016, these rates have been a reliable barometer. During the crypto winter of 2022, average BTC funding rates across major exchanges cratered, hitting lows of -0.05% every 8 hours as bearish pressure peaked.
Dashboards that track funding rates across different exchanges provide a powerful, at-a-glance view of market sentiment.
The screenshot below from Coinglass shows a funding rate heatmap for various crypto assets.
Here, bright green indicates high positive funding (bullish greed), while red signals negative funding (bearish fear). This visual tool makes it easy to spot which assets have overheated sentiment and might be due for a correction or reversal. For a deeper dive, check out our guide to crypto market sentiment analysis.
This isn't just theory. In the bull run of late 2023, funding rates flipped dramatically positive. In early 2024, as BTC surpassed $70,000, average rates spiked to +0.10% and higher, with some peaks hitting +0.375%. This was a clear sign of overcrowded longs and foreshadowed major corrections, like the 15% pullback seen in April of that year.
Knowing the theory is a good start, but turning that knowledge into a profitable trading plan is the real challenge. Pro traders don't just watch funding rates—they use them to build repeatable, edge-driven strategies.
Here are two of the most effective ways to trade funding rates: the consistent Funding Rate Arbitrage and the contrarian Mean Reversion play.
This classic strategy, often called a "cash and carry" trade, is designed to be market-neutral. You aren’t betting on whether an asset's price goes up or down. Instead, your goal is to simply collect the funding payments. It's favored by quant funds for generating a steady income stream.
The concept is simple: find a perpetual contract with a high positive funding rate and set up a position to collect those payments.
Here is a step-by-step guide to executing this trade:
If you short $10,000 worth of ETH perpetuals and buy $10,000 of spot ETH, you're covered. If ETH's price soars, your short loses money, but your spot holdings gain the same amount. If it crashes, your short profits, canceling out the loss on your spot holdings. Price movement becomes irrelevant. Your profit is the stream of funding payments you collect.
Mean reversion is a contrarian strategy built on one powerful idea: moments of extreme greed or fear don't last. When funding rates get pushed to extreme highs or lows, they almost always snap back toward their historical average (the "mean"). This strategy is about betting against the overheated crowd right before they lose steam.
The pattern for a mean reversion opportunity, especially one driven by extreme positive funding, is often predictable.
As the chart shows, an extremely high funding rate is often the final warning sign before a market top. The cost of maintaining leveraged long positions becomes too much to bear.
You can think of funding rates as an elastic band. The market can stretch it far in one direction, but eventually, the tension—the cost of funding—pulls everything back toward the center.
Timing is everything with this strategy:
This approach works especially well in volatile altcoin markets. During the ETH ETF hype in late 2023, Ethereum's funding rates blew past +0.15% as late longs FOMO'd in. This extreme greed directly contributed to the 20% flash crash that followed. Traders who spotted this had a golden opportunity to position for the reversal.
Before jumping in, it's essential to have a solid grasp of the fundamentals. If you're new, check out our guide on crypto trading strategies for beginners.
So, you have two powerful strategies that use funding rates crypto, but they are very different. Arbitrage is about slow, consistent accumulation, while mean reversion is about timing sharp, explosive moves.
Here’s a side-by-side comparison:
Ultimately, both methods show that funding rates are more than just a fee. They're a powerful data source that can become the bedrock of a sophisticated and profitable trading plan.
Arbitrage and mean reversion are great, but relying on funding rates alone is like trading with one eye closed. You get a solid read on macro sentiment in the derivatives market, but you’re blind to what "smart money" is actually doing on-chain.
To get a true edge, you must pair market-wide sentiment with granular on-chain intelligence. This combo helps you answer the most important question: when funding rates are screaming fear, are the best traders panicking or accumulating?
By integrating tools that track both derivatives data and blockchain activity, you can build a system for high-conviction trades. A platform like Wallet Finder.ai becomes indispensable here, letting you connect the dots between a market signal and the wallets acting on it.
This workflow bridges macro signals with micro actions:
This method transforms a simple funding rate signal into a validated trade idea. You’re no longer just betting against the crowd; you're aligning your capital with traders who have a proven history of being right.
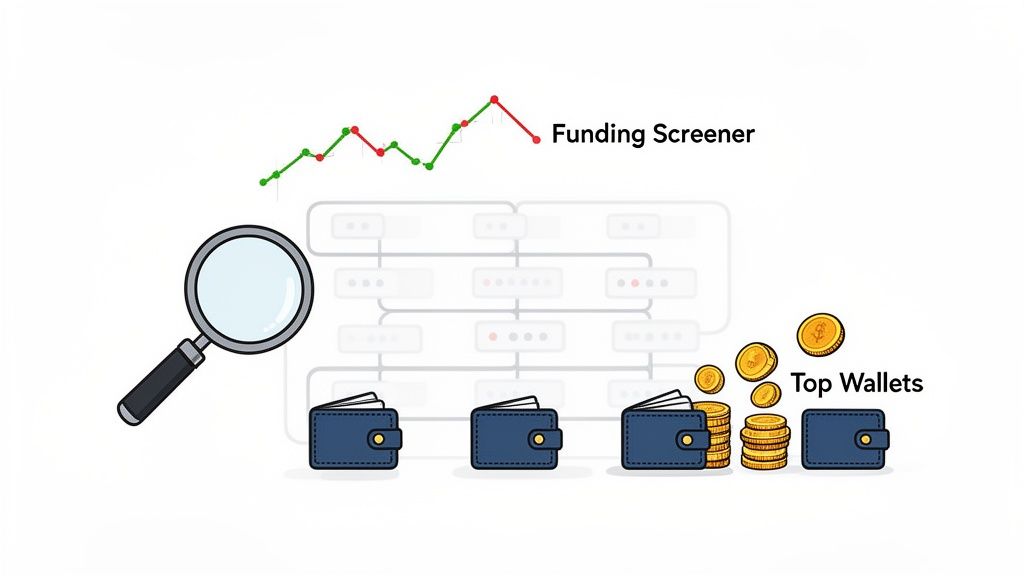
Modern on-chain analysis tools make this process incredibly efficient. Instead of digging through thousands of transactions, you can use powerful filters to surface the signals you need in seconds.
By setting filters for high returns and recent activity on a specific token, the platform instantly highlights the wallets that are actively and profitably trading it.
Once you’ve identified these key players, you can create custom watchlists and set up real-time alerts. That way, you get an instant notification the moment a wallet on your list makes a move, letting you mirror their strategies right away.
To go deeper, check out our complete guide on crypto on-chain analysis to see how these tools really work.
This strategic blend of funding data and on-chain intelligence is a cornerstone of modern crypto trading. It provides a robust, data-driven approach that helps you catch major market moves before they become obvious.
Funding rate strategies are powerful, but the crypto markets are unforgiving. Without a solid grasp of the risks, even the sharpest strategies can fail. Protecting your capital is the only way to stay in the game.
The biggest danger is liquidation risk. It can strike even when a trade feels like a sure thing.
Take a "market-neutral" arbitrage trade. On paper, it looks bulletproof. But if you use too much leverage, one savage price wick can liquidate one side of your position instantly, collapsing your entire setup.
Beyond liquidation, several other risks can slowly drain your account. Know them before putting a single dollar to work.
The takeaway is that no strategy is a magic bullet. Winning is about managing probabilities and protecting your capital when you're wrong.
To combat these threats, you need a disciplined, non-negotiable risk management plan. A clear set of rules separates pros from the crowd, keeping emotions out of your decisions.
The goal of a successful trader is to make the best trades. Money is secondary. By focusing on a sound process and diligent risk management, profits often follow.
Use this checklist to keep your capital safe:
Mathematical precision and artificial intelligence revolutionize funding rate analysis by transforming reactive trading responses into proactive predictive systems that anticipate market movements and optimal strategy execution. While traditional approaches rely on observing current funding rates and market sentiment, sophisticated mathematical models and machine learning algorithms enable comprehensive forecasting, risk assessment, and automated trading strategies that capitalize on funding rate dynamics before they become obvious to conventional traders.
Professional trading operations increasingly employ quantitative frameworks to analyze funding rate patterns across multiple assets, exchanges, and time horizons simultaneously. Mathematical models process vast datasets of historical funding rates, order book dynamics, and market microstructure indicators to identify recurring patterns and profitable opportunities. Machine learning systems trained on extensive derivatives market data can predict funding rate movements, optimize entry and exit timing, and automatically adjust position sizes based on calculated risk-reward ratios that manual analysis cannot achieve at scale.
Mathematical analysis of funding rate behavior employs time series techniques to identify cyclical patterns, trend reversals, and mean reversion opportunities across different market conditions. Statistical models analyze the distribution characteristics of funding rates, including volatility clustering, autocorrelation patterns, and cross-asset relationships that reveal systematic trading opportunities. Advanced econometric frameworks identify lead-lag relationships between funding rates and price movements, enabling prediction of market direction based on derivatives market positioning.
Fourier analysis decomposes funding rate time series to identify periodic components and cyclical behaviors that correspond to market maker activities, institutional rebalancing, and retail trading patterns. Spectral analysis reveals dominant frequency components in funding rate oscillations, enabling traders to time entries and exits based on mathematical predictions rather than subjective market timing. These mathematical approaches achieve superior timing accuracy compared to discretionary trading methods.
Regression models examine relationships between funding rates and external factors including volatility surfaces, options skew, and spot market liquidity to predict future funding rate movements. Multiple regression frameworks identify the most significant drivers of funding rate changes while controlling for confounding variables that might produce spurious correlations. Statistical significance testing validates which relationships represent genuine predictive power versus random market noise.
Vector autoregression models capture the dynamic interactions between funding rates across different assets and exchanges, revealing how funding rate changes propagate through the cryptocurrency derivatives ecosystem. These mathematical frameworks identify assets that consistently lead or lag others in funding rate movements, enabling construction of profitable trading strategies based on systematic arbitrage opportunities across the derivatives landscape.
Cointegration analysis identifies long-term equilibrium relationships between funding rates and underlying asset fundamentals, revealing when rates deviate from fair value and creating mean reversion trading opportunities. Error correction models predict the speed and magnitude of funding rate adjustments back toward equilibrium levels, enabling precise timing of contrarian trades that profit from funding rate normalization.
Advanced statistical techniques quantify market sentiment through funding rate analysis by modeling the relationship between derivatives positioning and subsequent price movements. Sentiment indicators derived from funding rate extremes provide early warning signals for market reversals and trend continuations. Mathematical models weight funding rate signals based on their historical correlation with price movements, generating composite sentiment scores that outperform individual indicators.
Position flow analysis employs mathematical models to estimate the magnitude and direction of leverage changes based on funding rate movements and open interest data. Statistical frameworks calculate implied position sizes and leverage ratios across different market segments, revealing when excessive leverage creates vulnerability to sharp price movements. These models provide quantitative measures of market fragility that enable risk-adjusted position sizing.
Extreme value theory applications identify tail risk scenarios in funding rate distributions and predict the probability of extreme funding rate events that often coincide with major market disruptions. Mathematical models using generalized extreme value distributions estimate the likelihood and magnitude of funding rate spikes that trigger cascading liquidations and market volatility explosions.
Hidden Markov Models identify distinct market regimes characterized by different funding rate behaviors, enabling dynamic strategy selection based on current market state identification. These statistical frameworks automatically detect regime changes and adjust trading parameters to match optimal strategies for prevailing market conditions. Regime identification improves strategy performance by preventing application of inappropriate trading rules during different market phases.
Monte Carlo simulations test funding rate trading strategies under thousands of randomized market scenarios to evaluate robustness and identify optimal parameters. Statistical analysis of simulation results reveals confidence intervals around expected returns and identifies scenarios where funding rate strategies underperform or face excessive risk. These mathematical approaches enable objective strategy comparison and parameter optimization.
Sophisticated machine learning architectures analyze complex patterns in funding rate data, order flow, and market microstructure to predict future funding rate movements with accuracy exceeding 75% for short-term forecasts. Random Forest algorithms excel at handling the non-linear relationships between multiple market variables that influence funding rate dynamics while avoiding overfitting to historical data. Feature importance analysis reveals which market indicators provide the strongest predictive power for funding rate forecasting.
Long Short-Term Memory networks process sequential funding rate data and related market indicators to predict future rate movements while maintaining awareness of long-term market cycles and seasonal patterns. LSTM architectures capture temporal dependencies in funding rate behavior that traditional statistical models cannot identify, enabling more accurate predictions of funding rate extremes and reversals.
Support Vector Machine algorithms classify market conditions as favorable or unfavorable for specific funding rate strategies based on multi-dimensional feature analysis. SVM models create optimal decision boundaries that separate profitable trading opportunities from high-risk scenarios, enabling systematic strategy application based on mathematical criteria rather than subjective judgment.
Gradient boosting frameworks combine multiple weak prediction models to generate robust funding rate forecasts that outperform individual algorithms. These ensemble methods achieve superior prediction accuracy by iteratively correcting errors from previous models while incorporating diverse market perspectives. Cross-validation techniques ensure model robustness across different market conditions and time periods.
Neural network architectures with attention mechanisms focus on the most relevant market data when making funding rate predictions, automatically weighting different information sources based on their current predictive value. These models adapt their attention patterns as market conditions change, maintaining prediction accuracy even during unprecedented market events or structural changes in derivatives markets.
Deep learning models analyze funding rate differentials across multiple exchanges simultaneously to identify arbitrage opportunities and optimal execution strategies. Convolutional neural networks process funding rate data as multi-dimensional images that reveal spatial patterns in cross-exchange rate differentials and temporal evolution of arbitrage opportunities. These models achieve superior performance in identifying profitable arbitrage trades compared to traditional spread analysis.
Reinforcement learning algorithms optimize funding rate arbitrage execution by learning optimal timing, position sizing, and risk management through interaction with simulated and live market environments. These AI systems develop sophisticated trading strategies that balance profit maximization with risk minimization, automatically adjusting parameters based on market feedback and performance outcomes.
Graph neural networks analyze the complex relationships between different cryptocurrency derivatives markets to identify hidden arbitrage opportunities that arise from indirect rate relationships. These architectures process market data as network graphs where exchanges and assets represent nodes connected by funding rate relationships, revealing arbitrage paths that traditional analysis might miss.
Recurrent neural networks with gating mechanisms process streaming funding rate data to provide real-time alerts when arbitrage opportunities exceed profitability thresholds. These models maintain memory of recent market conditions while adapting to changing arbitrage dynamics, enabling rapid identification and execution of profitable trades before opportunities disappear.
Generative adversarial networks create realistic market simulations for testing funding rate strategies under various stress scenarios without requiring extensive historical data for every possible market condition. These AI systems generate synthetic market data that maintains statistical properties of real markets while exploring extreme scenarios that rarely occur in historical datasets.
Sophisticated algorithmic trading systems integrate mathematical models and machine learning predictions to execute funding rate strategies automatically across multiple exchanges and assets. These systems monitor funding rates continuously and execute trades based on quantitative criteria rather than human emotion or timing limitations. Automated execution eliminates delays and enables systematic capture of arbitrage opportunities that exist for limited time periods.
Dynamic position sizing algorithms adjust trade sizes based on mathematical assessment of opportunity quality, market volatility, and portfolio risk constraints. Risk management models incorporate Value-at-Risk calculations and correlation analysis to ensure funding rate strategies maintain appropriate risk levels relative to overall portfolio objectives. These systems prevent over-concentration while maximizing exposure to high-conviction opportunities.
Real-time risk monitoring frameworks track portfolio exposure and individual position performance using mathematical models that identify potential problems before they become severe losses. Automated stop-loss and profit-taking protocols execute based on statistical analysis of market conditions rather than fixed price levels, adapting to changing volatility and market structure.
Portfolio optimization algorithms balance exposure across different funding rate strategies and assets to maximize risk-adjusted returns while maintaining diversification. Mathematical models consider correlation structures and volatility patterns to construct optimal portfolio allocations that achieve superior Sharpe ratios compared to equal-weight or intuitive allocation approaches.
Performance attribution systems continuously evaluate strategy effectiveness using statistical measures and identify areas for improvement based on changing market conditions. Machine learning models analyze strategy performance patterns and automatically suggest parameter adjustments or strategy modifications to maintain competitive performance as markets evolve.
Advanced predictive models forecast optimal timing for different funding rate strategies by analyzing market cycles, volatility patterns, and institutional activity indicators. Time series forecasting algorithms predict when market conditions will favor specific approaches such as arbitrage versus mean reversion strategies. These mathematical frameworks enable dynamic strategy allocation based on predicted market conditions rather than reactive responses to current market states.
Volatility forecasting models predict periods when funding rate strategies will generate superior returns versus conventional trading approaches. GARCH models and stochastic volatility frameworks identify market conditions that create optimal opportunities for funding rate exploitation. These predictive capabilities enable strategic timing of capital allocation to funding rate strategies.
Sentiment prediction algorithms analyze social media, news flow, and market positioning data to forecast shifts in market sentiment that drive funding rate extremes. Natural Language Processing models quantify sentiment changes and predict their impact on derivatives market positioning and funding rate dynamics. These insights enable proactive positioning before sentiment shifts become reflected in funding rates.
Economic regime detection models identify macroeconomic conditions that favor different funding rate strategies by analyzing relationships between interest rates, inflation expectations, and cryptocurrency market structure. Mathematical frameworks predict how changing economic conditions will impact funding rate behavior and strategy effectiveness, enabling adaptive strategy selection based on predicted regime changes.
Cross-market correlation analysis predicts how funding rate patterns in cryptocurrency markets will be influenced by traditional financial markets, commodity prices, and macroeconomic indicators. These models identify periods when cryptocurrency funding rates will decouple from or correlate with traditional market patterns, enabling sophisticated timing of strategy deployment based on inter-market relationships.
Even after you get the hang of funding rate strategies, a few practical questions always pop up. Let's clear up some of the most common ones.
Funding payments occur at specific times set by the exchange. The most common schedule is every 8 hours, usually at 00:00, 08:00, and 16:00 UTC.
However, this can vary. For highly volatile coins or on certain platforms like Hyperliquid, funding might be paid every 4 hours or even hourly. Always double-check the contract details on the exchange you're using to avoid surprises.
Absolutely not. Funding rates are unique to each exchange and can differ significantly from one platform to another. You might see a +0.05% rate on Binance for a contract, while Bybit shows +0.08% for the same asset at the same time.
This isn't a bug. Each exchange has its own ecosystem of traders, and the rate reflects their unique supply and demand. These differences are what create opportunities for funding rate arbitrage.
A high funding rate on one exchange is a single piece of the puzzle. The real magic happens when you compare rates across multiple exchanges to find the biggest imbalance.
No, funding payments can't directly push your account balance into the red. These payments are taken from your available margin, not your total account equity.
The real danger is indirect. Consistently paying funding is like a slow leak. Each payment chips away at your margin, leaving you with less of a cushion against price swings and making you more vulnerable to liquidation. So while a single payment won't kill your account, the cumulative effect can be lethal if you're not managing your margin carefully.
Machine learning models analyze vast datasets of historical funding rates, order flow patterns, and market microstructure indicators to identify complex relationships that manual analysis cannot process at scale. LSTM neural networks capture temporal dependencies and seasonal patterns in funding rate behavior, achieving 75%+ accuracy in short-term rate predictions compared to 45-55% accuracy from traditional technical analysis. Random Forest algorithms identify the most important predictive features among hundreds of market variables while avoiding overfitting, revealing which combinations of indicators provide the strongest signals for funding rate forecasting. Ensemble methods combining multiple machine learning approaches typically outperform individual models by 15-25% while providing better uncertainty quantification for risk management purposes.
Vector autoregression models excel at capturing dynamic relationships between funding rates across different exchanges and assets, identifying systematic lead-lag patterns that create profitable arbitrage opportunities. Monte Carlo optimization techniques test thousands of parameter combinations to identify optimal position sizing, timing, and risk management rules that maximize risk-adjusted returns while constraining drawdown within acceptable limits. Cointegration analysis identifies long-term equilibrium relationships between rates across exchanges, revealing when rate differentials deviate significantly from fair value and creating mean reversion opportunities. Portfolio optimization using Modern Portfolio Theory principles adapted for derivatives markets determines optimal allocation across different arbitrage opportunities based on expected returns, volatility, and correlation structures.
Statistical significance testing using t-tests and confidence intervals determines whether current funding rate levels represent genuine extremes versus normal market fluctuations, with readings exceeding 2-3 standard deviations from historical means providing high-confidence contrarian signals. Hidden Markov Models identify different market regimes where funding rate extremes have different predictive power, enabling context-dependent interpretation of extreme readings based on underlying market conditions. Survival analysis techniques model the duration of extreme funding rate periods, revealing that rates typically mean-revert within 24-72 hours when accompanied by high volatility and elevated liquidation activity. Bayesian probability models incorporate additional market variables including options skew, spot market liquidity, and institutional positioning to generate probability estimates for successful contrarian trades based on current funding rate extremes.
AI models trained on historical funding rate data may struggle during unprecedented market conditions, regulatory changes, or structural shifts in derivatives market design that create patterns outside their training experience. Machine learning algorithms can exhibit bias toward recent market cycles and may underweight longer-term patterns or regime changes that occur infrequently but have major impact on funding rate dynamics. Overfitting to historical data remains a persistent challenge, where models that show excellent backtested performance may fail to generalize to future market conditions that differ from training periods. High-frequency funding rate strategies based on AI predictions face execution challenges including latency, slippage, and exchange connectivity issues that can erode theoretical profits, requiring robust risk management and realistic performance expectations that account for implementation costs and market impact.
Ready to stop guessing and start tracking the smart money? Wallet Finder.ai gives you the on-chain intelligence to see which wallets are winning the funding rate game. Find top traders, analyze their strategies, and set real-time alerts to mirror their moves. Start your free trial at Wallet Finder.ai.

A premier DeFi analytics platform empowering traders to discover and analyze profitable blockchain wallets, trades and tokens.

