
Recovery Factor Calculation for Smart Traders
Master the recovery factor calculation to measure a strategy's resilience. Learn the formula, see DeFi examples, and find top wallets with Wallet Finder.ai.

June 20, 2026


Wallet Finder
February 14, 2026

Crypto market sentiment analysis is the art of gauging the market's collective mood to anticipate where prices might go. Think of it as taking the market's emotional temperature. When fear dominates, people sell. When greed takes over, they buy. Mastering this psychology gives you a powerful edge in navigating crypto's notorious volatility.
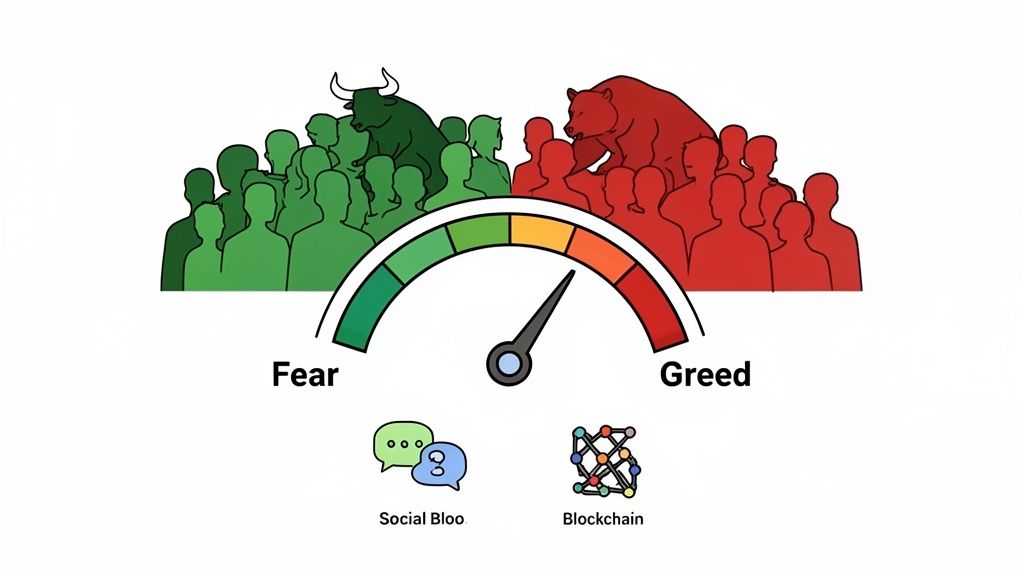
In traditional finance, you analyze balance sheets. In crypto, you analyze human emotion. Most crypto assets are driven by hype, speculation, and FOMO, not fundamental value. This is why sentiment analysis isn't just useful—it's essential.
Instead of getting lost in chart patterns, this approach digs into the human element that creates massive bull runs and gut-wrenching corrections. A coin's price is often a reflection of what people feel it's worth, not just what a technical indicator says.
To get a full read on the market, you need to analyze data from two distinct sources: what people say (off-chain) versus what they actually do (on-chain). Combining them is where the real insights lie. The table below breaks down these two primary types of sentiment signals.
Signal TypeData SourceWhat It MeasuresExampleOff-ChainSocial Media, News, ForumsPublic conversation, hype, and general interest. Basically, what people are saying.A sudden spike in "Bitcoin" searches on Google, or a trending token on X (formerly Twitter).On-ChainBlockchain Ledger DataActual user behavior and money flow. In other words, what people are doing.Large amounts of ETH moving from private wallets to exchange wallets, suggesting intent to sell.
Understanding both is key. Off-chain signals tell you about the crowd's mood, while on-chain signals show you what the smart money is actually doing with their capital.
The most powerful insights come from finding a mismatch between the two. For instance, if you see widespread fear and panic on social media (off-chain) but notice large, experienced wallets are quietly buying up the dip (on-chain), that's often a screaming signal that a market bottom is near.
This guide will walk you through how to read both types of signals. You’ll learn to take the pulse of social media chatter and, more importantly, decode the hard data written directly onto the blockchain. This dual-pronged approach helps you move from being reactive to proactive, letting you anticipate market moves by understanding the emotions that drive them.
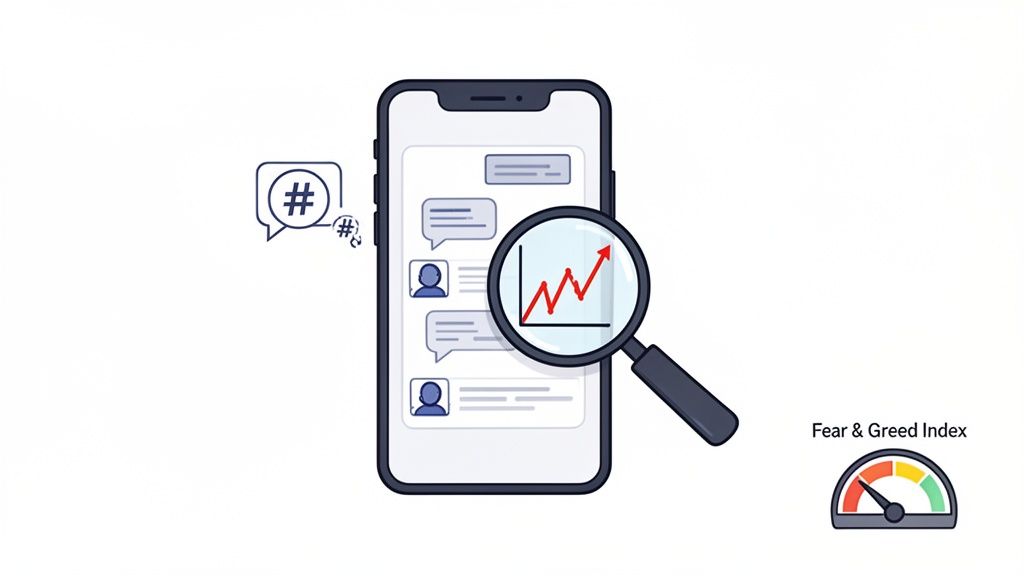
While on-chain data shows what investors do, off-chain indicators tell you what they feel. This is the collective psychology of fear, greed, and hype that floods social media, news headlines, and search engines. Learning to read this "social pulse" is a cornerstone of any solid crypto sentiment analysis.
Platforms like X (formerly Twitter), Telegram, and Reddit are massive, real-time focus groups for the crypto market. When a token or narrative starts trending, it’s a clear signal of surging public attention, which often precedes a major price move. This isn't just noise; it's a raw feed of investor emotion. A sudden spike in conversation can foreshadow a pump, while a wave of negative chatter can signal an impending dump.
To make sense of the endless chatter, analysts rely on specialized tools and indexes. These instruments distill millions of data points into a single, digestible metric. The most famous of these is the Crypto Fear & Greed Index. It’s built to measure the two primary emotions that drive markets, boiling them down to a simple score.
The Fear & Greed Index operates on a simple premise: extreme fear can cause investors to sell irrationally low, creating buying opportunities. Conversely, extreme greed can lead to irrational exuberance and overvalued assets, signaling a potential market top.
This index is a composite score calculated from several key data sources:
By blending these inputs, the index gives you a quick snapshot of whether the market is overly fearful or dangerously greedy. To dig deeper into how these metrics are analyzed, check out our guide on how NLP analyzes crypto social media data.
The real value of the Fear & Greed Index, popularized by Alternative.me, is what it reveals in a historical context. It distills market sentiment into a 0-100 score, where 0 means 'Extreme Fear' and 100 means 'Extreme Greed'.
Looking back, extreme readings have been incredible predictors of major market reversals.
DateEventF&G ScoreBTC Price ActionMar 2020COVID-19 CrashPlunged to 9Marked the bottom before a 1,600% bull run.May 2021Bull Market PeakReached 90+Preceded a massive 50% market correction.
Historical data shows that markets rebound 80% of the time after the index signals extreme fear (a score below 20). This makes it an invaluable tool for contrarian investors—those who buy when others are scared and sell when they're euphoric. When the index flashes 'Extreme Fear,' it’s a signal to hunt for bargains. When it screams 'Extreme Greed,' it’s a warning to consider taking profits.
The Crypto Fear & Greed Index is the single most referenced sentiment tool in crypto. It's free, easy to understand, and gives you a number every day. It's also wrong at specific, predictable moments — and understanding exactly when it fails is more valuable than knowing how to read it when it works.
The index is a composite score built from multiple inputs including volatility, volume, social media activity, Bitcoin dominance, and Google search trends. Each input is weighted and combined into the final 0-100 score. The problem is that several of these inputs lag reality, respond to the wrong signals, or get actively gamed, creating situations where the index says one thing while the market is actually doing another.
The index updates once daily. In a market where significant moves happen in hours — which is crypto's normal operating speed — a daily update is ancient information. A token can crash thirty percent and recover twenty percent in a single trading session. The index captures none of that intraday volatility because it's looking at the close-to-close snapshot.
This lag creates the most dangerous failure mode: the index shows extreme fear the day after a crash has already started recovering. Traders see "extreme fear," interpret it as a buying signal, and buy into what is no longer actually the bottom. The fear reading was accurate twelve to twenty-four hours ago. By the time it publishes, the market has already moved.
The practical workaround is treating the index as a lagging confirmation rather than a leading signal. If the index just shifted to extreme fear and the price is still falling, the signal might be premature. If the index has been at extreme fear for two to three days and price has stabilized or started ticking up, that convergence is much more reliable than acting on a single day's reading.
The index uses Bitcoin dominance as one of its inputs, interpreting rising BTC dominance as a fear signal — the idea being that traders flee to Bitcoin as a safe haven during market stress. This logic works during genuine risk-off events. It breaks down completely during Bitcoin-specific rallies.
When Bitcoin pumps massively on its own narrative — a halving cycle, ETF-related flows, or institutional adoption news — BTC dominance rises not because people are fearful but because Bitcoin is outperforming everything else. The index reads the rising dominance as fear and pulls the score lower than the actual market mood warrants. You end up with a "fear" reading during a genuinely bullish Bitcoin market, which is exactly the wrong signal for anyone looking at the index to gauge overall market sentiment.
Detecting this requires checking whether BTC dominance is rising because the total market cap is falling (genuine fear) or because Bitcoin's market cap is growing faster than everything else (Bitcoin-specific bullishness). The first scenario supports the index's interpretation. The second means the dominance input is creating noise rather than signal.
The index pulls social media data as one of its inputs, measuring post volume and engagement for top cryptocurrencies. This input is directly vulnerable to the manipulation tactics described in the previous section. Coordinated groups that flood social media with positive chatter about a token can artificially inflate the social component of the index, pulling the score toward greed even when genuine market sentiment hasn't shifted.
The effect is usually small on the overall index because social media is only fifteen percent of the total score. But during periods when other inputs are neutral, a manipulated social signal can tip the index from neutral to greedy or from fear to neutral, changing the signal interpretation entirely.
There are specific market conditions where the Fear & Greed Index should be set aside completely and replaced with more granular, real-time sentiment indicators.
During the first seventy-two hours after a major market event — a large exchange hack, a regulatory announcement, a major protocol exploit — the index hasn't had enough time to fully incorporate the event's impact across all its inputs. Real-time on-chain data and funding rates (covered in the next section) give you a much more accurate picture during these windows.
During altcoin seasons where Bitcoin is flat but smaller tokens are pumping massively, the index is dominated by Bitcoin-specific inputs and misses the bullish sentiment that's actually driving returns. In these periods, tracking altcoin-specific sentiment through volume flows and social activity on individual tokens tells you more than the aggregate index.
During periods of extremely low volatility — when the market is consolidating for weeks with minimal price movement — the index tends to cluster in the neutral range regardless of what's actually building underneath. The breakout, when it comes, often happens before the index has time to shift. In these conditions, on-chain accumulation patterns and funding rate positioning are more useful leading indicators than the index.
While off-chain signals tell you what investors are saying, on-chain metrics show you what they’re actually doing with their money. This is the ultimate source of truth. The blockchain doesn't lie. Every transaction and every wallet movement is a verifiable data point offering an unfiltered view of market behavior.
Analyzing this data lets you see whether "smart money" is quietly buying during a panic or cashing out into a rally. This gives you a massive advantage because you’re basing decisions on concrete actions, not just public opinion.
One of the most powerful on-chain metrics is the Realized Price. This is the average price paid for every coin in circulation, calculated based on when each coin last moved. In short, it represents the market's collective cost basis.
This metric is a huge psychological line in the sand.
When the current spot price is above the Realized Price, the average investor is in profit, which supports bullish sentiment. When the price drops below it, the average holder is underwater, signaling widespread pain and potential capitulation.
This dynamic creates clear support and resistance zones. A drop below the Realized Price often marks a period of maximum fear—and maximum opportunity. During the 2022 bear market, BTC’s spot price spent months below its Realized Price of around $20,000. This was a classic sign that a market bottom was forming. You can dive deeper into concepts like this in our guide to essential on-chain metrics.
Not all market participants are created equal. New retail investors often panic-sell, while long-term holders—often called HODLers or "smart money"—are known for their patience. The HODLer Net Position Change metric tracks exactly what this experienced group is doing.
This indicator measures whether these long-term investors are accumulating more coins or distributing them. Their actions are often a leading indicator of major market shifts.
Metrics like these offer incredibly precise sentiment gauges. The HODLer cohort—who control over 70% of the BTC supply—aggressively accumulated during bear phases (adding +50,000 BTC net in Q4 2022) and distributed during bull runs (selling -30,000 BTC at the 2021 peak). You can explore more insights on how these metrics forecast market direction on amberdata.io.
When you see the market price dip below the Realized Price while HODLers are aggressively buying, it paints a clear picture of a potential bottom. This data-driven approach helps you tune out the noise and align your strategy with the market's most experienced players.
The Fear & Greed Index updates daily. Social media sentiment shifts hourly. But there's one indicator that updates every few hours and tells you exactly how leveraged and directionally biased the market is right now, in real time, with actual money behind it. Perpetual futures funding rates. Almost nobody in sentiment analysis talks about them, and they're arguably the most honest sentiment signal available.
Funding rates exist because perpetual futures contracts never expire — unlike regular futures that settle on a specific date, perpetuals run forever. To keep the perpetual price aligned with the spot price, an ongoing payment mechanism runs between buyers and sellers. When more traders are leveraged long (betting price goes up), the funding rate goes positive, meaning longs pay shorts to stay in their positions. When more traders are leveraged short (betting price goes down), the funding rate goes negative, and shorts pay longs.
The size and direction of the funding rate is a direct, real-time measurement of market positioning and conviction. It tells you not what people think or say about the market, but what they're actually putting money behind.
Positive funding rates mean the market is net long — more people are betting on price increases than decreases, and they're paying for that privilege. Small positive rates in the range of zero to ten basis points are normal and don't signal anything unusual. The market is slightly bullish, which is its default state.
When funding rates climb above twenty to thirty basis points, the market is getting aggressively long. Traders are piling into leveraged long positions in volume, which means they're extremely confident prices will continue rising. This feels bullish but is actually a warning sign. Extreme positive funding means a massive amount of leveraged capital is positioned to be liquidated if prices drop even slightly. The market is overextended to the upside, and the fuel for a sharp correction is building.
Negative funding rates tell the opposite story. The market is net short — traders are betting against price increases and paying for that position. Small negative rates are occasionally normal during consolidation. But when funding rates drop to negative twenty, negative thirty, or lower, the market is extremely bearish in its positioning. A huge amount of capital is leveraged short, meaning any unexpected price increase will trigger a cascade of short liquidations that can send prices rocketing higher. Extreme negative funding is often the setup for violent short squeezes.
The most profitable way to use funding rates is as a contrarian indicator, the same way you'd use the Fear & Greed Index at extremes — but with better timing and more precision.
When funding rates hit extreme positive levels and have stayed there for several days, the market is maximally bullish in its positioning. History shows these periods resolve with sharp corrections because the leveraged long positions that created the extreme funding are vulnerable to liquidation. The contrarian play is reducing long exposure or taking profits when funding rates are extremely positive, not adding to longs.
When funding rates hit extreme negative levels and persist, the opposite setup exists. The market is maximally bearish in its positioning, and a short squeeze becomes increasingly likely. The contrarian play is looking for long entry points, knowing that the compressed short positions create upward price pressure when any buying activity triggers liquidations.
Funding rates are most powerful when they confirm or contradict what other sentiment indicators are showing. If the Fear & Greed Index reads extreme greed and funding rates are also extremely positive, both signals are converging on the same conclusion — the market is overextended and a correction is likely. That convergence increases your confidence in the contrarian trade.
If the Fear & Greed Index reads extreme fear but funding rates are actually neutral or slightly positive, the signals are diverging. The social-driven fear hasn't translated into actual bearish positioning yet. Traders are scared but haven't pulled the trigger on shorts. In this case, the fear might be overdone and the market might hold up better than the index suggests.
Funding rates update every eight hours on most major exchanges, giving you three data points per day versus the Fear & Greed Index's single daily update. They're available for free on exchanges like Binance, and aggregated across exchanges on sites like Coinglass. Adding them to your sentiment analysis toolkit takes five minutes and gives you a significantly more real-time and positioning-based view of where the market actually stands.
Knowing the theory is one thing; putting it to work is another. You need a structured framework to turn data into a repeatable process. This is how you stop reacting to market noise and start making disciplined, data-backed decisions.
This four-step workflow is a practical guide for weaving crypto market sentiment analysis into your trading routine.
Start with a bird's-eye view of the market's mood using off-chain indicators. Think of it like checking the weather—it gives you a general sense of the environment.
The goal is a quick "vibe check." The Crypto Fear & Greed Index is the perfect place to start. A quick glance tells you if the market is fearful or euphoric. Supplement this by checking trending crypto topics on social media.
Now, see if the blockchain data backs up the social mood. On-chain metrics show you what investors are actually doing. This is where you separate talk from action.
If social media is fearful, are long-term holders (HODLers) buying the dip? Or are they selling alongside the retail crowd? The answer is a massive signal.
By comparing what people are saying (off-chain) with what they are doing (on-chain), you can spot critical disconnects. These disconnects are often where the most profitable trading opportunities are found.
This infographic breaks down how you can use on-chain signals to validate what you're seeing.
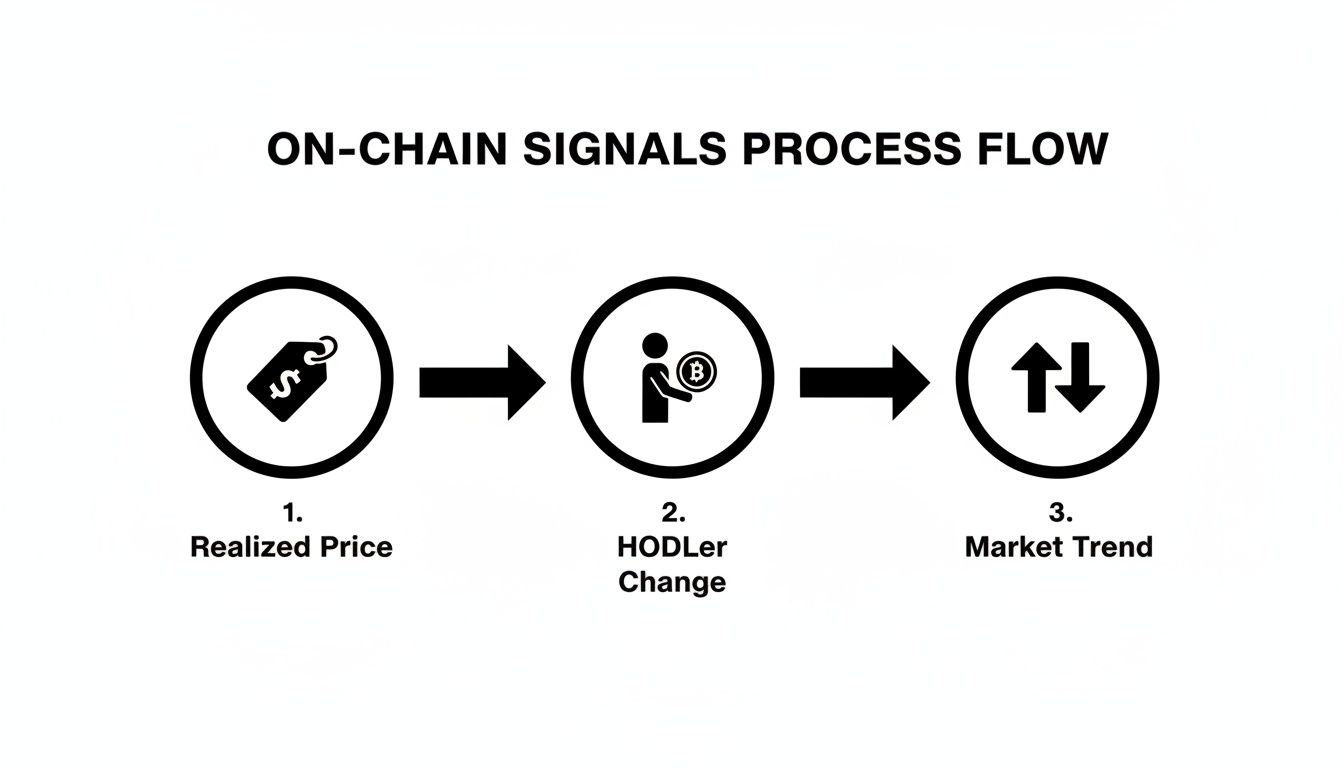
This process simply shows that by looking at hard data like Realized Price and HODLer Net Position Change, you can build a much more solid view of the real market trend.
Sentiment doesn't hit the entire crypto market simultaneously. It flows in a specific, repeatable sequence that creates predictable trading opportunities if you know the order. Bitcoin moves first. Large-cap altcoins follow. Mid-cap altcoins come next. Memecoins and micro-caps bring up the rear. Each stage of this rotation has a distinct sentiment signature, and reading where you are in the cycle tells you which assets are most likely to move next.
This rotation pattern isn't random. It's driven by how capital flows through the market. Bitcoin is the most liquid, most accessible entry point for institutional and large-scale capital. When bullish sentiment starts building, the first money that moves goes into Bitcoin because it's the safest bet and the easiest to buy in size. As Bitcoin starts moving and attention grows, traders who want higher returns start rotating into large-cap altcoins like Ethereum, Solana, and Avalanche. As those start moving too, capital chases even higher returns in mid-caps and eventually in memecoins where the percentage gains can be explosive but the risks are highest.
The Bitcoin phase of rotation shows up in sentiment data as rising Bitcoin-specific search volume and social media mentions, increasing Bitcoin dominance, and positive funding rates on BTC perpetuals. The broader altcoin sentiment stays neutral or slightly negative during this phase because capital is flowing into Bitcoin, not out of it into alternatives.
The altcoin rotation phase begins when Bitcoin's momentum slows or consolidates and Bitcoin dominance starts declining. Capital that rode Bitcoin higher starts looking for the next opportunity. Altcoin-specific sentiment metrics — social mentions, search volume, and on-chain activity for ETH, SOL, and other large caps — start rising while Bitcoin sentiment plateaus. Funding rates on altcoin perpetuals shift from neutral to positive as traders take leveraged positions in anticipation of the rotation.
The memecoin and micro-cap phase is the final and most explosive stage. It's characterized by retail-dominated sentiment — massive spikes in social media activity on platforms like Twitter and Telegram, Google search volume for specific memecoin names, and rapid price movements driven by FOMO rather than fundamentals. On-chain data during this phase shows a flood of new wallets activating for the first time, which is a reliable indicator that the rotation has reached its final stage.
The rotation pattern means that sentiment analysis needs to be asset-class-specific, not just market-wide. Reading the Fear & Greed Index and concluding "the market is bullish" misses the fact that bullish sentiment for Bitcoin doesn't automatically mean bullish sentiment for a random altcoin. The capital hasn't rotated there yet.
The practical application is using Bitcoin sentiment as a leading indicator for what altcoin sentiment will look like in the coming days or weeks. When Bitcoin sentiment is extremely positive and BTC dominance is rising, you're in the Bitcoin phase. Start watching altcoin sentiment metrics and on-chain accumulation patterns, because the rotation into altcoins is likely coming next. Position yourself in promising altcoins before the rotation is obvious, not after the sentiment spike has already driven prices up.
Similarly, when altcoin sentiment is peaking and you're seeing the characteristics of the memecoin phase — explosive social activity, new wallet activation, retail-dominated volume — that's usually the end of the rotation cycle, not the beginning. The smart money has already taken profits from earlier in the rotation. What's left is retail capital chasing the final stage, which historically resolves with the sharpest corrections.
This is the most critical step. Compare your off-chain and on-chain findings to find confirmation (convergence) or contradiction (divergence).
Convergence is when both signals tell the same story. For example, widespread greed on social media and HODLers selling on-chain is a strong bearish signal.
Divergence is the opposite and often where the best opportunities lie. A classic bullish divergence is extreme fear on social media while on-chain data shows smart money is quietly buying.
Signal CombinationInterpretationPotential ActionExtreme Fear + HODLer AccumulationStrong Bullish DivergenceLook for potential market bottoms and entry points.Extreme Greed + HODLer DistributionStrong Bearish ConvergenceConsider taking profits or setting tighter stop-losses.Neutral Sentiment + HODLer AccumulationQuiet Bullish SignalSmart money is buying before the crowd notices.Extreme Greed + HODLer InactivityCautionary SignalThe rally may be driven by retail FOMO, not smart money.
Finally, pull your findings into a clear, actionable plan. A trading thesis is a simple statement outlining your market view and strategy based on the evidence.
This turns your crypto market sentiment analysis from research into a concrete strategy.
By following this four-step framework, you build a structured process for making sense of the market’s emotional chaos and acting with conviction.
Understanding the theory is one thing; turning emotional signals into profit is another. This requires a specialized tool to move from being a passive observer to an active participant.
Knowing the market is fearful is useful. Pinpointing exactly who is profiting from that fear and mirroring their moves? That’s where the real alpha is.
This is precisely the gap Wallet Finder.ai was built to fill. It lets you see what the most profitable traders are doing right now, on-chain. This turns abstract crypto market sentiment analysis into a sharp, actionable playbook.
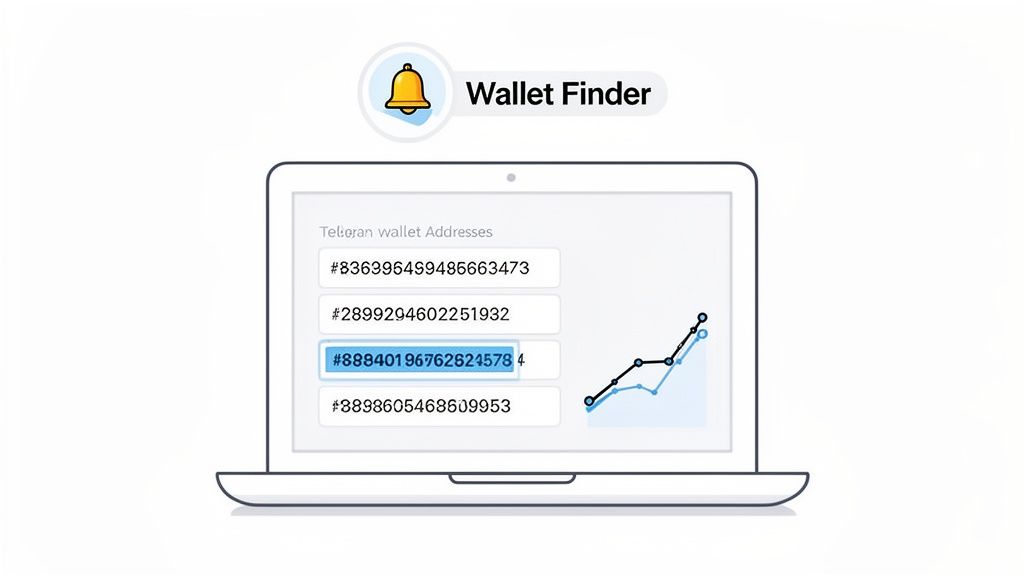
The screenshot above gives you a peek at how Wallet Finder surfaces top-performing wallets, giving you a front-row seat to their recent trades and profitability. This on-chain evidence is the ultimate gut check for your sentiment reads.
Here is a powerful, repeatable strategy using this approach:
This process strips emotion from your trading. You’re not just buying because the market is down; you’re buying because you have hard, on-chain evidence that the smartest traders are accumulating.
This strategy works in reverse when the market gets greedy. When the Fear & Greed Index is screaming "Extreme Greed" (a score above 80), retail euphoria is at its peak. This is a golden opportunity to spot early exit signs.
By monitoring that same list of smart money wallets, you can get a massive head start. When alerts show these winners are taking profits, it’s a powerful warning that the rally might be running out of gas.
You can instantly verify their moves on Wallet Finder. Seeing a top trader who has held a token for weeks suddenly start to sell is a far more reliable signal than any news headline.
The final piece is validation. Never follow a wallet blindly. Verify you’re tracking a consistently profitable player.
Wallet Finder makes this simple by providing deep-dive analytics for any wallet:
In crypto, social chatter on platforms like X can be a surprisingly strong indicator. One study found that sentiment shifts on X could often predict Bitcoin's price movements. This is why combining social signals with on-chain data is so potent. Top wallets are almost always moving before the sentiment-driven pumps become obvious. By using Wallet Finder, you can see their accumulation patterns align with bubbling sentiment, turning market noise into a competitive edge. You can read more about the study's findings here.
By putting these features together, you elevate sentiment analysis from a fuzzy idea into a hard-nosed, data-driven trading system.
Ready to try it yourself? Explore the features on Wallet Finder.ai and start tracking smart money today.
Sentiment analysis gives you a powerful edge, but it's not a crystal ball. Even disciplined traders can fall into common mental traps. Knowing these pitfalls is the first step to using this tool effectively.
The most dangerous trap is confirmation bias. We are wired to favor information that confirms what we already believe. If you're bullish on a token, your brain will amplify positive tweets and dismiss negative on-chain signals. This creates a dangerous feedback loop that can blind you to real risks.
Sentiment analysis is a mirror reflecting the market's mood, not a roadmap telling you where to go. Your job is to read the reflection objectively, not hope it shows you what you want to see.
This bias is supercharged by social media echo chambers, which trap you in a bubble of one-sided opinions.
Another massive risk is sentiment manipulation. It's easy for coordinated groups to create artificial buzz around a token to fool sentiment algorithms and retail traders. A sudden explosion of social media chatter isn't always organic growth; it can be a carefully laid trap.
To protect yourself, you need a system built on objectivity and risk management. Here are a few hard-and-fast rules to keep yourself grounded:
By treating sentiment as one piece of the puzzle—and actively fighting your own biases—you can sidestep these common traps and stack the probabilities in your favor.
The article above correctly flags sentiment manipulation as a risk and tells you to cross-reference signals. That's the right instinct. But "be careful of manipulation" without understanding how manipulation actually works leaves you defenseless against it. The tactics are specific, repeatable, and detectable once you know what to look for.
Sentiment manipulation in crypto isn't some vague shadowy operation. It's a well-documented, frequently executed playbook that coordinated groups run against retail traders constantly. Understanding the mechanics isn't paranoia — it's the minimum baseline for anyone using sentiment signals to make trading decisions.
The most common manipulation starts with a coordinated buying campaign, not with social media. A group accumulates a token quietly over several days or weeks, keeping purchases small enough to avoid triggering whale-alert notifications or unusual volume flags. They spread purchases across multiple wallets and time them during normal market hours when volume is naturally higher, making their activity harder to distinguish from organic trading.
Once the position is built, the social campaign begins. The group floods Twitter, Telegram, Reddit, and Discord with posts about the token. Some posts are genuine-sounding analysis. Others are fake "influencer" endorsements from accounts that were purchased or created specifically for this purpose. The volume of conversation spikes dramatically in a short window, which causes sentiment algorithms to flag the token as trending and potentially registers on the Fear & Greed Index as increased market activity.
Retail traders see the sentiment shift, check the price, notice it's already moving, and pile in behind the trend. The group's accumulated position rides this retail buying pressure higher. When the price reaches their target — usually within hours of the social campaign starting — the group sells everything. The retail traders who bought based on the sentiment spike absorb the selling pressure, the price crashes, and the coordinated group pockets the difference between their quiet accumulation price and their loud exit price.
The entire cycle from accumulation to dump can run in twelve to forty-eight hours. The social media evidence disappears quickly as accounts get suspended or conversations shift to the next target. Most retail participants never connect the dots between the sentiment spike and the coordinated selling that followed it.
The social media side of manipulation is hard to detect in real time because it's designed to look organic. The on-chain side is much easier to catch if you know what to look for, because the blockchain records everything permanently and the accumulation phase leaves a distinctive fingerprint.
The first signal is wallet clustering before the social campaign. If you check the token's transaction history and find that a small number of wallets — say five to twenty addresses — accumulated most of the supply in the days before the sentiment spike, that's not organic interest. Organic buying spreads across hundreds or thousands of wallets with no obvious relationship. Coordinated buying concentrates in a handful of wallets that often share funding sources or activation timing.
The second signal is the relationship between volume and unique wallet activity. Genuine sentiment-driven buying increases both trading volume and the number of unique wallets transacting. Manipulated volume can spike dramatically while the number of unique participants stays flat or barely increases. This means the same wallets are trading with each other or with themselves, generating volume without genuine market participation.
The third signal is timing correlation between social activity and large wallet movements. If you track when the social campaign begins and overlay it against on-chain transaction data, manipulated tokens show large wallet sells starting almost immediately after the social push begins — within the same hour or the same block in some cases. Organic sentiment-driven rallies show a lag between social activity increasing and price responding, because real traders need time to research, decide, and execute.
Different platforms get manipulated differently, and knowing which tactics work on which platforms helps you calibrate how much weight to give social signals from each source.
Twitter manipulation relies on volume and engagement velocity. Bot networks can generate hundreds of mentions in minutes, enough to trigger trending algorithms without any genuine human interest. The detection here is checking whether the accounts posting are real — created recently, have low follower counts, post nothing but the target token, or show engagement patterns that look automated rather than human.
Telegram manipulation is more targeted and harder to spot from the outside. Coordinated groups operate private channels that feed talking points to members, who then post them in public channels as if they came up organically. The posts sound independent but use the same talking points, reference the same price targets, and arrive in similar time windows. If you notice three different people in a public Telegram making nearly identical bullish arguments about the same obscure token within an hour of each other, that's almost certainly coordinated.
Reddit manipulation tends to be more sophisticated because the platform's voting system requires more genuine engagement to surface content. Manipulated Reddit posts often look like legitimate analysis but focus exclusively on price potential while completely ignoring tokenomics, team track record, or competitive positioning. The comments section is usually unusually supportive with zero critical questions — genuine crypto discussions almost always include skeptics.
The defense across all platforms is the same: never act on social sentiment alone. Use it as one input that gets validated or contradicted by on-chain data before you commit capital. If the social signal and the on-chain data point in opposite directions, the on-chain data wins every time.
Even with a solid game plan, some questions always pop up when you're trying out a new strategy. Let's tackle a few of the most common ones.
The single most reliable check is volume-to-wallet ratio. Genuine sentiment-driven activity increases both trading volume and the number of unique wallets participating. Manufactured hype increases volume without meaningfully increasing unique wallet activity, because the same coordinated wallets are generating the volume among themselves.
Pull up the token's on-chain data and compare volume over the last twenty-four hours against the number of unique addresses that transacted in the same window. If volume spiked fifty percent but unique wallets only increased by five percent, the volume is synthetic. If both metrics moved together in roughly similar proportions, the activity is more likely organic.
The second check is social media account quality. Automated bot networks generate volume quickly but leave fingerprints — accounts created recently, with similar posting patterns, minimal follower counts, and engagement that looks scripted rather than conversational. Spending two minutes checking the accounts driving a sentiment spike on Twitter tells you more than any algorithm about whether the sentiment is real.
Sentiment analysis works on probabilities, not certainties. The market can stay irrational longer than any individual trader can stay solvent — that's a well-established principle from traditional finance and it applies even harder in crypto.
Extreme greed can persist for weeks during strong bull runs because new capital keeps flowing in and sustaining the euphoria. Extreme fear can persist for months during bear markets because each small recovery gets sold into by holders desperate to reduce their losses. The sentiment signal tells you the market is overextended. It doesn't tell you when the correction will actually happen.
This is why position sizing and stop-losses matter more than perfect sentiment timing. If you're right about the direction but wrong about the timing, proper risk management keeps you in the game long enough for the thesis to play out. If you oversize based on a sentiment signal and the market stays irrational for another month, you might get stopped out before the move you predicted actually materializes.
Yes, always. On-chain data represents actual capital deployment — real money moving in real directions. Social media represents opinions, which cost nothing to express and can be manufactured at scale for almost nothing.
The hierarchy should be: on-chain positioning data (funding rates, exchange flows, wallet movements) carries the most weight because it's backed by real capital at risk. The Fear & Greed Index and similar composite indicators carry moderate weight because they blend real data with noisier inputs. Pure social media sentiment carries the least weight because it's the easiest to manipulate and the slowest to reflect actual market conditions.
This doesn't mean social media is useless. It's valuable as an early detection system — social buzz often starts before on-chain activity catches up, giving you a few hours of lead time to check whether the buzz is backed by real activity. But when social sentiment and on-chain data disagree, the on-chain data is almost always the more accurate picture of where the market actually is.
Think of sentiment analysis as a probabilistic tool, not a crystal ball. It won't give you winning lottery numbers, but it can stack the odds in your favor by revealing the market's psychological state.
It's like being a professional card counter in blackjack. You don't know the next card, but you know when the deck is "hot" and it's time to increase your bet. Sentiment analysis tells you when the market's deck is loaded with fear or greed. Its power is amplified when layered with other approaches, like technical or fundamental analysis.
The goal of sentiment analysis isn't to be right 100% of the time. It's to identify high-probability moments when the market's emotional state creates a clear imbalance between risk and reward.
You don't need to break the bank to start analyzing market sentiment. There are fantastic free resources available.
Tool TypeExamplesWhat It's Used ForHigh-Level IndexCrypto Fear & Greed IndexA daily, at-a-glance score of overall market mood (0-100).Social ListeningX (formerly Twitter) "Explore" Tab, RedditTo get a ground-level feel for trending coins and narratives.On-Chain DataFree tiers of platforms like Glassnode or Dune AnalyticsTo track exchange flows, whale movements, and HODLer behavior.
Yes, and this is where things get really interesting. While building a fully automated system is a heavy lift for most, a semi-automated approach is completely within reach.
This is exactly where a tool like Wallet Finder.ai comes into play. By setting up custom Telegram alerts on a hand-picked list of proven smart-money wallets, you're essentially creating your own powerful, semi-automated signal feed.
You don't have to stare at charts all day. Just let the alerts come to you the second a top trader makes a move, giving you the chance to analyze their play and decide if you want to follow their lead.
Ready to turn market sentiment into actionable trading signals? Wallet Finder.ai lets you discover, track, and get real-time alerts on the market's top-performing wallets. Stop guessing and start following the smart money today. Find your next winning trade at Wallet Finder.ai.

A premier DeFi analytics platform empowering traders to discover and analyze profitable blockchain wallets, trades and tokens.

