
Recovery Factor Calculation for Smart Traders
Master the recovery factor calculation to measure a strategy's resilience. Learn the formula, see DeFi examples, and find top wallets with Wallet Finder.ai.

June 20, 2026


Wallet Finder
January 16, 2026

Ever heard the phrase "hindsight is 20/20"? In crypto trading, that clarity usually comes after a painful loss. What if you could test-drive your trading ideas before putting real money on the line? That's exactly what a crypto profit simulator does.
Think of it as your personal financial time machine. It lets you take a trading strategy, wind back the clock, and see how it would have performed in the wild markets of the past.

The best analogy for a profit simulator is a flight simulator for pilots. Pilots spend countless hours in a hyper-realistic simulator practicing for turbulence, engine failures, and chaos in a completely safe setting before flying a real jet.
A crypto profit simulator provides that same critical advantage for navigating the extreme volatility of digital assets. It's a significant leap beyond a basic crypto profit calculator, which usually just shows a simple "buy low, sell high" scenario. A simulator is different because it layers in the messy, real-world variables that impact your returns.
A powerful simulator doesn't just look at a price change from point A to point B. It digs into the critical details that determine if a strategy is profitable.
Here are key factors a good simulator must account for:
It's easy to look at a chart and think, "If only I'd bought there and sold there." Simulators bridge the gap between fantasy and reality by stress-testing your ideas against historical data, uncovering hidden flaws before they cost you real money.
For example, imagine you believed the March 2020 COVID crash was a generational buying opportunity. Using a simulator, you could model a $10,000 investment into Bitcoin around $7,200. You could then set a hypothetical sell order at its peak of $69,000 in November 2021. The simulation would calculate the staggering potential return after factoring in realistic fees, showing how a high-conviction trade could have performed under actual market conditions. A great resource from Breet.io explores more on calculating crypto profits in detail.
A good crypto profit simulator isn't a crystal ball; it's a hyper-realistic historical reenactment. Its strength lies in perfectly recreating past market conditions to see how a trading idea would have performed, warts and all. The engine powering this process is called backtesting.
Backtesting is simply applying a set of trading rules to historical data. It’s like having a time machine for your strategy. You can rewind the market, press play, and watch your specific buy and sell rules unfold trade by trade. It's the only way to replace wishful thinking with hard, data-driven evidence.
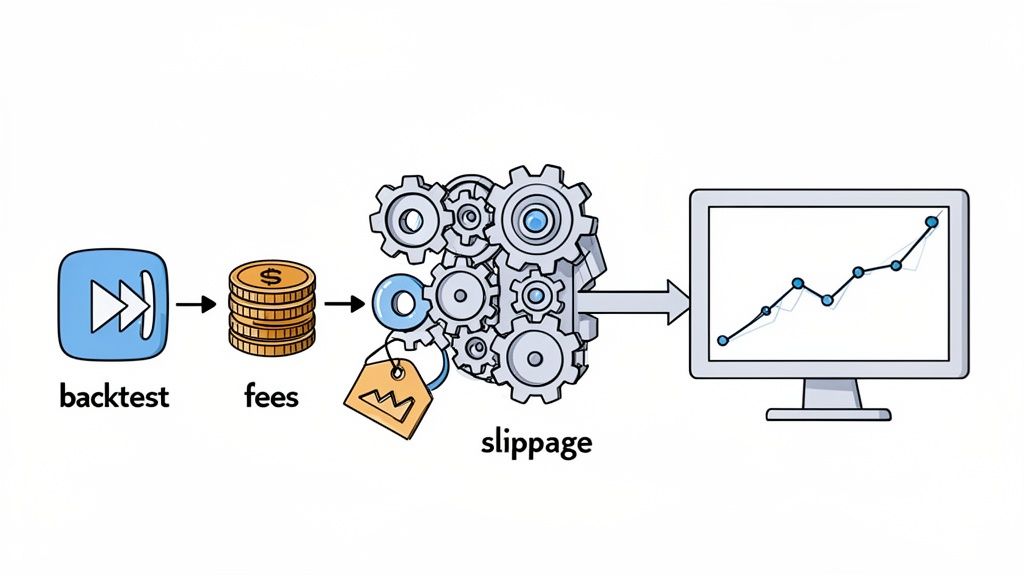
A top-tier simulator does much more than just analyze old prices. Its accuracy comes from layering in the crucial "frictions" of real-world trading that can erode profits.
Here’s a breakdown of the key variables a sophisticated simulator must handle:
A simulation that ignores fees and slippage is like planning a road trip without factoring in gas and traffic. The best tools build these costs in from the ground up for a true-to-life performance report.
The output from a quality simulation isn't just a single profit number. It's a comprehensive performance report that visualizes how a strategy behaves over time. This is where a platform like Wallet Finder.ai shines, letting you find and analyze the track records of top crypto wallets for a clear view of their success.
This screenshot from Wallet Finder.ai, for example, shows a list of wallets ranked by their actual profitability and win rates.
This type of data is the perfect fuel for a simulation. You can see real-world metrics like PnL (Profit and Loss) and Win % before you even start digging into their strategies. By combining backtesting, realistic costs, and clear visuals, a crypto profit simulator becomes an indispensable trading tool.
A crypto profit simulator operates on a simple rule: garbage in, garbage out. The insights you gain are only as good as the data you provide. To get a realistic picture, you must input precise, real-world variables, not just optimistic assumptions.
Think of it like being a pilot in a flight simulator. You don't just practice on sunny days; you run scenarios with engine trouble and bad weather to prepare for reality. A crypto simulator is no different.
To run a historical test, a simulation needs several key pieces of information. These inputs are the building blocks of your "what if" scenario.
Here are the non-negotiables:
A common mistake is plugging in perfect entry and exit points from a historical chart. A powerful simulation forces you to be honest by including fees and potential slippage. This turns fantasy into a data-driven forecast.
This discipline is crucial. A staggering 88% of day traders lose money, often by underestimating the slow bleed from trading fees. Using a simulator that accounts for these costs is a fundamental risk management step. You can dig deeper into how these numbers are crunched with a crypto return calculator.
Once you input your data, the simulator runs it through its backtesting engine to generate a full performance report. This output provides a multi-faceted view of your strategy's historical performance.
Key metrics to analyze include:
Think of the process as a conversation. You provide the "what if" scenario, and the simulator reports the historical outcome.
Here’s a simple breakdown:
By carefully defining your inputs, you receive outputs that tell a rich, detailed story of your strategy's performance, highlighting both its strengths and its weaknesses.
Let's move from theory to action. A crypto profit simulator truly proves its worth when you test strategies from real, profitable traders. By mirroring the on-chain moves of top-tier wallets, you can turn raw historical data into a genuine trading advantage.
The concept is simple: find a wallet with a stellar track record, pull its trade history, and run those exact moves through a simulator to see what would have happened if you’d followed along. This closes the gap between seeing a successful trader and understanding their methodology.
This three-stage process makes simulators so effective.
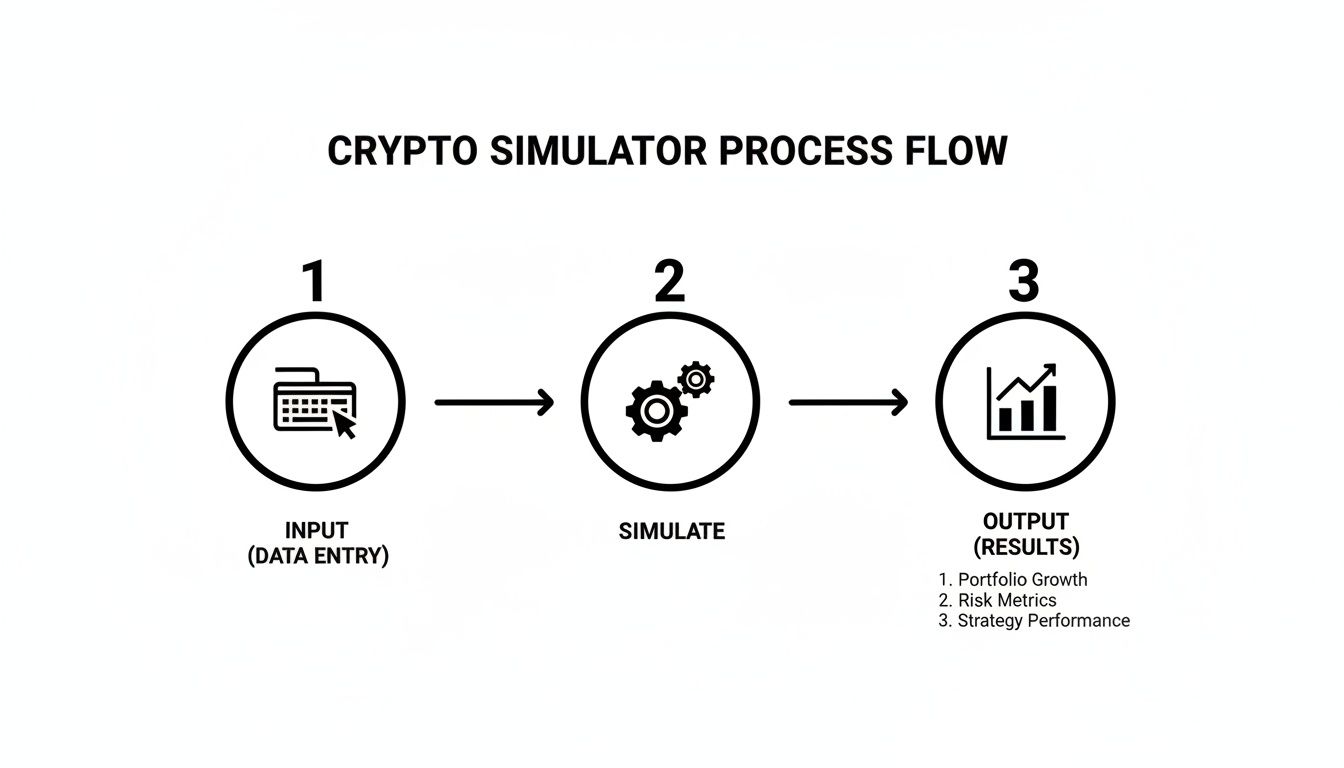
As you can see, it's about feeding the machine good data, letting it run the numbers, and using the results to make smarter decisions.
Here’s a practical workflow to vet a trader’s strategy in a risk-free sandbox:
Traders often forget about taxes until it's too late. Taxes can take a massive bite out of net returns, and a good simulator can help model these costs. The IRS, for instance, saw 837,000 U.S. crypto tax forms filed in 2023 alone—a 58% increase from the prior year.
Simulators that account for short-term capital gains rates (up to 37% in the US) show you the real post-tax profit. Our analysis of top Solana wallets in 2024 revealed that 72% actively optimized exit timing on holdings under one year, likely to manage their tax burden. For more on this, you can dig into the world of crypto tax calculations on InfluencerMarketingHub.com.
By simulating the strategies of top traders, you are not just copying moves; you are stress-testing a proven methodology. This process turns on-chain data into a personal trading blueprint, showing you what works, what doesn't, and why—all before you risk a single dollar.
A crypto profit simulator is an incredible tool, but it's not a magic crystal ball. It’s easy to fall for common biases that paint a dangerously misleading picture of future profits. Knowing these pitfalls separates hopeful amateurs from data-driven pros.
The biggest trap is survivorship bias. This occurs when you only analyze winning wallets—the "survivors"—and ignore the graveyard of wallets that failed using similar strategies. It creates a skewed reality where success looks easier than it is.
To fight this, actively seek out and study failures. When you're analyzing a top wallet on a platform like Wallet Finder.ai, don't just focus on the wins.
When you embrace the full picture—the good, the bad, and the ugly—you get a realistic benchmark for a strategy, not a cherry-picked highlight reel.
A simulation based only on winning examples is like judging a mountain's safety by only talking to the climbers who made it to the summit. You learn far more about the real dangers by studying the reports of those who had to turn back.
Another classic mistake is overfitting. This happens when you tweak a strategy so perfectly to past data that it looks flawless in your simulation. The problem is, you've just memorized historical noise, not a market pattern. The strategy will likely fail in live markets.
It’s like a student who memorizes answers to a practice test instead of learning the material. They'll ace that specific test but fail the final exam.
To avoid this, follow these actionable tips:
By recognizing these biases, your simulator becomes a tool for genuine insight, not just a machine for confirming your hopes.
You've done the hard work: crunched the numbers, run simulations, and identified elite wallets with robust strategies. Now what?
This is where the rubber meets the road. A crypto profit simulator is the bridge connecting historical analysis to real-time trading decisions. After stress-testing strategies, the final step is turning those data-backed insights into an actionable plan. The workflow is simple: find winners, analyze their history, and run simulations to verify their edge wasn't just a lucky streak.
A platform like Wallet Finder.ai is designed to close this loop. After simulating strategies from high-conviction wallets, the smart move isn't to blindly mirror them. It's to add them to a watchlist and set up real-time alerts.
The goal of simulation isn't to find a magic formula you can set and forget. It’s to build a list of vetted strategies that you can deploy with confidence when the right market conditions appear.
This is the critical jump from passive research to active trading.
When one of your tracked wallets makes a move, you get an instant notification. Because you've already simulated their past performance, you have the context to act decisively. The alert tells you what is happening; your simulation results remind you why it matters. This empowers you to make sharp, informed decisions instead of reacting to market noise. For a deeper look, check out our guide on how to backtest trading strategies.
By weaving simulation together with live alerts, you create a systematic, data-driven trading system built to capitalize on proven success.
Got questions? Here are the most common ones we hear, broken down into clear, straightforward answers.
Its accuracy depends on the quality of its data and how many real-world variables it includes. It's not a crystal ball for predicting the future.
Think of it as a flight simulator for your trading strategy. A good one provides a realistic picture of how your strategy would have performed in the past by factoring in costs like trading fees and slippage. Its job is to stress-test your ideas against historical data to find flaws before you risk real money.
Yes, as long as historical price data for a crypto pair exists, you can run a simulation. Tools that tap into on-chain data are especially powerful, offering trade histories for thousands of tokens.
This means you can run a simulation for nearly any token imaginable. Whether you're testing a strategy on Bitcoin or a brand-new memecoin that just launched on Base, if the data exists, you can model it. This capability is essential for exploring new opportunities.
This comprehensive access allows you to test strategies across the entire crypto landscape without any blind spots.
They sound similar but play two different, crucial roles in strategy development. Understanding the difference is key.
Here's a simple comparison:
You need both. Backtesting helps you build a data-proven blueprint. Paper trading is the final dress rehearsal to test your execution skills before deploying real capital.
Ready to stop guessing and start stress-testing your strategies with real on-chain data? Wallet Finder.ai gives you the tools to discover elite wallets, analyze their entire trade history, and run simulations to validate their performance before you risk a single dollar. Find your trading edge today.

A premier DeFi analytics platform empowering traders to discover and analyze profitable blockchain wallets, trades and tokens.

