
Recovery Factor Calculation for Smart Traders
Master the recovery factor calculation to measure a strategy's resilience. Learn the formula, see DeFi examples, and find top wallets with Wallet Finder.ai.

June 20, 2026


Wallet Finder
March 6, 2026
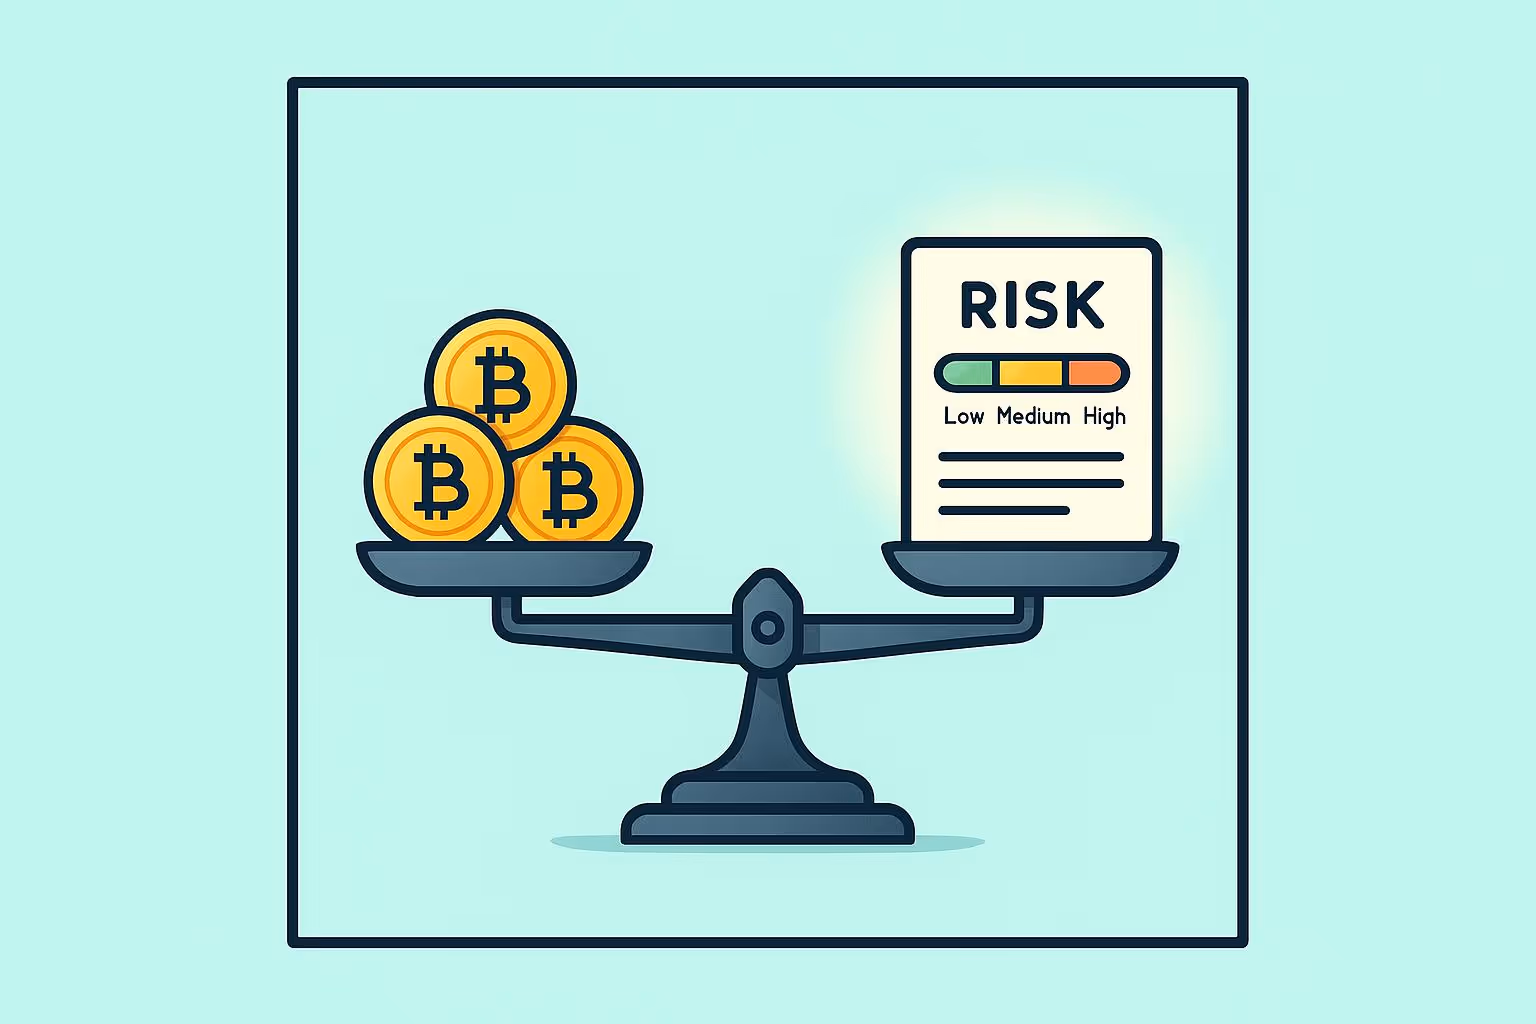
Investing in digital assets can feel like a rollercoaster—one day you’re up, the next you’re wondering if you’ve made a huge mistake. That’s where evaluating the safety of your portfolio becomes crucial. Many investors overlook simple factors like how much of their money is tied to a single coin or whether they’ve considered regulatory red flags. Without a clear picture, you’re essentially gambling rather than strategizing.
A thoughtful approach to managing your holdings can make all the difference. Tools designed to analyze cryptocurrency portfolio risk help you see blind spots, whether it’s overexposure to one asset or ignoring project-specific concerns like team credibility. By taking a few minutes to input details about your investments, you gain clarity on whether your approach leans too heavily on speculation. For those wanting deeper insights into project allocations, Token Distribution Analyzer provides a clear view of token ownership and potential concentration risks.
Beyond just identifying potential pitfalls, understanding your risk level empowers you to act. Maybe it’s spreading your funds across more assets or rethinking how long you plan to hold. Whatever the case, having a personalized snapshot of your situation is invaluable in the fast-moving world of blockchain investments. Start small, stay informed, and build confidence in every decision you make.
The article identifies overexposure to a single asset and project-specific concerns like team credibility as risk factors worth evaluating, which correctly characterizes two important dimensions of crypto portfolio risk. A complete DeFi risk assessment framework requires systematically evaluating five distinct risk categories that together determine a portfolio's true safety profile: market risk, concentration risk, smart contract and protocol risk, liquidity risk, and counterparty risk. Each category is independently meaningful and partially independent from the others, meaning that a portfolio can score acceptably on market risk measures while carrying dangerous smart contract risk, or appear well-diversified on a token-count basis while exhibiting severe concentration risk due to high correlation among its holdings. Evaluating all five categories simultaneously and combining their scores into a composite risk rating produces a more accurate and actionable safety assessment than any single-dimension approach.
Market risk assessment measures a portfolio's sensitivity to broad cryptocurrency market direction and volatility, which is the dimension most commonly addressed in basic risk tools through diversification percentages and holding period considerations. The quantitative inputs to market risk scoring include the portfolio's weighted average beta relative to Bitcoin, computed by multiplying each holding's historical beta coefficient against its portfolio weight and summing across all positions. A portfolio with a weighted average beta of 2.5 will historically decline approximately 2.5 percent for every 1 percent decline in Bitcoin, amplifying broad market drawdowns and requiring a correspondingly higher risk tolerance from the investor. The article's observation that holding longer periods can sometimes lower risk reflects the empirical finding that longer holding periods reduce the impact of short-term volatility events but do not reduce the terminal loss if the underlying assets are fundamentally overvalued at the entry price, which is why holding period should be one input among several rather than the primary risk reduction lever.
Concentration risk assessment extends beyond single-asset percentage to measure the portfolio's effective diversification after accounting for the correlation structure among its holdings. Two portfolios, one holding five different meme tokens on Solana and another holding Bitcoin, Ethereum, a DeFi infrastructure token, a stablecoin, and a real-world asset token, may show identical single-largest-holding percentages of 20 percent each while having dramatically different effective diversification. The five-meme-token portfolio has extremely high pairwise correlations among all holdings, meaning it behaves like a single concentrated position during market stress. The mixed portfolio has low inter-category correlations, meaning that not all positions will decline simultaneously during the same adverse event. Effective number of independent positions is the metric that captures this difference by computing the inverse of the sum of squared portfolio weights — a measure borrowed from portfolio theory that reflects the number of equally weighted uncorrelated positions that would produce the same diversification level as the actual portfolio.
Smart contract risk assessment evaluates the probability and potential magnitude of loss from vulnerabilities or exploits in the DeFi protocols with which portfolio assets interact, which is a risk category entirely absent from traditional financial portfolio analysis and one that has been responsible for billions of dollars in losses across documented exploit events. The inputs to smart contract risk scoring include the audit status of each protocol in the portfolio, the time elapsed since the most recent security audit, the total value locked in the protocol relative to the historical magnitude of exploits in protocols of similar TVL and complexity, the protocol's track record including any prior incidents even if fully resolved, and whether the protocol's core logic has been materially modified since its most recent comprehensive audit.
Protocol audit quality classification distinguishes between different levels of audit credibility, because not all security audit certifications provide equal assurance of protocol safety. A comprehensive audit from a recognized firm covering the full protocol codebase with public disclosure of all findings, including those classified as resolved, provides substantially stronger safety evidence than a limited-scope audit covering only new features or a private audit whose findings are not publicly accessible. Protocols that have undergone multiple independent audits from different firms provide stronger assurance than protocols relying on a single audit source, because different auditors with different methodologies and expertise are more likely to collectively identify vulnerabilities than a single firm applying a single methodology. Assigning each protocol in the portfolio a tiered audit quality score from zero for unaudited through three for comprehensive multi-firm audit with public disclosure allows the smart contract risk component to be computed as the weighted average protocol audit quality score across all protocol exposures in the portfolio.
Protocol concentration risk within smart contract risk measures whether the portfolio's DeFi activity is distributed across multiple independent protocol codebases or concentrated in a single protocol or family of protocols sharing common underlying code. Portfolios where 70 percent of DeFi exposure is concentrated in a single AMM protocol, for example, face a scenario where a single exploit in that protocol's smart contracts simultaneously impairs 70 percent of portfolio value regardless of how well diversified the underlying token holdings appear. Mapping each portfolio position to its underlying protocol dependencies and computing the protocol concentration ratios parallel to the token concentration ratios produces a more complete picture of smart contract risk than token-level analysis alone can provide.
Liquidity risk assessment measures the portfolio's ability to exit positions at reasonable prices under both normal market conditions and stress conditions, which is a critical risk dimension for DeFi portfolios that hold positions in low-liquidity tokens or locked positions with defined exit constraints. The liquidity risk inputs for each portfolio position include the average daily trading volume of the token on its primary markets, the position size as a multiple of that average daily volume, the presence of any lock-up or vesting constraints that prevent exit regardless of market conditions, and the depth of order book or AMM pool liquidity at prices within 5 and 10 percent of the current market price.
Position-to-volume ratio is the primary liquidity risk metric for individual holdings, measuring how many days of normal trading volume the position represents. A position representing 0.1 times average daily volume can theoretically be liquidated in approximately 2.4 hours of normal trading, which represents minimal liquidity risk under most conditions. A position representing 10 times average daily volume cannot be fully liquidated within 10 trading days without substantially moving the market price against the seller, which represents high liquidity risk that means the stated portfolio value substantially overstates the realizable value under any urgent exit scenario. Portfolios carrying multiple positions with high position-to-volume ratios face the compounding risk that all positions become simultaneously difficult to exit during market stress events precisely when liquidity tends to decrease further.
Exit scenario stress testing simulates the portfolio liquidation outcome under three scenarios: orderly exit over 30 days at normal market conditions, forced exit over 5 days in a moderate market decline of 20 percent, and emergency exit over 24 hours in a severe market decline of 50 percent. Computing the estimated realized value of the portfolio under each scenario, accounting for the price impact of the portfolio's own selling activity during liquidation, produces three exit value estimates that bracket the range of realizable portfolio value. The difference between the stated portfolio value at current market prices and the estimated 24-hour emergency exit value represents the liquidity haircut risk — the fraction of stated value that cannot be recovered if an urgent full liquidation becomes necessary — which is the most practically relevant risk measure for investors who may face unexpected capital needs.
The article addresses risk assessment as a static snapshot tool that evaluates the current structure of a portfolio based on manually provided inputs, which is a useful starting point for identifying existing risk concentrations. A more powerful application of crypto risk assessment integrates live on-chain data monitoring to detect emerging risk signals as they develop rather than only when a periodic static assessment is performed. On-chain risk signals provide advance warning of developing threats to specific portfolio positions by monitoring the behavioral changes of sophisticated market participants whose on-chain activity historically precedes adverse price events for the tokens they are exiting, and by tracking the structural health metrics of the protocols and liquidity pools that portfolio assets depend on.
Smart money exit signal detection monitors whether high-performance wallets with documented track records of profitable decision-making are reducing or eliminating their positions in tokens held in the portfolio, which provides the most direct available signal that informed participants have identified information or analysis suggesting reduced future prospects for that token. A wallet that has consistently generated strong returns over 12 to 24 months and that begins systematically reducing a previously large position across multiple transactions over a 3 to 7 day window is exhibiting a behavioral pattern that, when replicated across multiple independent high-performance wallets simultaneously, represents a meaningful consensus signal that the token's risk-adjusted outlook has deteriorated. Detecting this signal before the price decline that typically follows large sophisticated exit events allows a proactive portfolio risk response rather than a reactive one after losses have already been realized.
Whale distribution monitoring extends smart money exit detection to include all wallets meeting size thresholds for meaningful market impact, regardless of their quality classification by historical performance metrics. A single wallet holding 5 percent of a token's circulating supply that begins systematically reducing its position creates significant structural selling pressure regardless of whether that wallet has a documented track record of profitable decisions, because the volume of selling from a position of that size will affect price if sustained over any market condition. Monitoring the net position change of all top-20 holder wallets across a rolling 7-day window for each portfolio holding produces a distribution momentum indicator that flags when large holders as a group are reducing exposure, which has historically been a leading indicator of price deterioration by 3 to 7 days before the selling pressure becomes reflected in a sustained price decline visible to the broader market.
Protocol total value locked trends provide on-chain evidence of whether the DeFi protocols that portfolio assets interact with are experiencing growing or declining user confidence, which directly affects the sustainability of yield rates, the depth of liquidity available for exits, and the protocol's economic security relative to the cost of attacks. A protocol where TVL has declined more than 30 percent over a 30-day rolling window is experiencing significant capital outflows that may reflect user concerns about security, yield sustainability, or competitive alternatives, and these concerns may be better informed than any publicly available analysis because the on-chain capital outflows represent aggregate decisions by sophisticated participants who have already acted on their assessments rather than merely expressed opinions.
Liquidity pool depth monitoring tracks the available liquidity in the specific AMM pools that portfolio tokens depend on for trading, which is the on-chain metric most directly relevant to the portfolio's liquidity risk profile described in the previous section. A pool where liquidity has declined 40 percent over 14 days has become substantially more expensive to exit large positions in, because the reduced pool depth means the same trade size creates greater price impact than it did before the liquidity decline. Detecting this deterioration in real time and incorporating it into a dynamic liquidity risk score that updates the static liquidity risk assessment based on current pool conditions produces a more accurate and timely risk signal than the periodic manual assessment the article describes.
Protocol incident and governance monitoring tracks public security incident reports, governance proposal activity, and community forum discussions for early warning signals of emerging protocol risks that have not yet been reflected in price or TVL metrics. Security researchers frequently publish preliminary findings about potential vulnerabilities in public forums before a comprehensive disclosure, and governance proposals to change protocol parameters in ways that increase yield at the cost of safety are visible on-chain through governance contract activity before they are widely discussed in mainstream crypto media. Building a monitoring layer that tracks these early-warning channels for each protocol with which portfolio assets interact provides a risk intelligence input that complements the quantitative on-chain metrics with qualitative risk context that the quantitative metrics may not capture until after an adverse event has begun.
Portfolio risk response protocols translate emerging on-chain risk signals into specific, pre-defined position adjustment actions that preserve the discipline of the risk management framework by removing judgment calls from the moment of highest emotional pressure. The purpose of pre-defining responses to specific risk trigger conditions is identical to the circuit breaker principle described for drawdown management: establishing in calm conditions what actions will be taken when specific adverse signals appear, rather than making ad hoc decisions under the time pressure and emotional intensity of an actively developing adverse event.
Signal severity tiering classifies each monitored on-chain risk signal into a severity level that determines the urgency and magnitude of the required portfolio response. A Tier 1 signal — defined as simultaneous smart money exit detection in more than three independent high-performance wallets combined with whale distribution momentum turning negative for the same token — triggers an immediate position size reduction of 50 percent within the next trading session. A Tier 2 signal — defined as TVL decline exceeding 25 percent over 14 days in a protocol holding 20 percent or more of portfolio value — triggers a 30 percent reduction in the affected protocol exposure within 3 days. A Tier 3 signal — defined as a governance proposal that increases protocol risk parameters without compensating security improvements — triggers a watchlist flag requiring manual review and a decision within 7 days rather than automatic position adjustment, because governance risks may resolve through vote outcomes that reverse the adverse proposal.
Response size calibration scales the position reduction magnitude to both the severity of the signal and the current portfolio weight of the affected position, ensuring that responses are proportionate rather than reflexively eliminating positions at the first signal regardless of size. A Tier 1 signal in a token representing 3 percent of the portfolio warrants a smaller absolute position reduction than the same signal in a token representing 20 percent of the portfolio, because the risk contribution of the small position is proportionally lower and the transaction costs of partial exit may not be justified by the risk reduction achieved. Computing the risk-adjusted response size as the signal severity multiplier times the current risk contribution of the affected position produces response sizes that are systematically calibrated to the risk reduction achieved rather than mechanically uniform across all affected positions regardless of their portfolio weight.
Great question! Our tool looks at a few key things you tell us about your portfolio. First, it checks how diversified your holdings are—if more than half your money is in one coin, that’s a red flag. Then, it considers how long you’ve been invested, since holding for longer can sometimes lower risk. Lastly, it factors in any extra details you provide, like your sense of market volatility or specific project concerns. All of this gets crunched into a simple risk score with an explanation you can actually use.
Nope, not at all! We’ve designed this tool to work entirely on the info you choose to input manually. There’s no need to link your wallet or share anything sensitive. Just tell us about your holdings, percentages, and any other details you think matter, and we’ll handle the rest. Your privacy is a priority for us.
I wish we had a crystal ball, but sadly, no. This tool doesn’t predict market movements or crashes since it doesn’t pull live data. Instead, it evaluates risk based on the structure of your portfolio and the factors you input, like diversification or investment duration. Think of it as a way to spot potential weak points in your strategy, not a fortune teller. For market trends, you’ll still want to do your own research or follow industry news.
A complete DeFi risk assessment requires evaluating five distinct risk categories that are each independently meaningful and partially independent from one another, meaning that low risk in one category does not imply low risk in others. Market risk measures the portfolio's sensitivity to broad cryptocurrency market direction through weighted average beta against Bitcoin, which determines how much the portfolio amplifies broad market declines. Concentration risk measures effective diversification after accounting for the correlation structure among holdings, because five different meme tokens on the same chain have extremely high pairwise correlations and behave like a single concentrated position during stress events despite appearing diversified on a token-count basis. The effective number of independent positions metric, computed as the inverse of the sum of squared portfolio weights, captures this distinction accurately where simple token counts do not.
Smart contract and protocol risk evaluates the probability and potential magnitude of loss from vulnerabilities in the DeFi protocols interacting with portfolio assets, based on audit quality classification, audit recency, protocol track record, and protocol concentration across positions. This risk category is entirely absent from traditional financial analysis but has been responsible for billions in documented crypto losses. Liquidity risk assesses the portfolio's ability to exit positions at reasonable prices under both normal and stress conditions using position-to-volume ratios and exit scenario stress testing across 30-day orderly, 5-day moderate stress, and 24-hour emergency liquidation scenarios. The difference between stated portfolio value and 24-hour emergency exit value is the liquidity haircut risk — the fraction of stated value that cannot be recovered under urgent liquidation. Counterparty risk measures exposure to exchange insolvency, custodian failure, and protocol governance capture across each platform holding portfolio assets. Evaluating all five categories simultaneously and combining scores into a composite rating produces a safety assessment that is accurate across all structural failure modes, where single-dimension tools may classify genuinely dangerous portfolios as safe because they appear acceptable on the one dimension being measured.
On-chain wallet analytics deliver risk signals that are structurally earlier than price-based signals because the behavioral changes of sophisticated market participants that precede adverse price events are visible in transaction data before they accumulate enough selling volume to produce sustained price movement. The most reliable advance warning signal is smart money exit detection: when multiple independent high-performance wallets with documented profitable track records begin systematically reducing positions in a token across multiple transactions over a 3 to 7 day window, they are exhibiting a behavioral pattern that historically precedes price deterioration by days rather than hours, providing a window for proactive portfolio adjustment before losses are realized.
Whale distribution momentum extends this signal to all wallets meeting size thresholds for meaningful market impact, tracking the net position change of the top-20 holders across a rolling 7-day window. When large holders as a group are net reducing their exposure, the aggregate selling pressure they represent will affect price if sustained. Protocol TVL trend monitoring flags when capital outflows from DeFi protocols holding portfolio assets exceed 30 percent over a 30-day window, which reflects aggregate decisions by sophisticated participants who have already acted on concerns about protocol security, yield sustainability, or competitive positioning. Liquidity pool depth monitoring detects deterioration in the AMM pools that portfolio tokens depend on for trading, updating the static liquidity risk assessment with current pool conditions that may have changed materially since the last periodic review. Portfolio risk response protocols with pre-defined signal severity tiers and calibrated response sizes translate these signals into systematic position adjustments: Tier 1 signals involving simultaneous smart money exit and negative whale momentum trigger immediate 50 percent position reduction, while Tier 2 signals involving TVL decline above 25 percent in a major protocol exposure trigger 30 percent reduction within 3 days, maintaining response discipline during the high-pressure conditions when ad hoc decision-making is most susceptible to behavioral bias.

A premier DeFi analytics platform empowering traders to discover and analyze profitable blockchain wallets, trades and tokens.

