
Recovery Factor Calculation for Smart Traders
Master the recovery factor calculation to measure a strategy's resilience. Learn the formula, see DeFi examples, and find top wallets with Wallet Finder.ai.

June 20, 2026


Wallet Finder
March 6, 2026
The fastest way to monitor DeFi wallets and spot profitable trades.
Managing multiple crypto wallets across blockchains like Ethereum, Solana, and Base can feel overwhelming. Without a clear view of your portfolio, missed opportunities and errors are common.
Tools like WalletFinder.ai simplify this process. They centralize wallet data, analyze performance, and send real-time alerts for significant activities. Features include:
Start your 7-day free trial today to streamline your DeFi portfolio management.
Before diving into multi-wallet tracking, gather the public wallet addresses you want to monitor and make a list of the blockchain networks they operate on. Popular networks include Ethereum (ETH), Solana (SOL), and Base. Since some wallets may interact with multiple chains, ensure your list covers all relevant networks.
You'll also need access to a reliable DeFi portfolio tracking tool. Wallet Finder.ai is a great option, offering a 7-day free trial that provides full access to its analytics features. These include wallet discovery, trade analysis, and token insights across Ethereum, Solana, and Base. With a 4.9 user rating and subscription plans like the Basic Plan ($312 annually or $29 monthly), it's worth exploring after the trial period.
Once you've gathered your wallet addresses and chosen your tracking platform, you're ready to link your wallets and organize your data.
Connecting your wallets is simple when you have your public addresses on hand. On Wallet Finder.ai, you can directly sync wallet data by entering these addresses.
Start by logging into the platform and heading to the wallet connection section. Input your public wallet addresses, and the system will automatically detect the corresponding blockchain network. To streamline your tracking, consider grouping wallets by their purpose. For instance, you might organize them into categories like "Main Trading", "Long-term Holdings", or "Experimental DeFi."
Additionally, adjust your display settings to show values in USD ($) and set your local time zone for accurate transaction timestamps. These steps ensure your data is both organized and easy to interpret. For those looking to understand trading patterns in niche markets, Analyzing Wallet Behavior for Meme Token Trades offers detailed insights into wallet activity and strategy.
Once your wallets are connected, move on to customizing your dashboard for efficient tracking.
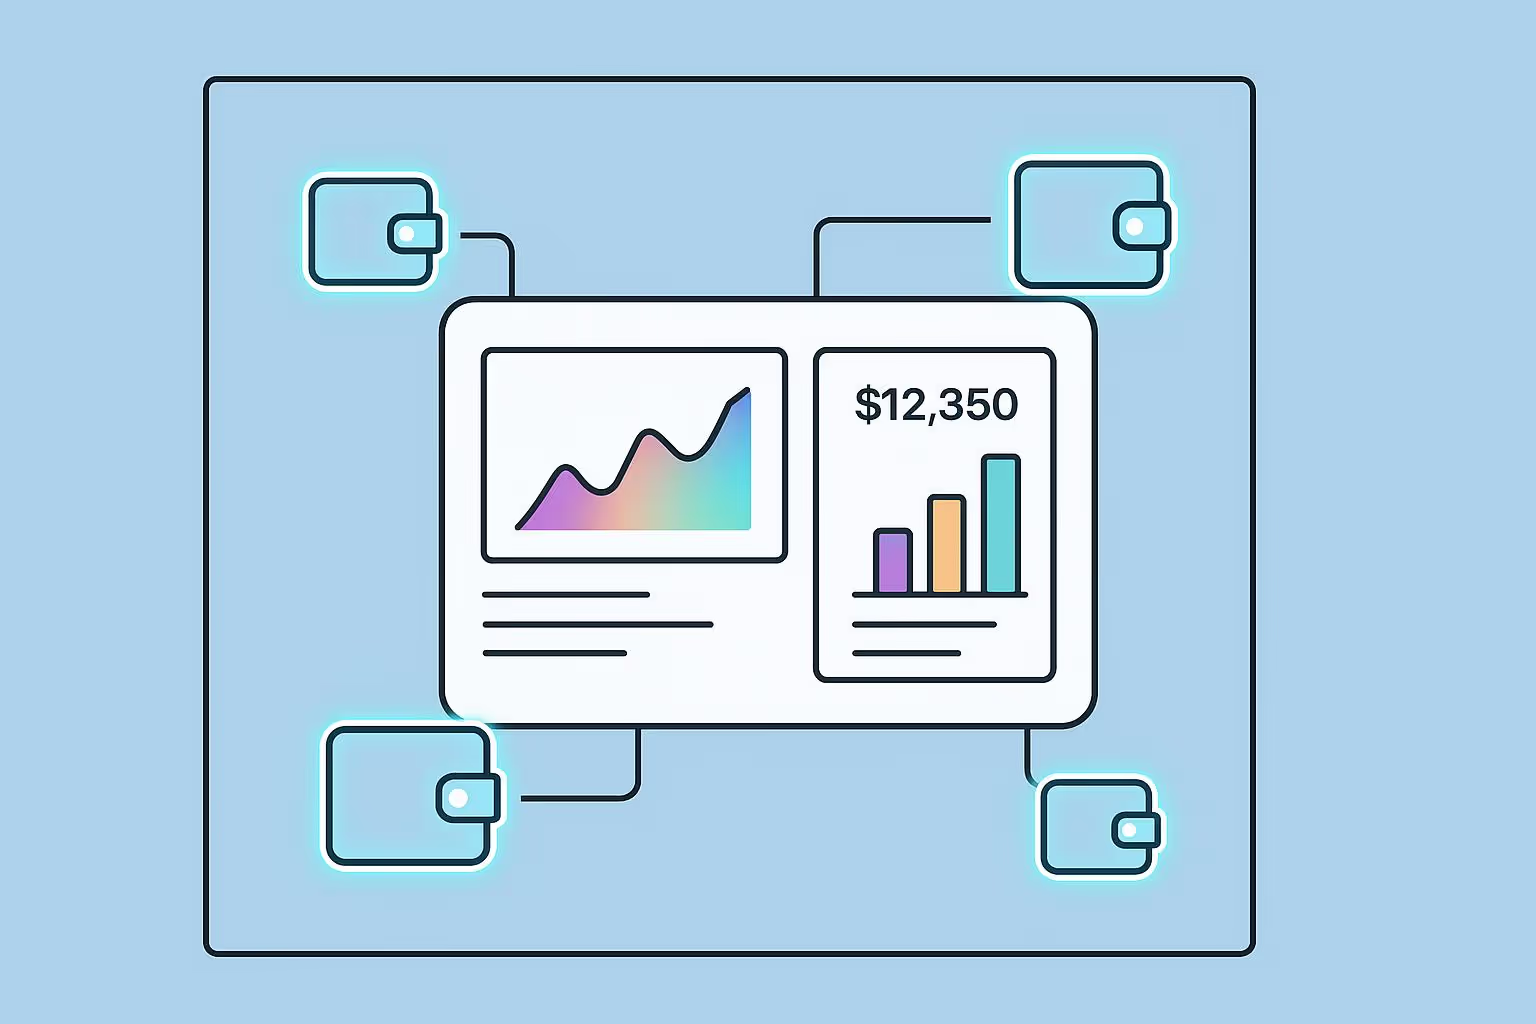
Your dashboard is the command center for managing and analyzing your wallets. Wallet Finder.ai consolidates data from major DeFi blockchains and presents it in an intuitive, customizable interface.
Use the dashboard to monitor profit and loss (PnL) and trading stats through visual graphs and charts. Advanced filters let you sort by metrics like recent gains, streaks, or consistent performance, making it easier to spot trends across your wallets.
"I've tried the beta version of
extensively and I was blown away by how you can filter through the data, and the massive profitable wallets available in the filter presets, unbelievably valuable for any trader or copy trader. This is unfair advantage." - Pablo Massa, Experienced DeFi Trader
Take advantage of custom watchlists to track high-performing wallets in real-time. If you opt for the Premium Plan, you can unlock the "Custom Graphs" feature for tailored data visualizations.
Lastly, configure your transaction history display to match your preferences. Whether you want a quick overview or detailed records of swaps, liquidity provisions, and yield farming activities, you can fine-tune the view. Don't forget to set up export options (CSV or Excel) and schedule regular exports to keep a comprehensive record of your wallet activity.
Your customized dashboard gets a boost with the analytics section, offering detailed performance metrics to refine your trading strategies. Dive into key data points like realized PnL, win percentages, and risk levels for each connected wallet. You can also filter this data by various timeframes, allowing you to evaluate how your investments have performed over specific periods.
Beyond the numbers, the analytics section sheds light on your trading habits. It helps you analyze entry points, exit strategies, position sizing, and timing patterns across all wallets. This level of detail makes it easier to identify what’s working and where adjustments are needed.
Visual tools, such as graphs, map out your portfolio’s growth, while token concentration metrics highlight asset distribution and diversification risks. Together, these insights go beyond the dashboard’s overview, offering actionable guidance for fine-tuning your investment approach.
Staying ahead in the fast-paced DeFi world requires instant access to information. Real-time alerts from Wallet Finder.ai ensure you’re always in the loop, sending immediate notifications about significant wallet activities.
The alert system monitors specific wallet actions and notifies you within minutes when tracked wallets buy, sell, or swap tokens. This quick response time can be the difference between seizing a profitable opportunity or missing out. For instance, you can track wallets with the largest recent gains, longest win streaks, or most consistent performance, then add them to your alert system to stay updated on their moves.
"Get push notifications when a whale wallet makes a move (within just a few minutes!) and never miss the next 10x opportunity." – Wallet Finder.ai
The system also keeps an eye on whale activity, alerting you when large holders make significant trades. These updates provide early warnings of potential market shifts or emerging opportunities, giving you a competitive edge with timely insights.
Once real-time alerts are set, you can further enhance your analysis using export tools.
Exporting data gives you the flexibility to dig deeper into your DeFi activities while maintaining comprehensive records. Wallet Finder.ai allows you to export filtered blockchain data or complete wallet tables directly from the platform.
Data can be downloaded in CSV or Excel formats, enabling you to focus on specific metrics and timeframes. Whether you’re reviewing historical performance, analyzing trading patterns, or studying PnL statistics, having this information in exportable formats ensures you can perform in-depth analysis on your terms.
Premium Plan users gain access to additional export features, such as Custom Graphs, which can be downloaded as visual reports. These graphs make it easier to share insights with advisors or team members, combining raw data with clear visuals to offer a complete picture of your portfolio’s performance.
Tracking multi-wallet DeFi portfolios at the consolidated level answers how much has been made in aggregate but does not answer which wallets, chains, strategies, and token categories are driving aggregate performance, which is the information required to make rational decisions about where to allocate additional capital, which wallets to close or reduce, and which strategies to scale. Cross-chain portfolio attribution disaggregates consolidated portfolio performance into its constituent sources so that a trader managing five wallets across three chains can determine that 70 percent of total returns are being generated by one wallet executing a single strategy while the other four wallets are collectively detracting from portfolio performance, rather than crediting all five wallets equally for the consolidated gain.
The attribution framework for a multi-wallet DeFi portfolio operates across four dimensions simultaneously: wallet-level attribution assigns each wallet's net realized PnL as a percentage contribution to total portfolio PnL, chain-level attribution measures which blockchain network is generating returns versus dragging on performance, strategy-level attribution classifies each wallet's activity into categories including spot trading, yield farming, liquidity provision, and copy trading and measures the return contribution from each, and token-category attribution measures performance across large-cap tokens, mid-cap tokens, meme tokens, stablecoins, and DeFi governance tokens to reveal which asset categories the portfolio is actually deriving its edge from.
Wallet-level contribution analysis produces the most immediately actionable insights because it identifies which specific wallets in a multi-wallet portfolio are adding performance versus diluting it. A trader managing five wallets who discovers that wallet A accounts for 140 percent of total portfolio PnL, wallets B and C each account for 20 percent, and wallets D and E each account for negative 10 percent has a clear capital allocation signal: wallets D and E are destroying value and the capital deployed in them would generate better returns if reallocated to the strategies being executed in wallet A. Without explicit wallet-level attribution analysis, the aggregate portfolio dashboard masks this imbalance by averaging the performance of productive and unproductive wallets into a single consolidated return that appears acceptable while obscuring significant capital inefficiency.
Chain-level performance isolation separates the portfolio returns attributable to Ethereum, Solana, Base, and any other networks into independent performance streams that can be compared on a risk-adjusted basis to determine whether each chain's allocation is justified by its actual return contribution relative to the capital deployed there. Ethereum-based DeFi activity typically involves higher transaction costs per operation but access to deeper liquidity and more established protocols with longer track records. Solana-based activity involves lower transaction costs and faster execution but different risk profiles and token characteristics. Base provides Ethereum compatibility with substantially lower fees, which changes the economics of strategies that execute frequent small transactions.
Cross-chain capital efficiency ratio computes the return per dollar deployed on each chain by dividing each chain's attribution-weighted PnL contribution by the average capital deployed on that chain during the same period. A portfolio deploying 60 percent of capital on Ethereum with 40 percent of PnL contribution is achieving a capital efficiency ratio of 0.67 on Ethereum, while a portfolio deploying 25 percent of capital on Solana with 45 percent of PnL contribution is achieving a capital efficiency ratio of 1.8 on Solana. The cross-chain comparison reveals that Solana is generating substantially better returns per unit of deployed capital in this example, which is the type of insight that consolidated portfolio views obscure but chain-level attribution makes visible.
Bridge cost drag quantification measures the total cost of moving capital between chains including bridge fees, transaction fees on both source and destination chains, and time-value cost of capital during bridge transit periods, and computes this total bridge cost as a percentage of the returns generated by the receiving chain after the capital transfer. Frequent cross-chain capital reallocation based on opportunity identification incurs bridge costs that may consume a significant fraction of the additional return generated by the reallocation. Tracking bridge costs explicitly as a portfolio-level expense category reveals whether active cross-chain rebalancing is adding net value after costs or whether maintaining stable chain allocations and avoiding bridge costs would produce better net returns for the specific portfolio's activity level and return magnitudes.
Strategy-level attribution classifies every transaction across all wallets and chains into a consistent set of activity categories and aggregates the return contribution from each category to reveal which DeFi strategies are generating the portfolio's edge and which are consuming capital and transaction costs without proportionate return. The standard DeFi activity categories for attribution purposes are spot token trading including both manual trades and copy trades, automated market maker liquidity provision including both single-sided and two-token pools, yield farming through protocol incentive programs, staking income from validator or liquid staking protocols, NFT trading, and governance token accumulation strategies.
A portfolio where 85 percent of total realized PnL is attributable to spot token trading while yield farming contributes 5 percent and liquidity provision contributes negative 10 percent due to impermanent loss exceeding yield earned has a clear strategy optimization signal: the liquidity provision activity is detracting from portfolio performance and the capital deployed in LP positions would generate better returns allocated to the spot trading strategy that is demonstrably working. Without strategy-level attribution, the liquidity provision losses are averaged into the consolidated portfolio return and may not be identified as a distinct source of drag.
Holding period attribution extends strategy-level analysis by measuring the distribution of returns across different holding period categories for each strategy type. A spot trading wallet might show that trades held for 2 to 8 hours generate a win rate of 62 percent and average return of 18 percent on winning trades, while trades held for more than 48 hours generate a win rate of 38 percent and average return of 9 percent on winning trades. This holding period performance profile provides concrete guidance for the optimal strategy parameters, revealing that for this specific wallet's trading approach, the edge is concentrated in short-duration trades and extending hold times substantially reduces both win rate and average return on winners.
When connecting multiple wallets, safeguarding your data should be a top priority. Opt for platforms that use encrypted connections to ensure secure data transmission between your device and the service. Encryption acts as a shield, preventing unauthorized access to your information during transfer.
For maximum security, consider using a non-custodial platform. These platforms don't store your wallet keys or private cryptocurrency data, ensuring you maintain complete control over your sensitive information.
Take Wallet Finder.ai as an example. This platform adheres to strict security protocols by employing encrypted connections and refraining from storing wallet keys or private crypto data. Their commitment to user security is reinforced by their statement:
"Your security is our priority. Wallet Finder.ai uses encrypted connections and never stores wallet keys or private crypto data. Only your login credentials and survey responses are securely stored in Amazon's AWS Cognito data centers within the United States."
Always confirm that the platform you choose provides clear documentation about its data handling practices and ensures that any personal information is securely managed.
For U.S. taxpayers, the IRS mandates reporting all cryptocurrency transactions, including DeFi activities across multiple wallets. Staying compliant requires detailed transaction records, and a dependable portfolio tracker can make this task less daunting.
Accurate tax reporting hinges on maintaining thorough documentation. You’ll need to record every transaction with details like timestamps, USD values, and wallet identifiers. Platforms like Wallet Finder.ai simplify this process by offering data export options in formats like CSV or Excel. While they don’t provide direct tax compliance tools, these exports supply the raw data you can use with tax professionals or crypto-specific tax software.
To stay organized, track your cost basis, preserve transaction hashes, and schedule regular data exports - whether quarterly or annually. Having complete and accessible records ensures you're prepared for any tax-related needs.
Beyond protecting your wallet data, it’s wise to evaluate a platform’s broader security measures. Look into its overall security framework, including encryption protocols and transparency in how user data is handled.
Transparency is crucial. For instance, Wallet Finder.ai openly discloses that user data, such as login credentials and survey responses, is securely stored in Amazon's AWS Cognito data centers in the United States. Knowing where and how your data is stored provides clarity and confidence in the platform’s security standards.
Take the time to ensure that the platform’s security policies align with your expectations and provide the level of protection you require.
Managing investments across multiple DeFi wallets doesn’t have to feel like a juggling act. By using unified tracking tools, you can bring all your scattered data together, creating a clear and actionable view of your decentralized assets. The trick is finding platforms that balance strong functionality with robust security, while also offering the transparency needed to make informed choices.
Analytics tools can give you an edge in the ever-changing DeFi market. Features like real-time alerts ensure you stay updated on important market shifts, while data export options let you keep detailed records for tax reporting or deeper strategy analysis. Additionally, studying the trading patterns of successful wallets can help you refine your own strategies for better outcomes.
When managing multiple wallets, security is absolutely critical. Look for platforms that use encrypted connections, non-custodial frameworks, and transparent data-handling practices. These measures protect your sensitive information while allowing you to gain the visibility you need. Platforms with strict security protocols create a reliable foundation for safe and efficient portfolio management.
Now that you’ve got the key insights, it’s time to act. Start your journey with Wallet Finder.ai by signing up for the 7-day free trial. This trial lets you connect your wallets, analyze their performance, and uncover strategies from high-performing wallets in the market.
Make the most of the trial by setting up Telegram Alerts to stay informed about major wallet activities as they happen. Use the platform’s data export features to create your own analysis workflows and maintain organized records for tax purposes. Whether you opt for the Basic Plan to discover wallets and analyze trades or upgrade to the Premium Plan for advanced features like custom graphs and filters, you’ll gain the tools needed to make smarter, data-driven trading decisions.
Your path to better DeFi portfolio management begins with that first step toward unified tracking and advanced analytics. Take control of your investments today.
The article addresses security and privacy practices and tax record-keeping as the risk management components of multi-wallet DeFi portfolio tracking, but does not address the portfolio-level financial risk management practices that determine whether a multi-wallet setup is operating within safe concentration and correlation limits or whether it is accumulating correlated risks across multiple wallets that appear diversified on the surface but would all decline simultaneously during adverse market conditions. Advanced multi-wallet risk management for DeFi portfolios requires three interconnected frameworks: concentration limit enforcement that prevents over-allocation to any single token, protocol, or chain across all wallets combined; correlation monitoring that identifies when multiple wallets are building positions in assets that move together despite appearing diversified; and drawdown circuit breakers that automatically trigger review and potential de-risking when portfolio equity declines beyond defined thresholds.
Consolidated concentration measurement is the foundational risk management calculation for multi-wallet portfolios because individual wallet concentration limits that appear reasonable in isolation can combine across wallets to create dangerous aggregate exposure. A trader with four wallets who has set a 20 percent single-token concentration limit in each wallet could theoretically hold 20 percent of each wallet in the same token, resulting in a 20 percent aggregate concentration in that token if all four wallets are the same size, which appears to respect position limits at the wallet level while actually replicating the same concentrated single-wallet risk that the limits were intended to prevent. Consolidated concentration measurement aggregates holdings of each token across all wallets into a single portfolio-level percentage, which is the only exposure measurement that correctly captures the total risk.
Protocol concentration limits extend token-level concentration analysis to measure total capital exposure to any single DeFi protocol across all wallets and all interaction types including direct token holdings, liquidity provision in protocol pools, yield farming in protocol vaults, and governance token positions. A portfolio that holds a protocol's native token in wallet one, has provided liquidity in the protocol's primary trading pair in wallet two, and is farming yield through the protocol's incentive program in wallet three has three separate economic exposures that all depend on the continued solvency and security of the same smart contract system. A smart contract exploit, governance attack, or liquidity crisis affecting that protocol would simultaneously impair all three positions despite their appearing as separate line items across different wallets.
Cross-wallet correlation matrix measures the pairwise return correlations between all token holdings across all wallets over a specified trailing period, which reveals the true diversification level of the multi-wallet portfolio independent of the apparent asset count. A portfolio holding 25 different tokens across 5 wallets might appear well-diversified on a position count basis while actually having 20 of those 25 tokens with pairwise return correlations above 0.7, which means the portfolio will behave like a concentrated position in a single asset class during market stress events when correlations typically increase toward 1.0.
Narrative sector correlation clustering identifies which tokens in the portfolio belong to the same narrative theme or technical sector, because tokens within the same sector consistently show higher return correlations than tokens across different sectors even when their individual risk metrics appear distinct. Meme tokens on the same chain correlate highly with each other regardless of their individual themes. Layer-2 infrastructure tokens correlate with each other and with Ethereum more strongly than with Solana-native tokens. AI narrative tokens move together regardless of the underlying protocol's technical merits. Identifying which sectors are represented in the portfolio and whether the portfolio's token count represents genuine cross-sector diversification or concentrated same-sector exposure expressed through multiple tokens determines whether the portfolio's apparent diversification provides real risk reduction.
Correlation regime monitoring tracks how pairwise correlations between portfolio holdings change through different market conditions, because correlations in crypto markets are strongly regime-dependent. During normal market conditions, different narrative sectors may show moderate correlations of 0.3 to 0.5, suggesting meaningful diversification benefit across sectors. During broad market selloffs driven by macro catalysts, Bitcoin ETF outflows, or regulatory news, correlations between all crypto assets typically spike toward 0.85 to 0.95, effectively eliminating diversification benefit at exactly the moment when it is most needed. A multi-wallet portfolio that appears adequately diversified based on normal-period correlations may provide very little actual drawdown protection during market stress events if all holdings are crypto-native assets with high stress-period correlations.
Drawdown circuit breaker is a pre-defined rule that automatically triggers a mandatory portfolio review and potential de-risking action when total portfolio equity across all wallets declines by a specified percentage from its most recent peak value within a defined measurement window. The purpose of the circuit breaker is to prevent the behavioral trap of continuing to add risk or maintain existing positions during an extended drawdown in the hope of recovering losses, which is the pattern that converts manageable drawdowns into catastrophic capital destruction. A circuit breaker removes the in-the-moment decision from the trader by establishing in advance that specific drawdown thresholds require specific responses, executed regardless of the trader's current view of market prospects.
Tiered circuit breaker architecture implements multiple response levels at increasing drawdown magnitudes, with each tier triggering a more significant risk reduction action. A three-tier architecture might specify that a 15 percent portfolio drawdown from peak triggers mandatory review of all positions and removal of the three largest losing positions, a 25 percent drawdown triggers reduction of all position sizes to 50 percent of normal allocations and suspension of new position entry, and a 35 percent drawdown triggers full portfolio liquidation to stablecoin holdings pending a minimum 7-day cooling-off period and strategy review before any re-entry. The specific thresholds and response actions should be determined by the portfolio's historical volatility profile, with higher-volatility portfolios requiring wider circuit breaker thresholds to avoid triggering during normal volatility oscillations.
Recovery protocol defines the conditions and process for re-entering positions after a circuit breaker has been triggered, which is as important as the circuit breaker itself because undisciplined re-entry immediately after a risk reduction event recreates the same exposure that was just reduced. A recovery protocol specifies a minimum waiting period after circuit breaker activation before any new position entry, a maximum re-entry size relative to the position sizes held before the circuit breaker triggered, confirmation criteria that must be met before each re-entry tier is unlocked such as portfolio equity recovering above specified thresholds or market conditions stabilizing above defined metrics, and documentation requirements that force the trader to explicitly record the strategic rationale for each re-entry rather than allowing automatic drift back to prior positions.
Wallet Finder.ai puts your security first by utilizing encrypted connections and ensuring that private keys or sensitive crypto data are never stored. The platform only keeps essential details, like your login credentials and survey responses, securely within Amazon AWS Cognito data centers based in the United States.
This approach guarantees your wallet data stays private and secure, allowing you to track and analyze your DeFi investments effortlessly across multiple wallets.
Real-time alerts are a game-changer for managing your DeFi portfolio. They provide instant updates on important market activities, so you don’t have to spend hours glued to your screen. Whether it’s a token purchase, swap, or sale from a specific wallet, these alerts allow you to act swiftly and make informed decisions.
With WalletFinder.ai, this process gets even easier. Their Telegram Alerts Bot sends these updates straight to your device, ensuring you never miss crucial trading events. This tool helps you stay on top of market shifts, enabling faster reactions and smarter strategies to improve your trading outcomes.
While WalletFinder.ai doesn’t currently offer dedicated tax reporting features, it does provide powerful tools to monitor wallet performance, analyze trading behaviors, and export data. These features can help you gather and organize information that may be useful for tax preparation. For comprehensive tax reporting, it’s a good idea to work with a tax professional or pair WalletFinder.ai’s insights with specialized cryptocurrency tax software.
Concentration risk in multi-wallet DeFi portfolios must be measured at the aggregate portfolio level rather than the individual wallet level, because wallet-level position limits that appear conservative in isolation can combine across wallets to create the same concentrated risk that the limits were designed to prevent. The first step is computing consolidated concentration percentages for every token, protocol, and chain across all wallets simultaneously, which means summing each token's dollar value across all wallets and dividing by total portfolio value. A 20 percent single-token limit enforced per wallet allows theoretical 20 percent aggregate exposure to the same token if all wallets are the same size, reproducing single-wallet concentration risk across the entire portfolio.
Protocol concentration requires aggregating all economic exposure to any single smart contract system, including direct token holdings, liquidity provision positions, yield farming vault deposits, and governance token allocations across all wallets. A protocol exploit or governance attack simultaneously impairs all of these exposure types regardless of which wallet holds them, making aggregate protocol exposure the relevant risk unit. Narrative sector correlation clustering identifies which tokens move together due to shared sector membership, because 25 tokens across 5 wallets provides genuine diversification only if the tokens are distributed across sectors with low inter-sector correlations. Twenty tokens in the same sector with high pairwise correlations behave like a concentrated single-sector bet during market stress events when sector correlations spike toward 1.0. Drawdown circuit breakers automate de-risking at predefined thresholds: a tiered architecture triggering mandatory review at 15 percent drawdown from peak, position size reduction at 25 percent, and full stablecoin conversion at 35 percent prevents the behavioral trap of maintaining or adding risk through extended drawdowns in the hope of recovery, which is the pattern that converts manageable drawdowns into catastrophic capital loss.
Cross-chain capital efficiency ratio is calculated by dividing each chain's attribution-weighted PnL contribution percentage by that chain's capital deployment percentage over the same period, producing a single number that expresses how much return is being generated per unit of capital deployed on each network. A portfolio deploying 60 percent of capital on Ethereum that accounts for 40 percent of total PnL has an Ethereum capital efficiency ratio of 0.67, meaning each dollar deployed on Ethereum generates 67 cents of proportional return contribution. A portfolio deploying 25 percent of capital on Solana that accounts for 45 percent of total PnL has a Solana capital efficiency ratio of 1.8, meaning each dollar deployed on Solana generates 180 cents of proportional return contribution. The ratio comparison immediately reveals that Solana is generating return per deployed dollar at 2.7 times the rate of Ethereum in this example, which is a clear capital allocation signal that consolidated portfolio views obscure.
Bridge cost drag adjusts the capital efficiency calculation by subtracting the total cost of cross-chain capital movements including bridge fees, source and destination transaction fees, and time-value cost during transit from the returns generated by the receiving chain after the transfer. Frequent cross-chain rebalancing based on opportunity identification incurs bridge costs that may consume 3 to 8 percent of transferred capital per round trip, which erodes the apparent capital efficiency advantage identified in the raw comparison. Strategy-level attribution completes the allocation framework by classifying activity on each chain into categories including spot trading, liquidity provision, yield farming, and staking, and measuring the return contribution from each category independently. A chain showing high capital efficiency may be attributable entirely to one strategy category while other strategies on the same chain detract from performance, which refines the allocation signal from "deploy more capital to this chain" to "deploy more capital to this specific strategy on this chain while reducing or closing the underperforming strategy categories.

A premier DeFi analytics platform empowering traders to discover and analyze profitable blockchain wallets, trades and tokens.

