
Recovery Factor Calculation for Smart Traders
Master the recovery factor calculation to measure a strategy's resilience. Learn the formula, see DeFi examples, and find top wallets with Wallet Finder.ai.

June 20, 2026


Wallet Finder
November 20, 2025
Tracking wallets in blockchain just got easier. The world of decentralized finance (DeFi) is growing fast, but keeping up with wallet activity across different blockchains is tough. Tools like 3D blockchain visualization and platforms such as Wallet Finder.ai are changing how users analyze and monitor wallets. Here's why this matters:
These tools simplify tracking, improve decision-making, and help traders stay ahead in a fast-moving market.
The tools available for tracking blockchain activity often fall short due to the sheer scale and complexity of blockchain data. Traditional data analytics systems were built for structured data in relational databases, but blockchain data operates very differently. This mismatch creates major hurdles when it comes to monitoring wallets effectively. For example, synchronizing an Ethereum full node as of March 7, 2025, requires approximately 21,358 GB of storage. Solana's blockchain ledger has also grown significantly, surpassing 150 TB by early 2024. These massive data volumes make tracking wallet activity a real challenge.
Most 2D dashboards only show static details like wallet holdings and basic charts. To dig deeper, users often have to click through multiple screens, which is time-consuming and inefficient. Blockchain data is also encoded, meaning analysts have to spend hours decoding and manually processing it to get meaningful insights. This process not only wastes time but also prevents users from leveraging automation to streamline their work.
On top of these manual tracking issues, these tools struggle to uncover deeper patterns in transaction data.
Another major limitation of current tools is their inability to reveal hidden transaction flows. Complex wallet and transaction relationships are often left unmapped, making it hard to gain a clear understanding of how funds move and interact across the blockchain.
This challenge is further complicated by deliberate efforts to obscure transaction trails. Cybercriminals increasingly rely on services like cryptocurrency mixers and tumblers to make their transactions harder to trace. Privacy-focused cryptocurrencies such as Monero, Zcash, and Dash are also gaining popularity for their ability to hide transaction details. In 2023 alone, illicit blockchain addresses received a staggering $24.2 billion, highlighting the scale of hidden activity.
The Colonial Pipeline ransomware attack is a striking example of these challenges. The DarkSide ransomware group demanded 75 Bitcoin (around $4.3 million at the time). Although law enforcement managed to trace the funds and recover $2.3 million, this required meticulous tracking of transactions to wallets eventually linked to the attackers.
Ervin Zubic, Founder of blockquiry, sheds light on the process:
"Banks are typically called the 'on-road and off-road' of virtual value exchange transactions, meaning that if an investigator can build a strong enough case by following the blockchain and overcoming regional or jurisdictional hurdles, they could use subpoena powers to investigate, seize, and freeze assets in the real world."
The anonymity and pseudonymity built into blockchain technology make it even harder to identify patterns. Unlike traditional financial systems with centralized oversight, decentralized networks lack the tools to accurately map wallet relationships. Moreover, traditional methods struggle to provide real-time insights. Static dashboards don’t offer the dynamic information needed in fast-moving markets, where the total value locked in DeFi protocols exceeded $50 billion by mid-2024. Traders need actionable, real-time data to seize opportunities or mitigate risks - something current tools just can’t deliver.
Traditional 2D dashboards often fall short when it comes to analyzing complex blockchain data. That’s where 3D blockchain tools come in, offering a whole new way to visualize wallet activity. These tools turn intricate transaction data into interactive, three-dimensional experiences, making it easier to understand and act on the information. Let’s dive into how this shift is changing the game, and explore Temporal Patterns in Crypto Transactions to gain even deeper insights.
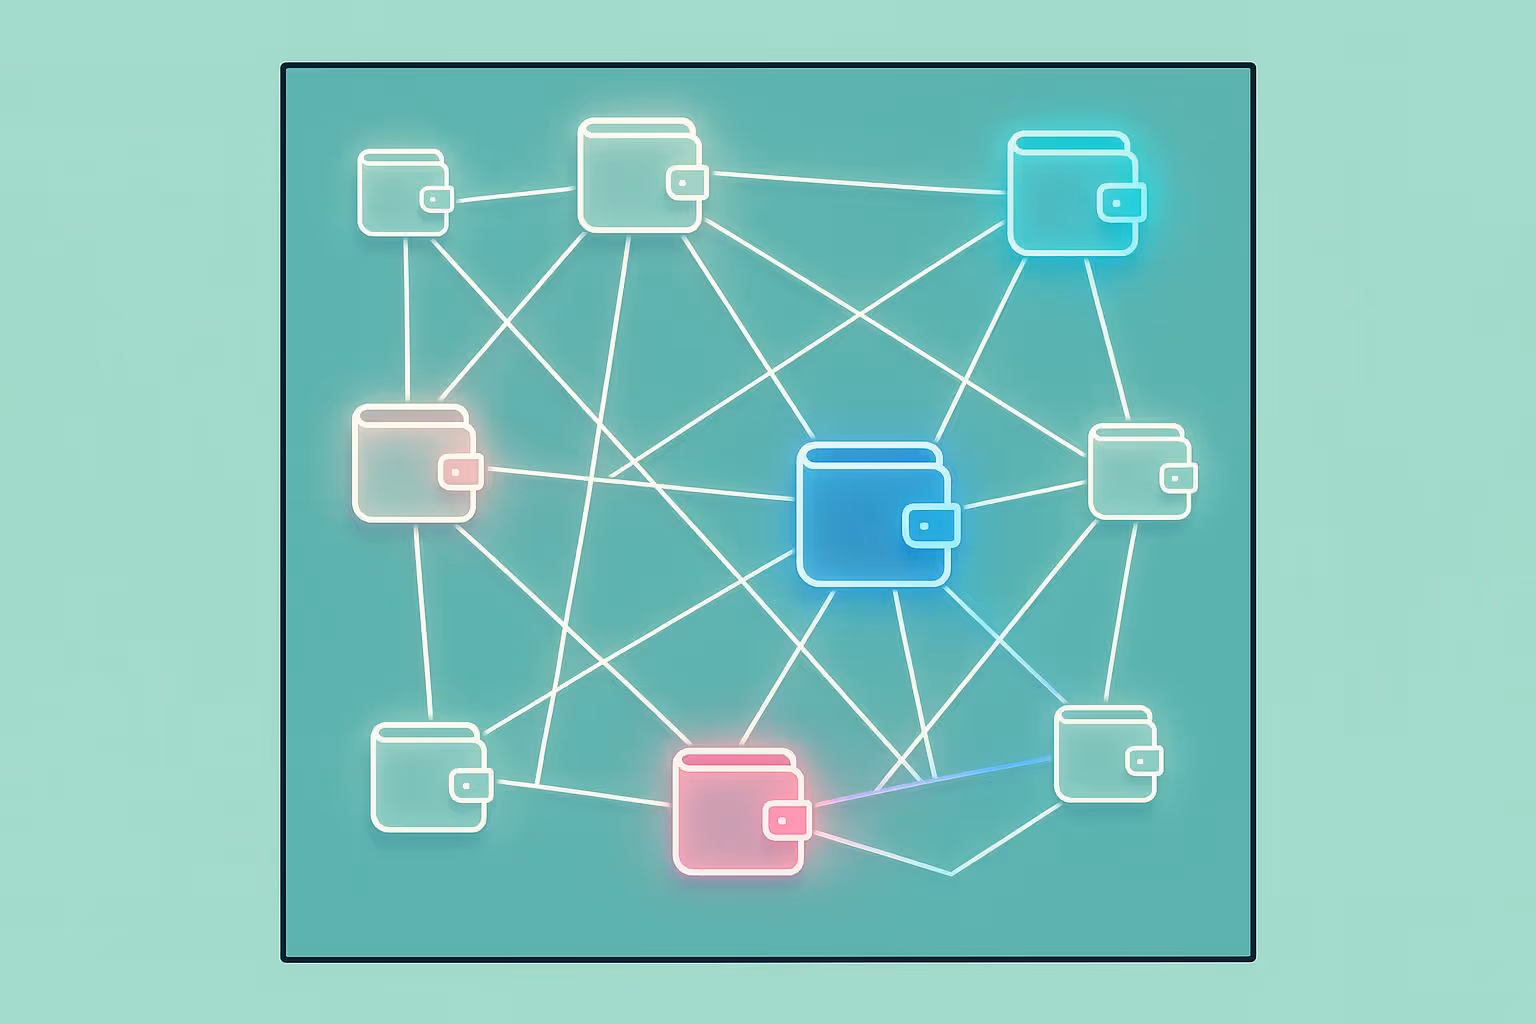
At its core, 3D blockchain visualization uses node-link diagrams and spatial mapping to represent blockchain data. Wallet addresses are shown as nodes, while transactions are depicted as connecting lines in a 3D space. Unlike static tables or simple charts found in 2D dashboards, these tools create immersive environments that let you explore transaction networks as if navigating a digital map.
The Crystal investigations team highlights the main advantage of this approach:
"Blockchain visualization tools provide an efficient way of understanding on-chain activity and uncovering hidden relationships, anomalies, and trends from blockchain data. With these visualization tools, you enjoy enhanced transparency across blockchain networks and easily generate meaningful insights for your business processes."
– Crystal investigations team
Research also backs this up, noting that immersive Virtual Reality (VR) can "maximize intrinsic human pattern recognition and discovery skills". Simply put, our brains are wired to spot patterns better when data is presented in three dimensions. To see how clustering techniques can highlight groups of consistently successful traders, read our post on Cluster Analysis of Profitable Wallets.
In practice, blockchain data is visualized as interconnected graphs. Wallets appear as nodes, with transaction amounts shown through varying line thickness, and node sizes reflecting wallet balances or activity levels. Time-based animations add another layer, showing how funds move dynamically, giving analysts a more complete picture of blockchain activity.
The ability to view blockchain data in 3D transforms how analysts identify transaction flows and wallet relationships. Clicking on a specific wallet or transaction can reveal its connections, creating a web of activity that would be hard to interpret in a traditional spreadsheet. Time-based animations further enhance this by showing how funds move across wallets over time.
Features like automated layouts, dynamic node sizing, and grouping tools make it easier to spot key entities and detect suspicious activity. Suspicious clusters of addresses, for example, become much more obvious in a 3D view. Additional tools like custom styling, tooltips, and smooth animations keep users focused and provide context during analysis.
The insights gained from 3D blockchain tools aren’t just theoretical - they have real-world applications that are reshaping wallet tracking. For instance, investigators can create 3D "fly-through" videos to document their findings, making it easier to explain complex transaction flows. Compliance teams benefit from real-time fund tracing, which simplifies mapping suspicious activities for regulatory reporting.
DeFi traders can also take advantage of these tools. Using 3D and VR visualizations, they can spot patterns like clusters of coordinated activity, giving them a competitive edge. Real-time data visualization helps organizations monitor key metrics and make quick, informed decisions, which is crucial in fast-paced markets.
For DeFi traders, having tools that combine advanced analytics with actionable insights is key. Wallet Finder.ai steps in to fill this need, offering blockchain analytics that uncover profitable opportunities across networks like Ethereum, Solana, and Base. With data loading times of less than two seconds, the platform provides wallet scanning, token trade discovery, and analytics dashboards without the usual delays tied to blockchain data processing. This seamless integration turns complex visual data into practical trading strategies, making Wallet Finder.ai a valuable ally for traders.
Wallet Finder.ai makes it easy to pinpoint top-performing wallets across various blockchains. Traders can filter wallets by profit margins, tokens, and trading stats, while detailed investment charts highlight entry points and timing trends. The platform even lets users dive into the "trading DNA" of wallets with consistent success. By tracking complete wallet histories, with an average return rate of 340%, Wallet Finder.ai provides access to tried-and-true trading strategies.
Pablo Massa, a seasoned DeFi trader, shared his thoughts on the platform:
"I've tried the beta version of Walletfinder.ai extensively and I was blown away by how you can filter through the data, and the massive profitable wallets available in the filter presets, offers a decisive advantage for traders."
The platform doesn’t just track profits - it also provides in-depth wallet histories, complete with investment-versus-profit charts. These charts reveal not only what successful traders have bought but also when and how much they invested.
Wallet Finder.ai goes beyond basic tracking by allowing users to customize their analysis. Traders can filter and sort data based on specific metrics and performance indicators. Flexible data exporting options, like saving files in Excel or CSV formats, make it easier for users to conduct offline analysis and refine their strategies. Additionally, the platform supports personalized watchlists for tracking high-performing wallets and allows users to link their own wallets. This feature helps traders evaluate their strategies against the best in the market.
These customization options simplify data review, giving traders a head start when reacting to market changes.
In the fast-paced world of DeFi trading, timing is everything. Wallet Finder.ai addresses this with instant buy/sell alerts sent directly through Telegram. By adding preferred wallets to the Telegram Alerts Bot, users get immediate updates whenever those wallets make a move - whether it’s a buy, swap, or sell. This feature turns wallet tracking into a proactive tool for staying ahead in the market.
The platform also continuously scans wallets across supported blockchains, ensuring users stay informed about significant activity. Combined with transparent analytics and automated token-security checks, these features help traders minimize risks while making faster, more informed decisions.
With subscription plans starting at $37 per month and discounts for longer commitments, Wallet Finder.ai offers serious DeFi traders an affordable way to access advanced analytics.
3D blockchain visualization tools bring a fresh perspective to tracking and analyzing blockchain activity. They offer a significant edge over traditional methods, especially in improving clarity and uncovering patterns. The Crystal investigations team highlights:
"Blockchain visualization tools provide an efficient way of understanding on-chain activity and uncovering hidden relationships, anomalies, and trends from blockchain data".
With $8.6 billion in cryptocurrency laundered in 2021 - marking a 30% rise from the year before - these tools play a critical role in identifying suspicious activity and tracing funds across blockchain networks.
These tools also improve regulatory compliance by offering detailed insights that standard 2D dashboards often miss. Investigators can zoom in on individual transactions or zoom out to examine entire networks, thanks to the multi-dimensional capabilities of these tools. Features like multi-wallet AR tracking simplify crypto accounting by consolidating assets into a single dashboard, boosting accuracy and saving time. These advancements are reshaping how wallet tracking and blockchain analysis are handled, as seen with tools like Wallet Finder.ai.
While 3D visualization tools offer plenty of promise, they also come with hurdles. One major issue is data accessibility. Blockchain data is often raw and unstructured, requiring extensive processing to make it usable. Scalability is another challenge, as blockchain networks generate enormous amounts of data that need significant storage capacity.
Data accuracy can also be tricky. Problems like duplicate data, errors in smart contracts, and incomplete transaction records can create inconsistencies. The anonymous nature of blockchain wallets can further complicate things, leading to potential biases in user-generated queries. On top of that, the fragmented nature of blockchain networks - with each operating under its own rules and protocols - makes seamless cross-chain visualization difficult, often requiring multiple tools. Finally, the high computational demands of 3D visualizations mean that smaller organizations or individual users may find the hardware requirements too steep.
Here’s a side-by-side look at how 3D visualization tools measure up against traditional 2D methods:
Identifies hidden relationships and anomalies across dimensions
Limited to surface-level patterns in flat dashboards
Allows analysis from single transactions to entire networks
Focuses on one level at a time
Provides a unified view across networks (with some limitations)
Requires separate tools for each network
Needs more computational resources and time
Faster with lower resource demands
Complex interfaces require more training
Easier onboarding with familiar 2D layouts
Better at spotting anomalies and suspicious activity
Basic detection through standard charts
May lag due to complex rendering
Faster updates with simpler visuals
Requires advanced hardware for processing
Works on standard computing setups
The move from flat 2D dashboards to 3D blockchain visualization tools is a game-changer for understanding and tracking wallet activity. Blockchain analytics takes raw data and turns it into practical insights. With the fast-paced world of DeFi, having reliable tracking tools is more important than ever. This shift is paving the way for a more connected and insightful trading experience.
3D visualization tools uncover patterns and connections that older methods often miss. These tools simplify the process of tracking funds across complex blockchain networks, identifying transaction trends, and spotting new trading opportunities. For example, Crystal’s technology has analyzed over 90,000 contracts and flagged nearly 3 million vulnerabilities, including over 150,000 critical security issues.
For traders and investors in DeFi, Wallet Finder.ai brings clarity to complicated wallet histories. It offers actionable insights, alerts users about whale activity in advance, and lets them create custom watchlists of top-performing wallets.
Real-time 3D tools, like Wallet Finder.ai’s Telegram alerts, keep traders updated on important wallet movements instantly. Its advanced filtering features also help users discover effective trading strategies across major blockchains like Ethereum, Solana, and Base.
Looking forward, technologies like augmented reality (AR) and "Super Apps" are expected to make wallet tracking even more user-friendly. These tools will offer personalized dashboards and innovative alert systems, making it easier to visualize complex transaction data in ways we haven’t seen before.
In the rapidly evolving DeFi space, the advantages of 3D tools are clear. While traditional 2D methods can leave gaps in information, 3D blockchain tools provide a detailed and interactive perspective. By turning scattered blockchain data into dynamic, easy-to-understand visuals, these tools help traders make quicker and smarter decisions. In such a fast-moving industry, tools that can efficiently analyze and alert users to profitable opportunities are not just helpful - they’re essential. Wallet Finder.ai stands out as a prime example, combining advanced 3D visualization with real-time insights to change the way wallet tracking works in DeFi.
3D blockchain tools make tracking complex transaction patterns much easier by using interactive, immersive visualizations that are far more engaging than standard 2D dashboards. These tools let users dive into blockchain activity in a three-dimensional space, helping them uncover hidden links, irregular patterns, and transaction flows that might be hard to detect otherwise.
By showcasing data in 3D, analysts can grasp complicated relationships and spot unusual activity within transaction networks more effectively. This added depth is particularly helpful for understanding the intricate nature of blockchain systems and pinpointing key insights with greater clarity.
3D blockchain visualization tools bring a whole new way of understanding blockchain data, making it easier for both DeFi traders and compliance teams to navigate complex information. Instead of sifting through endless rows of data, these tools let users visually follow transaction flows, keep an eye on smart contract activities, and spot patterns that might otherwise go unnoticed.
For DeFi traders, this means they can find trading opportunities, study market behaviors, and stay ahead of trends with greater clarity. On the other hand, compliance teams can use these tools to pinpoint suspicious activities, track down questionable transactions, and ensure everything aligns with regulations. By turning dense blockchain data into something clear and actionable, these tools help users make smarter decisions and work more efficiently.
Using 3D blockchain visualization tools isn’t always smooth sailing. Common hurdles include high energy usage, scalability issues, and difficult integration processes. These challenges can sometimes hold users back from making the most of these tools.
To overcome these obstacles, users can explore energy-saving technologies, consider scalable options like Layer-2 protocols, and choose platforms with simple, user-friendly designs. On top of that, putting effort into learning resources and seeking support can help close knowledge gaps, making these tools much easier to navigate.
{"@context":"https://schema.org","@type":"FAQPage","mainEntity":[{"@type":"Question","name":"How do 3D blockchain tools make it easier to track complex transaction patterns?","acceptedAnswer":{"@type":"Answer","text":"<p>3D blockchain tools make tracking complex transaction patterns much easier by using <strong>interactive, immersive visualizations</strong> that are far more engaging than standard 2D dashboards. These tools let users dive into blockchain activity in a three-dimensional space, helping them uncover <strong>hidden links, irregular patterns, and transaction flows</strong> that might be hard to detect otherwise.</p> <p>By showcasing data in 3D, analysts can grasp complicated relationships and spot unusual activity within transaction networks more effectively. This added depth is particularly helpful for understanding the intricate nature of blockchain systems and pinpointing key insights with greater clarity.</p>"}},{"@type":"Question","name":"How can 3D blockchain visualization tools benefit DeFi traders and compliance teams?","acceptedAnswer":{"@type":"Answer","text":"<p>3D blockchain visualization tools bring a whole new way of understanding blockchain data, making it easier for both <strong>DeFi traders</strong> and <strong>compliance teams</strong> to navigate complex information. Instead of sifting through endless rows of data, these tools let users visually follow transaction flows, keep an eye on smart contract activities, and spot patterns that might otherwise go unnoticed.</p> <p>For <strong>DeFi traders</strong>, this means they can find trading opportunities, study market behaviors, and stay ahead of trends with greater clarity. On the other hand, <strong>compliance teams</strong> can use these tools to pinpoint suspicious activities, track down questionable transactions, and ensure everything aligns with regulations. By turning dense blockchain data into something clear and actionable, these tools help users make smarter decisions and work more efficiently.</p>"}},{"@type":"Question","name":"What are the common challenges of using 3D blockchain tools, and how can users address them?","acceptedAnswer":{"@type":"Answer","text":"<p>Using 3D blockchain visualization tools isn’t always smooth sailing. Common hurdles include <strong>high energy usage</strong>, <strong>scalability issues</strong>, and <strong>difficult integration processes</strong>. These challenges can sometimes hold users back from making the most of these tools.</p> <p>To overcome these obstacles, users can explore <strong>energy-saving technologies</strong>, consider <strong>scalable options like Layer-2 protocols</strong>, and choose platforms with <strong>simple, user-friendly designs</strong>. On top of that, putting effort into learning resources and seeking support can help close knowledge gaps, making these tools much easier to navigate.</p>"}}]}

A premier DeFi analytics platform empowering traders to discover and analyze profitable blockchain wallets, trades and tokens.

