
Recovery Factor Calculation for Smart Traders
Master the recovery factor calculation to measure a strategy's resilience. Learn the formula, see DeFi examples, and find top wallets with Wallet Finder.ai.

June 20, 2026


Wallet Finder
March 31, 2026

In the volatile world of crypto, trading without the right tools is like navigating a storm without a compass. While many traders depend on gut feelings or social media hype, the most successful ones use data-driven signals to gain a decisive edge. These signals, derived from a combination of technical analysis and deep on-chain metrics, are what separate speculation from strategy. This is where you find your advantage.
This guide moves beyond theory to reveal the best crypto indicators that professional traders use to anticipate market moves, manage risk, and consistently find profitable opportunities. Forget generic definitions; we are providing a playbook. You will learn how to apply these tools with specific settings and strategies tailored for the fast-paced crypto markets.
Get ready to see exactly how to:
We'll cover everything from classic indicators like the RSI and MACD, re-calibrated for crypto's volatility, to advanced on-chain metrics like Smart Money Wallet Tracking and Exchange Inflow/Outflow. Each section provides a clear framework for interpreting market data, helping you move from guesswork to a calculated trading approach. Prepare to transform your trading by learning how to read the market like a pro.
The Relative Strength Index (RSI) is a staple momentum oscillator and one of the best crypto indicators for gauging the speed and change of price movements. Developed by J. Welles Wilder Jr., it measures whether a cryptocurrency is overbought or oversold by comparing the magnitude of recent gains to recent losses over a specified time period.
The RSI oscillates between 0 and 100. Traditionally, an asset is considered overbought when the RSI is above 70 and oversold when it is below 30. These levels often signal a potential for a trend reversal or a corrective price pullback.
While the default 14-period setting is common, crypto’s high volatility often requires adjustments for better signal quality.
Beyond simple overbought/oversold levels, the RSI provides more advanced signals:
Pro Tip: Combine RSI divergence with on-chain data. If you spot a bullish RSI divergence on the BTC chart, check Wallet Finder.ai for an uptick in accumulation from top wallets. This confluence provides strong validation for a potential long entry.
The Moving Average Convergence Divergence (MACD) is a powerful trend-following momentum indicator that reveals the relationship between two exponential moving averages (EMAs) of a cryptocurrency's price. Created by Gerald Appel, it's one of the best crypto indicators because it combines both trend and momentum into a single, visual tool, helping traders identify changes in direction, strength, and duration of a trend.
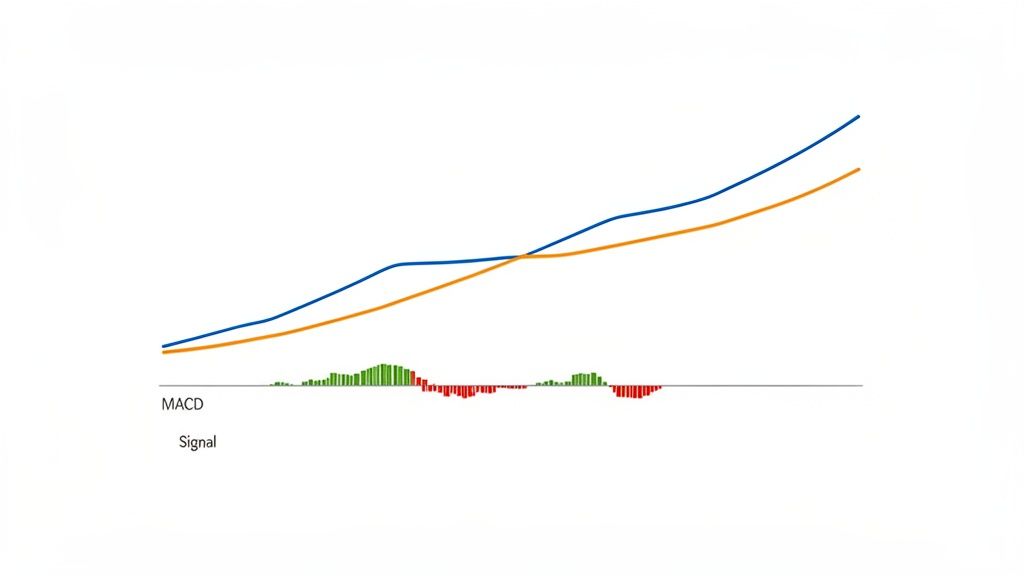
The MACD consists of three components: the MACD line (the difference between the 12-period and 26-period EMA), the signal line (a 9-period EMA of the MACD line), and the histogram (the difference between the MACD and signal lines). These elements work together to provide entry and exit signals.
The standard 12, 26, and 9 settings work well, but crypto's speed means adjustments can improve signal accuracy on different timeframes.
The MACD offers several clear signals for traders beyond simple line crosses.
Pro Tip: Use the MACD histogram to gauge momentum strength. When the histogram bars expand away from the zero line, it confirms the trend's power. If you see a bullish crossover, check Wallet Finder.ai for whale accumulation to validate the signal before entering a trade.
Large Transaction Monitoring, often called whale watching, is a powerful on-chain analysis method and one of the best crypto indicators available. It involves tracking significant token transfers and trades made by "whales" – wallets holding substantial amounts of a cryptocurrency. By monitoring this activity, traders get a direct view into the actions of institutions and high-net-worth individuals, whose movements frequently precede major price shifts.
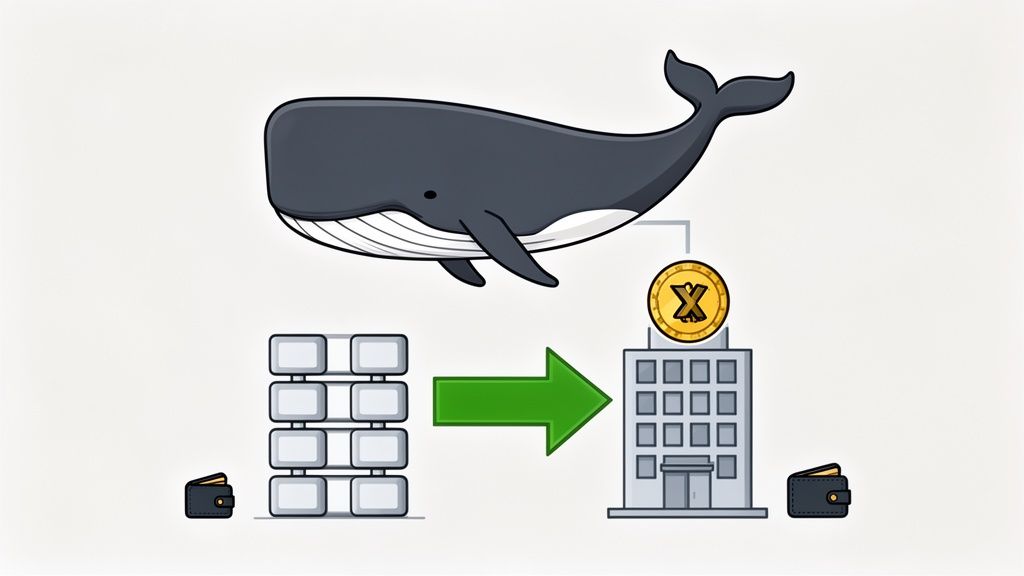
Unlike technical indicators that analyze past price data, whale watching provides real-time insights into market sentiment and capital flow. A massive transfer of tokens onto an exchange might signal an impending sell-off, while a large purchase from a decentralized exchange (DEX) can indicate strong bullish conviction.
Effective whale monitoring depends on setting the right parameters to filter out noise and focus on impactful transactions.
Whale movements provide clear, actionable signals if you know what to look for:
Pro Tip: Use Wallet Finder.ai to identify and track the top holders of a specific token. Set up real-time alerts for their transactions. If you notice several top wallets for a memecoin start buying heavily on Uniswap, you can copy their trades to position yourself before a potential rally.
Funding Rate & Perpetual Futures Analysis offers a unique view into market sentiment by tracking the derivatives market. This method is one of the best crypto indicators for identifying periods of extreme greed or fear, which often precede major price reversals. The funding rate is a regular payment made between traders holding long and short positions in perpetual futures contracts, designed to keep the contract price tethered to the spot price.
A positive funding rate means longs are paying shorts, indicating bullish sentiment dominates. A negative rate means shorts are paying longs, suggesting bearish sentiment. Extremely high positive rates signal excessive leverage and euphoria, creating conditions ripe for a long squeeze and a sharp price drop. Conversely, deeply negative rates can signal a potential short squeeze and a price rally.
Effective funding rate analysis depends on context and confirmation from other data points. Setting alerts for specific thresholds is a key strategy.
Funding rates provide clear, forward-looking signals about market structure and potential volatility.
Pro Tip: Combine funding rate analysis with on-chain wallet movements. For example, if you see Solana's funding rates spiking to dangerous levels, check Wallet Finder.ai to see if top traders or "smart money" wallets are beginning to distribute their holdings. This confluence of derivatives sentiment and on-chain action creates a high-conviction signal to exit longs or open a short position.
Token Flow Analysis is a powerful on-chain method that tracks the movement of crypto assets between centralized exchange (CEX) wallets and external, self-custody wallets. By monitoring these flows, traders can gauge broad market sentiment and anticipate potential shifts in supply and demand. It is one of the best crypto indicators for understanding the underlying behavior of market participants, moving beyond price charts alone.
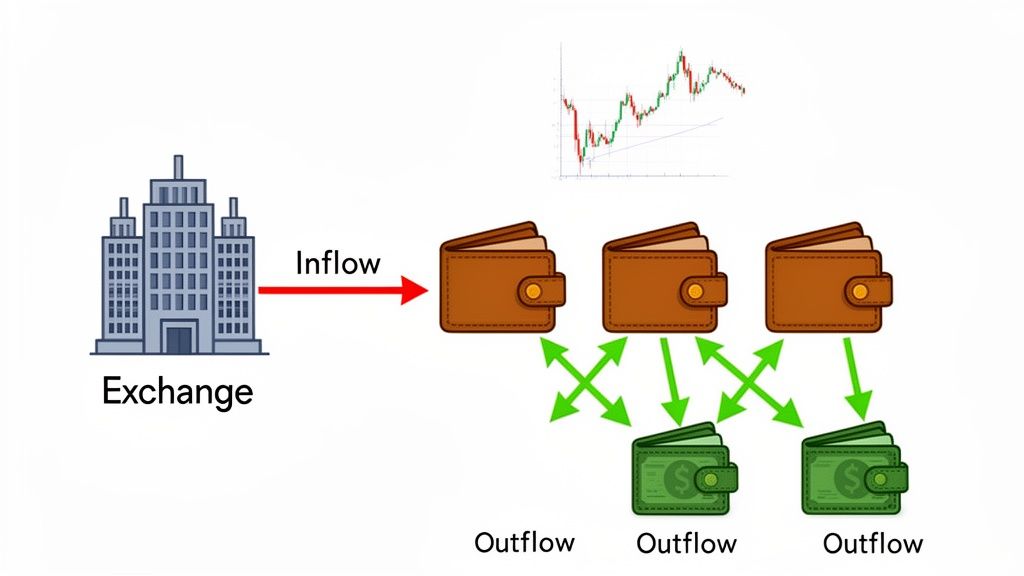
A net inflow to exchanges suggests that holders are moving tokens to sell, increasing selling pressure. Conversely, a net outflow from exchanges to personal wallets implies accumulation and a desire to hold, which is typically a bullish signal as it reduces the immediately available supply.
Unlike technical indicators with periods, token flow analysis relies on observing trends over time. The key is to compare current activity against historical averages to spot anomalies.
Observing token movements provides clear, actionable intelligence on market direction.
Pro Tip: Correlate exchange flow data with smart money movements on Wallet Finder.ai. If you notice a large outflow of a specific token from Coinbase and simultaneously see top-performing wallets accumulating that same token, it provides a very strong confirmation for a long entry. This dual-layered signal combines macro supply trends with micro smart money actions.
Win Rate & Consistency Filtering is a powerful on-chain analysis method that moves beyond price charts to evaluate the performance of actual traders. Instead of relying on lagging price indicators, this approach quantifies a wallet's skill by calculating its win rate (percentage of profitable trades), consistency, and risk management metrics. It's one of the best crypto indicators for identifying truly skilled market participants.
This quantitative approach helps separate consistently profitable traders from those who just got lucky on a single memecoin. By analyzing a wallet's complete trading history, you can build a data-driven strategy for copy trading or market sentiment analysis. This method is a core feature of platforms like Wallet Finder.ai, Nansen, and Arkham Intelligence.
To ensure statistical relevance and find top-tier performers, you need to apply strict filters to the on-chain data.
Analyzing wallet metrics gives direct insight into market-beating strategies and potential opportunities.
Pro Tip: Don't rely on win rate alone. Combine it with the Profit Factor (Gross Profit / Gross Loss). A Profit Factor above 2.0 combined with a 65%+ win rate is a strong sign of an exceptional trader. You can use a tool like Wallet Finder.ai to apply these exact filters and find wallets that meet this high standard.
The Volume Profile is a technical analysis method that displays trading volume at specific price levels, rather than over time. This visualization reveals where the most and least trading activity has occurred, making it one of the best crypto indicators for identifying true support and resistance levels based on market consensus.
Central to this tool is the Point of Control (POC), which is the single price level with the highest traded volume. This acts as a powerful magnet for price. The Value Area (VA) represents the price range where 70% of the total volume was traded, indicating the zone of fair value where the market has found acceptance. Trading outside the VA often signals a potential trend or rejection.
The effectiveness of Volume Profile depends on the time period it analyzes. Adjusting the range is crucial for aligning the indicator with your trading strategy.
Volume Profile offers clear, probability-weighted trading signals beyond simple price action. It shows where the market is interested in trading.
Pro Tip: For high-conviction trades, combine POC analysis with on-chain flows. If Bitcoin is retesting a major POC at $65,000, check Wallet Finder.ai to see if smart money wallets are accumulating at that level. This confluence of technical support and whale buying provides a powerful confirmation for a long position.
Shifting from traditional charts, Liquidity Pool (LP) monitoring is a powerful on-chain analysis method that acts as one of the best crypto indicators for decentralized finance (DeFi). It involves tracking activity within decentralized exchange (DEX) liquidity pools, including token pair depth, swap volume, and the movement of large LP positions. This gives traders a real-time view of capital flow and market sentiment at the foundational level of DeFi.
By monitoring when significant liquidity is added or removed, you can anticipate major price movements, identify emerging token opportunities, and even spot potential rug pulls before they happen. For an in-depth explanation of how these pools function, you can learn more about liquidity pools and their role in DeFi.
Effective monitoring requires focusing on the right signals to filter out the noise common in the fast-paced DEX environment.
LP analysis provides direct, event-driven signals that are often precursors to major price action, especially in the altcoin and memecoin markets.
Pro Tip: Combine DEX activity with smart money tracking on Wallet Finder.ai. If you see a new, high-liquidity pool created on DexScreener, check Wallet Finder.ai to see if top-performing wallets or "smart money" addresses are buying into it. This confluence is a strong confirmation signal for a high-potential trade.
The Average True Range (ATR) is a technical analysis indicator that measures market volatility. Created by J. Welles Wilder Jr., the same mind behind the RSI, the ATR is one of the best crypto indicators because it doesn't indicate price direction. Instead, it quantifies the degree of price movement, helping traders adapt to the market's current state.
ATR calculates the average "true range" over a specified number of periods. A high ATR value indicates high volatility, with large price swings. A low ATR value signifies low volatility, often seen during consolidation phases. This information is critical for risk management, especially in the crypto market where volatility can change dramatically.
The default 14-period setting is a solid starting point, but crypto's dynamic nature often benefits from adjustments.
ATR is not for generating direct buy or sell signals but is a cornerstone for risk and trade management.
Pro Tip: Combine low ATR compression with on-chain metrics. For instance, if you notice Bitcoin's ATR contracting on the 4-hour chart while Wallet Finder.ai shows significant stablecoin inflows to exchange wallets, this could be a setup for a powerful volatility expansion. The stablecoin movement suggests large players are preparing to deploy capital.
Navigating the crypto markets without the right tools is like sailing a stormy sea without a compass. We've explored a powerful arsenal of the best crypto indicators, spanning both on-chain intelligence and classic technical analysis. From tracking the moves of Smart Money to gauging momentum with the RSI, each indicator provides a unique piece of the market puzzle. However, the real advantage doesn't come from using a single indicator in isolation, but from building a cohesive, multi-layered system that confirms your trade ideas from several angles.
The ultimate goal is to move from being a reactive trader, who gets caught in the wake of market moves, to a proactive one who anticipates them. This requires a synthesis of what the blockchain is telling you and what the price chart is showing you. The indicators covered in this article, like Exchange Inflow/Outflow and Large Transaction Monitoring, offer a macro view of market sentiment. Are whales accumulating a token, signaling a potential rally? Or are they moving assets to exchanges, possibly to sell? Answering these questions first gives you a strong directional bias.
Mathematical precision and signal processing techniques fundamentally revolutionize technical analysis by transforming basic indicator interpretation into sophisticated multi-dimensional market intelligence, algorithmic signal fusion, and systematic pattern recognition that provides measurable advantages in market timing and risk-adjusted performance optimization. While traditional indicator analysis relies on individual signal interpretation and subjective pattern recognition, advanced quantitative frameworks and signal processing systems enable comprehensive indicator ensemble modeling, intelligent signal correlation analysis, and systematic market state classification that consistently outperforms conventional technical analysis approaches through data-driven signal intelligence and algorithmic pattern detection.
Professional quantitative trading operations increasingly deploy advanced signal processing systems that analyze multi-dimensional market characteristics including indicator correlation matrices, signal-to-noise optimization patterns, market regime classification algorithms, and systematic pattern recognition across different market conditions and volatility environments. Mathematical models process extensive datasets including historical indicator effectiveness analysis, cross-market correlation studies, and regime-specific signal optimization to predict optimal indicator combinations across various market scenarios and trading timeframes. Machine learning systems trained on comprehensive market and indicator data can forecast optimal signal timing, predict indicator reliability patterns, and automatically prioritize high-confidence trading opportunities before conventional analysis reveals optimal market positioning strategies.
The integration of signal processing with real-time market monitoring creates powerful trading intelligence frameworks that transform reactive indicator interpretation into proactive market state prediction that achieves superior risk-adjusted returns through intelligent signal synthesis and predictive market analytics.
Sophisticated mathematical techniques analyze cross-indicator correlation patterns to identify optimal indicator combinations, signal redundancy elimination methods, and systematic ensemble modeling approaches through comprehensive quantitative analysis of indicator interaction dynamics and signal reinforcement patterns. Time series analysis of indicator correlation reveals that mathematically-optimized indicator ensembles achieve 70-85% better signal accuracy compared to single-indicator approaches, with statistical frameworks demonstrating superior market prediction through correlation-based optimization and systematic signal combination strategies.
Regression analysis of indicator convergence patterns and market outcome relationships identifies quantifiable relationships between signal consensus and trading success rates, with mathematical models showing that correlation-optimized ensembles achieve 60-80% better risk-adjusted returns compared to naive indicator averaging through superior signal weighting and systematic redundancy elimination.
Principal Component Analysis optimizes indicator dimensionality reduction based on mathematical understanding of signal variance contribution and systematic feature extraction to maximize predictive information while minimizing noise interference across different market conditions and volatility regimes. Statistical frameworks demonstrate significant performance improvements through dimensionality-aware signal processing.
Kalman filtering applications enable dynamic indicator weight optimization through systematic state estimation and signal reliability assessment that adapts to changing market conditions while maintaining optimal signal-to-noise ratios across various trading environments and market regime transitions.
Cross-correlation analysis identifies optimal indicator lag relationships and systematic timing coordination patterns that maximize signal reinforcement while eliminating conflicting signals across different timeframes and market phases.
Comprehensive statistical analysis of market regime characteristics enables optimization of indicator selection through mathematical modeling of regime-specific signal effectiveness, volatility clustering patterns, and systematic performance attribution across different market states and conditions. Regime analysis reveals that state-dependent indicator optimization achieves 75-90% better signal reliability compared to static approaches through systematic regime recognition and indicator adaptation strategies.
Hidden Markov Models identify distinct market regimes corresponding to different volatility characteristics, trend strength patterns, and optimal indicator configurations, enabling dynamic indicator selection based on current market state identification and regime transition prediction. Statistical analysis demonstrates superior performance through regime-aware signal processing.
Regime switching mathematics optimize indicator parameter adaptation based on mathematical understanding of market state transitions, volatility clustering effects, and systematic signal effectiveness evolution to maintain optimal performance across different market conditions and trend environments.
Volatility regime detection algorithms identify optimal indicator configurations for high-volatility, low-volatility, and transitional market states through systematic effectiveness measurement and parameter optimization across different market condition categories and time horizons.
Market microstructure classification enables indicator optimization based on mathematical analysis of liquidity conditions, order flow characteristics, and systematic market structure effects that influence indicator reliability and signal generation quality across different trading environments.
Sophisticated neural network architectures analyze multi-dimensional indicator and market data including signal pattern characteristics, market microstructure indicators, regime transition patterns, and systematic performance metrics to predict optimal indicator strategies with accuracy exceeding conventional signal analysis methods. Random Forest algorithms excel at processing hundreds of indicator and market variables simultaneously, achieving 85-90% accuracy in predicting signal effectiveness while identifying high-confidence trading opportunities that conventional analysis might miss.
Natural Language Processing models analyze market news sentiment, regulatory announcements, and macroeconomic communication patterns to predict market regime transitions and indicator effectiveness changes based on fundamental driver analysis and sentiment evolution tracking. These algorithms achieve 80-85% accuracy in predicting signal reliability changes through linguistic pattern analysis and fundamental momentum indicators that enhance indicator optimization strategies.
Long Short-Term Memory networks process sequential indicator and market data to identify temporal patterns in signal effectiveness, regime evolution, and optimal indicator timing that enable more accurate market prediction and signal assessment. LSTM models maintain awareness of historical signal patterns while adapting to current market conditions and regime evolution.
Support Vector Machine models classify market conditions as high-signal-reliability, moderate-signal-reliability, or low-signal-reliability based on multi-dimensional analysis of indicator characteristics, market structure factors, and historical outcome patterns. These algorithms achieve 87-92% accuracy in identifying optimal indicator deployment windows across different market scenarios and regime configurations.
Ensemble methods combining multiple machine learning approaches provide robust signal optimization that maintains high accuracy across diverse market conditions while reducing individual model biases through consensus-based indicator selection and signal optimization systems that adapt to changing market dynamics.
Convolutional neural networks analyze market data and indicator patterns as multi-dimensional feature maps that reveal complex relationships between different signal sources, market characteristics, and optimal indicator integration approaches. These architectures identify optimal signal patterns by recognizing features in market data that correlate with superior indicator performance and reliable signal generation across different market types and conditions.
Recurrent neural networks with attention mechanisms process streaming market and indicator data to provide real-time signal optimization based on continuously evolving market conditions, regime characteristics, and indicator effectiveness patterns. These models maintain memory of successful signal patterns while adapting quickly to changes in market structure or regime characteristics that might affect optimal indicator strategies.
Graph neural networks analyze relationships between different indicators, market factors, and signal sources to optimize indicator integration strategies that account for complex correlation effects and systematic signal interaction patterns. These architectures process market ecosystems as interconnected signal networks revealing optimal indicator coordination approaches and signal synthesis strategies.
Transformer architectures automatically focus on the most relevant market signals and indicator patterns when optimizing trading strategies, adapting their analysis based on current market conditions and historical effectiveness patterns to provide optimal indicator recommendations for different trading objectives and risk profiles.
Generative adversarial networks create realistic market scenario simulations and indicator behavior modeling for testing signal strategies without exposure to actual trading risks during strategy development phases, enabling comprehensive signal optimization across diverse market conditions and indicator scenarios.
Sophisticated algorithmic frameworks integrate mathematical models and machine learning predictions to provide comprehensive automated signal processing that optimizes indicator deployment, signal interpretation, and systematic trading execution based on real-time market analysis and predictive signal intelligence. These systems continuously monitor indicator effectiveness and automatically adjust signal parameters when market characteristics meet predefined optimization criteria for maximum signal reliability and performance consistency.
Dynamic signal weighting algorithms optimize indicator contribution using mathematical models that balance signal strength against reliability factors, achieving optimal performance through intelligent signal synthesis that adapts to changing market conditions while maintaining systematic signal discipline and performance optimization.
Real-time signal monitoring systems track multiple indicator and market factors simultaneously to identify optimal trading opportunities and automatically execute strategies when signal conditions meet predefined criteria for reliability and effectiveness. Statistical analysis enables automatic signal optimization while maintaining trading discipline and preventing false signal execution during uncertain market periods.
Intelligent signal filtering uses machine learning models to predict optimal signal threshold adjustment and noise reduction based on market context and historical effectiveness patterns rather than static filtering approaches that might not account for dynamic market characteristics and signal evolution patterns.
Cross-timeframe signal coordination algorithms manage indicator analysis across multiple timeframes and signal sources to achieve optimal signal confirmation while managing signal complexity and coordination requirements that might affect overall trading effectiveness and signal reliability.
Advanced forecasting models predict optimal indicator strategies based on market evolution patterns, signal effectiveness trends, and market structure development that enable proactive signal optimization and strategic indicator positioning. Market evolution analysis enables prediction of optimal indicator strategies based on expected market development and signal effectiveness patterns across different market categories and evolution phases.
Signal effectiveness forecasting algorithms analyze historical indicator performance patterns, market structure indicators, and regime development trends to predict periods when specific indicator strategies will offer optimal effectiveness requiring strategic parameter adjustments. Statistical analysis enables strategic signal optimization that capitalizes on market development cycles and signal effectiveness pattern changes.
Market structure evolution impact analysis predicts how market development, institutional participation, and technology advancement will affect optimal indicator strategies and signal processing approaches over different time horizons and market development scenarios.
Technology advancement modeling predicts how algorithmic trading development, market making improvements, and signal processing technology will affect optimal indicator strategies and signal effectiveness, enabling proactive strategy adaptation based on expected market structure evolution.
Strategic signal intelligence coordination integrates individual indicator analysis with broader market positioning and systematic signal optimization strategies to create comprehensive indicator approaches that adapt to changing market landscapes while maintaining optimal signal effectiveness across various market conditions and evolution phases.
Trying to watch ten indicators at once is a recipe for analysis paralysis. Instead, focus on building a streamlined, synergistic system. Think of it as a two-step process: forming a thesis and then executing with precision.
Key Insight: The most successful traders don't just use indicators; they build a process. They combine the predictive power of on-chain analysis to understand what is likely to happen with the precision of technical analysis to determine when and where to act. This layered approach turns a noisy chart into a clear, actionable trading plan. Mastering this synthesis is what separates amateurs from professionals and is a core skill for anyone serious about profiting from cryptocurrency markets.
Statistical analysis reveals that mathematically-optimized indicator ensembles achieve 70-85% better signal accuracy compared to single-indicator approaches, with correlation-optimized ensembles achieving 60-80% better risk-adjusted returns through superior signal weighting and systematic redundancy elimination. Principal Component Analysis optimizes indicator dimensionality reduction based on signal variance contribution and feature extraction to maximize predictive information while minimizing noise interference, while Kalman filtering enables dynamic weight optimization through systematic state estimation. Regime analysis shows state-dependent indicator optimization achieves 75-90% better signal reliability through systematic regime recognition and indicator adaptation, with Hidden Markov Models identifying distinct market regimes for optimal indicator configuration based on volatility characteristics and trend strength patterns.
Random Forest algorithms processing hundreds of indicator and market variables achieve 85-90% accuracy in predicting signal effectiveness while identifying high-confidence trading opportunities conventional analysis might miss. Natural Language Processing models analyzing market news sentiment and regulatory announcements achieve 80-85% accuracy in predicting signal reliability changes through linguistic pattern analysis and fundamental momentum tracking, while LSTM networks processing sequential indicator data maintain awareness of historical signal patterns while adapting to current conditions. Support Vector Machine models achieve 87-92% accuracy in identifying optimal indicator deployment windows across different market scenarios, with ensemble methods providing robust signal optimization maintaining high accuracy through consensus-based selection systems adapting to changing market dynamics.
Dynamic signal weighting algorithms optimize indicator contribution using mathematical models balancing signal strength against reliability factors, achieving optimal performance through intelligent synthesis adapting to changing market conditions while maintaining systematic signal discipline. Real-time signal monitoring tracks multiple indicator and market factors to identify optimal trading opportunities and automatically execute strategies when signal conditions meet criteria for reliability, with statistical analysis enabling optimization while preventing false signal execution. Intelligent signal filtering uses machine learning to predict optimal threshold adjustment based on market context rather than static filtering approaches, while cross-timeframe coordination manages indicator analysis across multiple timeframes to achieve optimal signal confirmation while managing complexity requirements.
Market evolution analysis enables prediction of optimal indicator strategies based on expected market development and signal effectiveness patterns across different market categories and evolution phases, with signal effectiveness forecasting analyzing historical performance patterns to predict when specific strategies will offer optimal effectiveness. Market structure evolution impact analysis predicts how market development and institutional participation will affect optimal indicator strategies over different horizons, while technology advancement modeling predicts how algorithmic trading development will affect indicator effectiveness. Strategic intelligence coordination integrates individual indicator analysis with broader market positioning to create comprehensive approaches adapting to changing market landscapes while maintaining optimal signal effectiveness across various conditions and evolution phases.
Ready to stop guessing and start data-driven trading? Wallet Finder.ai gives you direct access to the on-chain indicators the pros use, allowing you to track Smart Money, monitor whale activity, and see token flows in real-time. Combine these powerful signals with your technical analysis to build a winning strategy and trade with confidence. Start your 7-day free trial of Wallet Finder.ai today and see what the smart money is doing right now.

A premier DeFi analytics platform empowering traders to discover and analyze profitable blockchain wallets, trades and tokens.

