
Recovery Factor Calculation for Smart Traders
Master the recovery factor calculation to measure a strategy's resilience. Learn the formula, see DeFi examples, and find top wallets with Wallet Finder.ai.

June 20, 2026


Wallet Finder
February 7, 2026

At its core, blockchain data analytics is about turning the raw, chaotic mess of on-chain transactions into clear, actionable trading signals. Every single swap, NFT mint, and token transfer on ledgers like Ethereum or Solana leaves a permanent digital footprint. This is the art of decoding those footprints to understand the why behind market movements.
Trying to make sense of raw blockchain data is like trying to drink from a firehose. It's a relentless, unfiltered stream of transaction hashes, wallet addresses, and smart contract calls that, on its own, is pure noise. Blockchain data analytics provides the tools to tame this chaos and find profitable signals.
Instead of just staring at price charts and reacting, you can finally understand the specific behaviors driving those green and red candles. It’s the difference between seeing a stock price jump and knowing a huge investment fund just bought a massive position. That deeper context is where a real trading edge is born.
The goal is to dig past the surface-level noise and find patterns that give you an advantage. Effective on-chain analysis helps traders answer critical questions that traditional charts simply can't.
Blockchain data analytics transforms millions of abstract data points into a clear story. It reveals the strategies of the market's top performers, flags unusual activity, and gives you a foundation for making proactive, informed decisions instead of just reactive guesses.
The demand for these insights is growing at an incredible pace. The blockchain analytics market has seen massive growth, proving how vital it is for tracking the kind of on-chain activity that powers tools like Wallet Finder.ai.
As daily transaction volumes on major networks easily exceed 1.5 million, they create a mountain of data. Analytics platforms are built to sift through this data to spotlight smart money moves—like finding wallets with 200%+ win streaks.
The market for predictive analytics tied to blockchain is on track to hit USD 28.1 billion by 2026, all focused on helping traders do things like forecast token pumps based on whale activity. You can learn more about this growth in a report from MarketsandMarkets. This trend makes one thing clear: success in today's crypto markets isn't just about what you trade, but the quality of the data driving your decisions.
So, how does a random jumble of wallet addresses and transaction hashes transform into a money-making trade? It’s not magic. It’s a deliberate, step-by-step process that turns the raw, chaotic noise of the blockchain into something a trader can actually use. This entire journey is what we call the data pipeline, and it’s the engine running behind all serious blockchain analytics.
The process kicks off right at the source. Specialized servers, known as nodes, store a full copy of a blockchain’s entire history. The first step is to pull every single transaction, smart contract interaction, and balance update directly from these nodes on networks like Ethereum, Solana, and Base.
In its raw form, this data is a mess—think of an unsorted library where every book is just a long string of random characters. It’s completely unusable for analysis.
This flow chart shows how that raw, messy data gets refined into a clear trading signal.
Each stage builds on the one before it, sifting through billions of data points until a coherent pattern emerges that a trader can act on.
Once the data is pulled from the nodes, it’s fed into an ingestion system. This is where the real cleanup job starts. The system parses, decodes, and organizes all that raw information into a structured format, usually a massive database.
Going back to our library analogy, this is like translating those random characters into readable words and then sorting all the books by author, title, and publishing date. It’s a crucial step that builds a usable foundation.
Instead of cryptic transaction logs, you now have clean, organized tables showing:
Without this step, trying to find anything meaningful would be next to impossible. For a closer look at how this data is publicly available, check out our guide on what a blockchain explorer is.
Now we have structured data. It's clean, but it still lacks vital context. The next layer—enrichment—is where raw facts are turned into genuine intelligence. This is where analytics platforms add new layers of information to make the data truly meaningful for traders.
This is arguably the most valuable part of the entire pipeline.
Enrichment is what connects an anonymous wallet address to a known entity, like a VC fund or a centralized exchange. It also calculates a trader's real-time Profit and Loss (PnL), win rate, and other key performance indicators.
This stage is all about answering the really important questions. For example, enrichment can flag a wallet as “Smart Money” if it meets certain profitability criteria or label another address as belonging to a major player like “a16z” or “Jump Trading.”
Finally, the analysis layer runs algorithms over this enriched data to generate actionable signals. It spots patterns like a whale quietly accumulating a new token, a sudden surge of new wallets buying a memecoin, or a top trader opening a fresh position. This final output is what you see on a dashboard or what triggers a real-time alert, completing the journey from a raw hash to a profitable insight.
This table breaks down how each stage in the pipeline contributes to the final outcome, turning raw blockchain events into clear, actionable intelligence for traders.
Each step is essential. Without extraction, there’s no data. Without cleaning, it’s unusable. And without enrichment and analysis, it’s just a collection of facts with no real meaning or trading value.
Once your data is clean and organized, the real hunt for alpha—those rare, market-beating opportunities—can finally begin. Top-tier on-chain analysts don't just stare at isolated transactions. They have a playbook of specific methods to connect the dots and piece together the narratives hidden in plain sight on the blockchain.
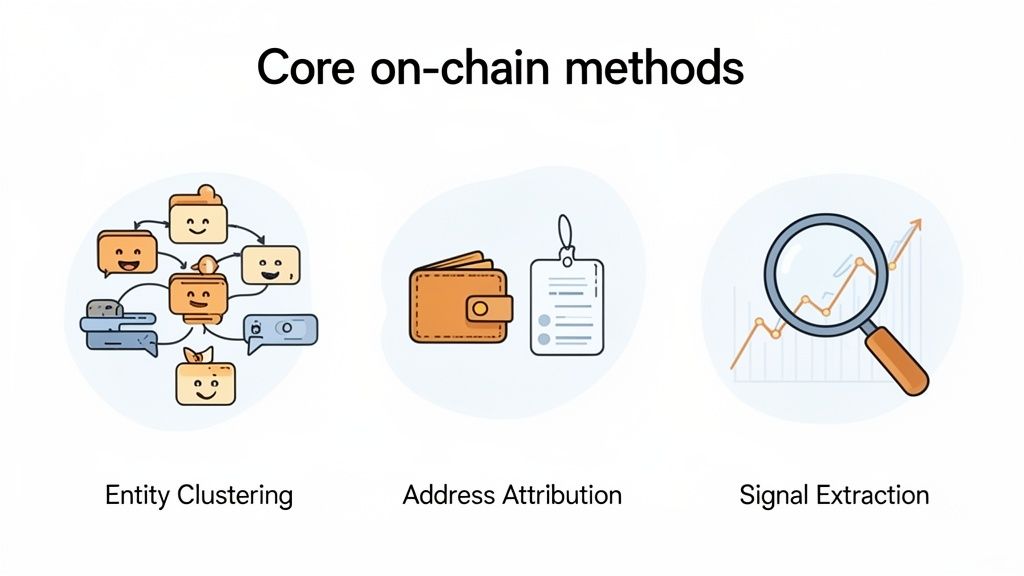
These techniques are what turn a chaotic sea of numbers into a strategic map of the crypto market. At the heart of this process are three powerful methods that form the foundation of modern blockchain data analytics. Each one peels back a different layer of anonymity, revealing the moves of crypto's most influential players. Getting a handle on these is the key to shifting from reactive trading to proactive, data-driven decisions.
A single smart trader rarely uses just one wallet. To manage risk, test new strategies, or organize assets, they often operate a whole network of interconnected addresses. Entity clustering is the detective work required to link these scattered wallets back to a single person or group.
Think of it like connecting someone's various social media profiles and email addresses to realize they all belong to the same individual. By analyzing transaction flows—like spotting a main wallet sending ETH to fund several smaller ones—analysts can group them into a single "entity." This gives you a complete picture of a trader’s entire strategy, not just a misleading snapshot from one address.
This method is powerful because it reveals:
While clustering groups anonymous wallets, address attribution takes it a step further by putting real-world names to them. This is the process of labeling an address with a known identity, like "Paradigm," "a16z," "Wintermute," or "Coinbase." Suddenly, the context behind capital flows becomes crystal clear.
Knowing that $10 million in a token was moved is interesting. But knowing it was moved from an early investor’s wallet straight to an exchange? That’s a powerful signal, and attribution is what makes it possible.
Address attribution transforms anonymous on-chain activity into a transparent view of institutional and market-maker behavior. It tells you not just what is happening, but who is making it happen, providing critical context for interpreting market movements.
Analysts build these labels using publicly available information, deep-dive research, and clever algorithms. When you see a major fund like Dragonfly Capital send assets to an exchange, it might signal an impending sale. If you see them withdrawing tokens, it could mean they're in it for the long haul.
The final piece of the puzzle is signal extraction. This is the art and science of spotting repeatable, predictive patterns within all this enriched and attributed data. It’s about identifying the specific on-chain events that consistently happen right before a big price move.
These signals can be simple or incredibly complex, but they are always backed by data. And the need for these analytics is exploding. The market is projected to skyrocket from USD 39.82 billion in 2026 to USD 455.16 billion by 2031—that's a massive 62.8% CAGR. This flood of new value and data allows analysts to discover that 75% of top trades come from just 0.1% of wallets, and then pinpoint the ones with an 85% win rate. You can read the full research about blockchain technology's market boom to grasp the scale of this opportunity.
Here are a few common on-chain signals traders look for:
These three methods—clustering, attribution, and signal extraction—are a powerful trio. They work together to turn a chaotic public ledger into a clear map of market activity, letting you see exactly what the smartest players are doing and, more importantly, giving you the chance to act on it.
Having the right methods is only half the battle. Without the right tools, even the best techniques are just theory. The world of blockchain data analytics is built on a stack of different tools, ranging from deep-level infrastructure for developers to slick, user-friendly platforms designed specifically for traders like you.
Understanding how these layers fit together is key to appreciating how raw, messy blockchain data gets turned into a real trading edge.
The whole process starts at the very foundation, the gateway to the blockchain itself. This is where you find the heavy-duty infrastructure that makes the on-chain world accessible and readable in the first place.
The real game-changer for most traders is the rise of integrated platforms that handle the entire complex stack—from node data to querying and signal generation—and present the final output in a simple, actionable interface.
This brings us to the top of the stack: integrated analytics platforms. These are the tools built for action. They take care of the entire data pipeline, from raw extraction all the way to generating a clear signal, and deliver the final intelligence in a format you can actually use. Instead of asking you to write code, they give you ready-made answers.
These platforms are designed to tackle a trader’s most urgent questions directly and without the fluff. If you're looking to see how the different options stack up, you can check out our deep dive into the top 10 blockchain analytics platforms.
You'll find that these integrated tools usually pack a punch with features like:
By packaging complex blockchain data analytics into these kinds of intuitive features, integrated platforms make sophisticated on-chain intelligence accessible to everyone. They effectively close the gap between raw, overwhelming data and profitable trading decisions.
Alright, let's turn all this theory into action. Knowing the tools is one thing, but actually using them to make money is a whole different ballgame. The real alpha comes from actively hunting for opportunities with on-chain data before they hit the mainstream.
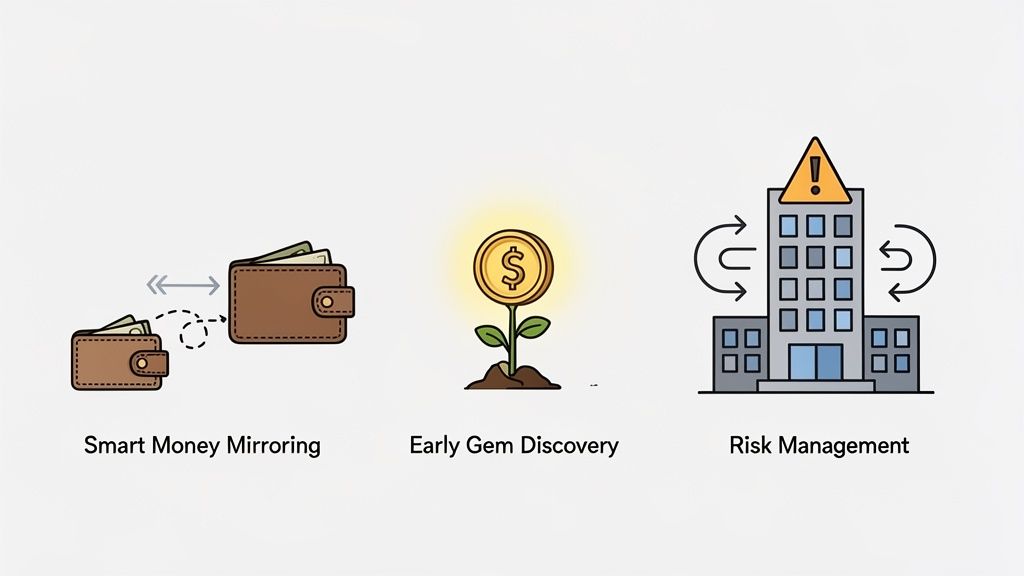
This is where we get practical. Below are three powerful strategies that put blockchain data analytics to work. Each one is designed to give you a specific edge, whether it's by copying the market's sharpest traders, finding the next 100x token early, or simply protecting your capital from nasty surprises. These aren't just ideas; they're actionable game plans.
One of the most effective on-chain strategies is brutally simple: follow the winners. Why try to reinvent the wheel when you can find wallets with a proven history of massive profits and just mirror their moves? You're essentially tapping into the research and instincts of the best traders in the game.
The goal isn't just to see what a smart wallet bought last week. It's to know what they're buying right now. Modern analytics platforms make this possible by calculating performance metrics for every wallet, turning the blockchain into a transparent leaderboard of trading talent.
Here’s your actionable checklist for mirroring smart money:
The big idea with smart money mirroring is that a strong track record is often the best predictor of future success. By piggybacking on wallets that consistently make the right calls, you’re leveraging their hard work and expertise for your own gain.
Every token that does a 100x starts with a quiet accumulation phase. Long before it’s all over Twitter or listed on a major exchange, a small group of sharp investors is often quietly loading their bags. Blockchain data gives you a front-row seat to this critical early stage.
If you can spot these patterns, you gain a massive first-mover advantage, letting you get in before the hype cycle sends the price to the moon. This strategy is all about finding those subtle on-chain signals that show conviction from wallets that know something you don't.
To find these hidden gems, look for these specific clues on-chain:
On-chain data isn't just for offense; it's also your best defense. Big, sudden price dumps are often telegraphed by massive token movements to and from centralized exchanges. Watching these flows is like having an early warning system for market volatility.
For example, when a whale moves a huge bag of tokens onto an exchange, it’s a strong signal they’re about to sell, which can create serious downward pressure. On the flip side, large outflows can mean holders are moving tokens to cold storage for the long haul, squeezing the available supply and potentially driving prices up.
Here’s a simple framework for using exchange flows to manage risk:
By keeping an eye on these capital movements, you stop reacting to charts and start anticipating market moves. It's the key to protecting your portfolio before everyone else is running for the exits.
All the theory we've covered—from data pipelines to analytical methods—is great, but it doesn't execute trades. This is where a platform comes in, bridging the gap between complex blockchain data analytics and simple, clickable features you can use in seconds.
The whole point is to connect the "how" (the tech) with the "what" (your trading goals). For instance, our 'Discover Wallets' feature isn't magic; it's the direct result of applying advanced entity clustering and real-time PnL calculations. It does the hard work of sifting through millions of addresses to hand you the proven winners.
Likewise, those instant Telegram alerts you get are the end product of on-chain signal extraction. We have systems watching the chain 24/7 so you can focus on making the right move at the right time, instead of staring at a block explorer all day.
Let's walk through how this actually works. Imagine you want to find the next big memecoin before it's all over Twitter. Your mission is to find a top trader who crushes it in this niche and copy their next move.
First, you'd jump into the discovery tools to filter for wallets that meet your exact criteria. You're not looking for just any profitable wallet; you want a specialist.
Here’s what that filtering process might look like:
This process instantly gives you a curated list of elite traders. You can then dive into their trade history, confirm their strategy feels right, and add the best one to your watchlist.
Now, the system takes over. The second your watchlisted trader makes a new purchase, you get an instant Telegram alert. But it’s not just a "Hey, they bought something" notification. It gives you all the critical context you need to make a decision.
This is the crucial moment where analysis becomes action. The platform has condensed a complex data pipeline, entity clustering, and signal extraction into a single, timely notification on your phone, giving you the chance to act on smart money's moves in real time.
The alert shows you the exact token they bought, how much they spent, the price they paid, and a direct link to the transaction on the blockchain. From there, you can quickly verify the trade and decide if you want to follow.
This is how a great tool closes the massive gap between raw, messy on-chain data and a profitable trade. By making these insights easy to act on, platforms like Wallet Finder.ai open up sophisticated on-chain strategies for everyone. To see it for yourself, you can start a free trial with Wallet Finder.ai and begin tracking top traders today.
Diving into the world of blockchain data analytics always brings up a few common questions. Let's tackle some of the big ones to clear up any confusion.
Not anymore. While the data science behind it is incredibly complex, you don't need a Ph.D. to get started. Modern platforms have done the heavy lifting, making it accessible to just about anyone.
The real skill isn't in crunching the numbers yourself but in learning how to read the signals these tools give you. It's about shifting your focus from just seeing the data to truly understanding the story it tells about what's happening in the market.
You could, but you probably shouldn't. On-chain data gives you an incredible edge because it shows you what the smart money is actually doing—not just what people are saying on Twitter. That’s a massive advantage.
But for the best results, you'll want to layer it with other strategies. Combine on-chain insights with solid fundamental analysis of a project and a general feel for market sentiment. Think of it as a critical piece of your toolkit, not the only tool you own.
On-chain data gives you a transparent look at the mechanics behind price action. It's the difference between seeing the effect (a price chart) and understanding the cause (the wallet activity driving it).
This is a great question and a common point of confusion. They work well together but are fundamentally different.
Simply put, TA is like analyzing the shadow on the wall, while on-chain analysis lets you see the object that's casting it.
Ready to turn on-chain insights into actionable trades? Wallet Finder.ai gives you the tools to discover top traders, track their moves in real time, and act on data-driven signals. Start your 7-day free trial at https://www.walletfinder.ai.

A premier DeFi analytics platform empowering traders to discover and analyze profitable blockchain wallets, trades and tokens.

