
Recovery Factor Calculation for Smart Traders
Master the recovery factor calculation to measure a strategy's resilience. Learn the formula, see DeFi examples, and find top wallets with Wallet Finder.ai.

June 20, 2026


Wallet Finder
November 26, 2025
Break-even analysis helps you figure out the exact price you need to sell your crypto to recover all costs - like purchase price, trading fees, and transaction fees. This is critical in crypto trading because of its high volatility and complex fee structures. For example, if you buy Bitcoin at $30,000 and pay $500 in fees, your break-even price is $30,500. You’ll only profit if the price goes above this.
Crypto markets run 24/7, so tools like Wallet Finder.ai can help track your costs, break-even points, and wallet performance in real time. While break-even analysis is useful, it has limits in unpredictable markets. Combine it with stop-loss orders and technical tools for better results.
The break-even point is where your total revenue matches your total costs - essentially, it's the point at which you've covered all your expenses. In crypto trading, this includes not just the purchase price but also trading fees and network transaction costs, which aren't as common in traditional asset trading.
For example, let’s say you buy Ethereum for $2,000 per coin and pay $50 in combined trading and network fees. Your break-even point would be $2,050. The market price needs to climb above this level before you can start seeing any profit. Knowing this baseline is crucial for managing risk and setting realistic goals.
Crypto markets are known for their volatility, and understanding your break-even point can help you make smarter decisions. It allows you to set achievable profit targets and stop-loss levels. For instance, if your break-even point for Bitcoin is $45,000, you might aim for a more realistic profit target of $47,000 instead of banking on unrealistic overnight gains.
This knowledge also helps when setting stop-loss levels. Many traders use the break-even point as a psychological safety net, choosing to exit a trade at this level if the market starts turning against them.
Additionally, being clear on your break-even point is especially useful during price swings. It gives you a benchmark for evaluating whether a trade is worth the risk. For example, if steep fees push your break-even point too high, it might make sense to wait for a better entry price. This approach lays the groundwork for understanding how crypto break-even analysis compares to that of traditional assets.
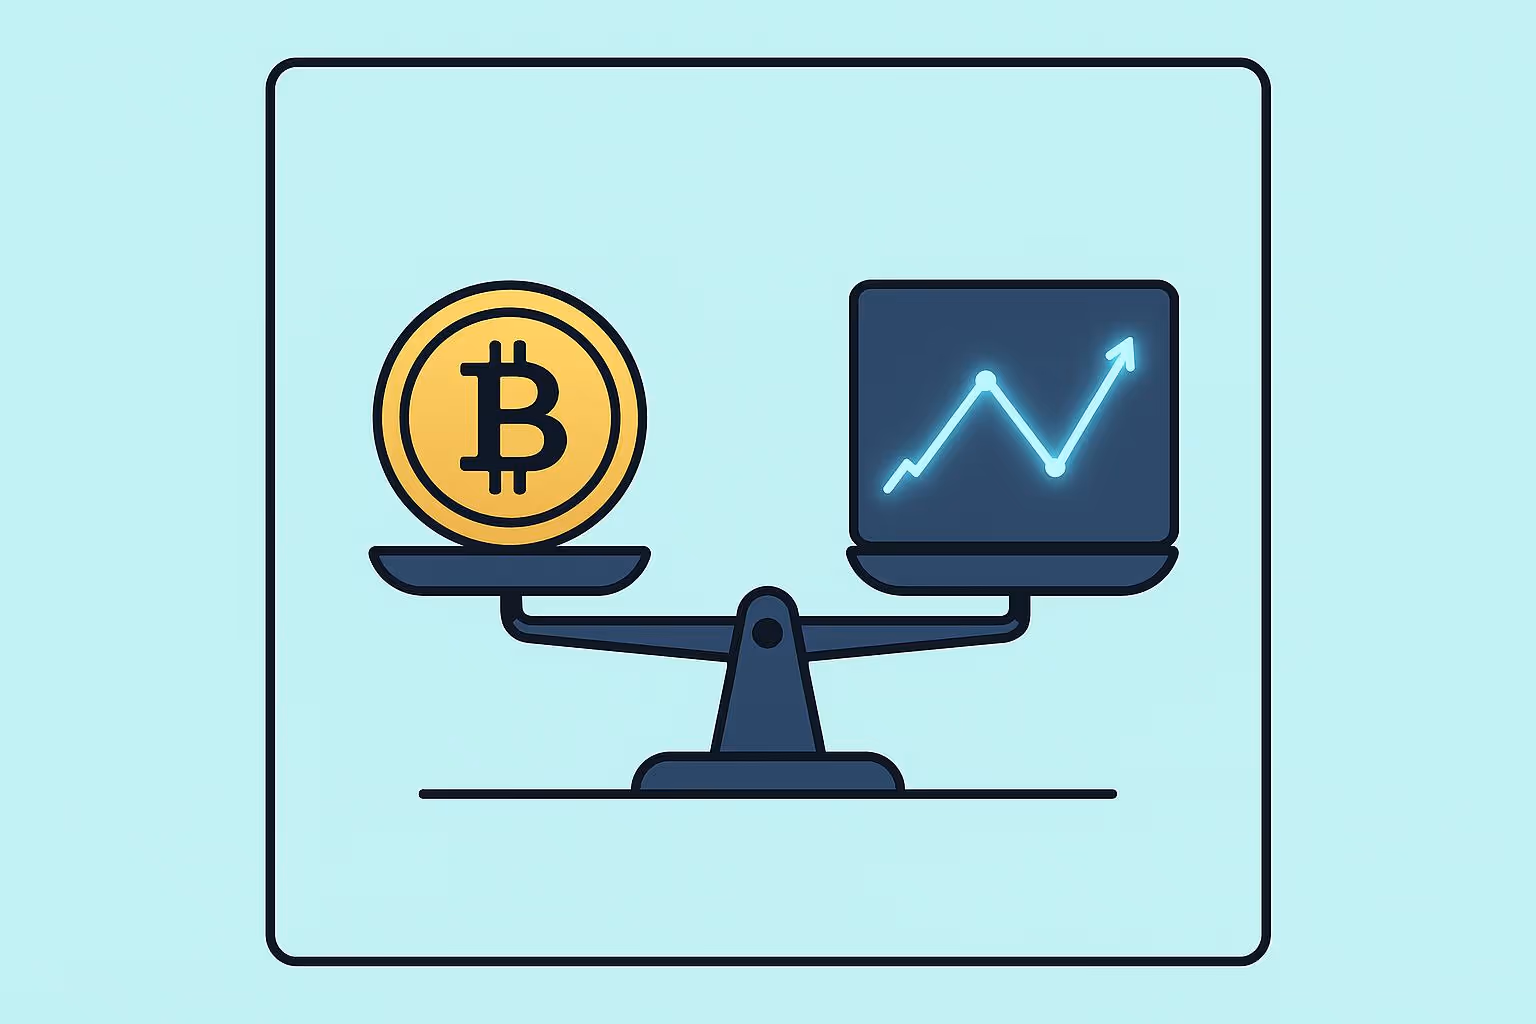
Break-even analysis in crypto trading has unique challenges compared to traditional asset trading, largely because of how different the markets are. Crypto assets are notoriously volatile. For instance, Bitcoin has shown a compounded annual growth rate (CAGR) of over 200% in the last decade, whereas the S&P 500 has maintained a historical CAGR of around 10% annually.
In 2024, Bitcoin delivered a 121% return, far outpacing the Nasdaq 100’s 25.6% gain, the S&P 500’s 25% rise, and the 10-year US Treasury bond’s yield of about 4.57%. On top of this, crypto trading often involves more complex fee structures. You have to account for exchange fees, network fees, and even slippage costs, whereas traditional markets usually deal with simpler commission fees. Another key difference is that traditional markets operate during specific hours, while crypto markets run 24/7. This constant activity means you may need to frequently recalculate your break-even point to keep up with price changes. To keep everything accurate and organized, our PnL Tracking: A Guide for DeFi Traders explains how to monitor profit and loss in real time across different chains and protocols.
These differences highlight the importance of tailoring your break-even calculations for crypto trading. The constant market shifts and higher volatility demand regular updates to ensure your strategy stays on track.
This formula ensures that all costs are accounted for before you start making a profit.
For example, let’s say a trader buys 1 BTC for 50,000 USDT with a 0.1% trading fee. This means their total cost is 50,050 USDT. To break even, they need to sell that 1 BTC for enough to cover both the purchase price and the selling fee. After calculations, the break-even price comes out to 50,100.1 USDT.
This formula highlights two types of costs:
Next, let’s see how the type of trade impacts the break-even calculation.
While the basic formula works for most trades, different trading methods come with unique cost factors that require adjustments.
Another helpful concept is the contribution margin, which is the sales price per unit minus the variable cost per unit. This shows how much each trade contributes toward covering fixed costs.
Variable costs can greatly influence your break-even point, especially in volatile markets. Let’s break it down with an example:
This extra $10 per coin, combined with trading fees, raises your break-even price.
In extreme cases, slippage can be even more severe. For example, in 2022, a trader trying to sell $80,000 worth of an illiquid DeFi token during off-peak hours saw a 25% price drop in under a minute due to low buyer demand. Slippage rates for volatile trading pairs can sometimes exceed 5% during major market events.
Other factors, like the type of order you place, also impact variable costs:
During times of high market activity, average slippage for leading coins can jump from 0.1% to over 2%, and even higher for altcoins.
To keep variable costs under control:
Understanding these costs is crucial for setting realistic profit goals and managing your risk effectively.
Break-even analysis plays an important role in managing risks in crypto trading. By pinpointing their break-even points, traders can set accurate stop-loss orders and take-profit levels, helping them protect against losses and lock in profits. A smart move is to determine these exit points before even entering a trade. For instance, if a trader buys Solana at $100 with a break-even point of $102.50, they might use a dynamic stop-loss to secure gains as the price climbs.
Pairing break-even analysis with technical tools like moving averages and the Relative Strength Index (RSI) can help confirm trends and fine-tune entry and exit points. For example, if you’re holding a long position on Polkadot (DOT) during an uptrend and the price approaches the 61.8% Fibonacci retracement level, it could be a good time to take profits. Similarly, if Bitcoin's 50-day moving average dips below its 200-day moving average, it might signal an upcoming trend reversal, prompting an exit.
That said, while break-even analysis is a core part of risk management, its static nature can be a drawback in the highly unpredictable crypto market.
Although break-even analysis is useful for controlling risks, it has some clear limitations in volatile markets. One major issue is cryptocurrency’s extreme price swings, which can quickly render static calculations unreliable. For example, between January 2019 and December 2021, there were nine days when the total crypto market value dropped by 20% or more in a single day. On March 12, 2020, crypto prices plunged by 43%, only to skyrocket by over 1,600% in the following 14 months.
Liquidity is another challenge, particularly for smaller-cap cryptocurrencies with limited trading activity. Slippage and unexpected fees can skew break-even calculations. During the 2020 DeFi boom, Ethereum-based exchanges like Uniswap saw slippage rates soar by more than 200% due to network congestion and skyrocketing gas fees. While break-even analysis might assume nominal trading fees, actual costs can be much higher during busy periods.
Regulatory uncertainty adds yet another layer of complexity. Sudden changes in regulations can impact platform access or even make certain trades illegal, throwing off carefully planned exit strategies. Emotional factors like fear of missing out (FOMO) or panic selling can also lead traders to abandon their plans, undermining even the most precise calculations. Additionally, relying on historical data can be risky in crypto markets, where conditions change rapidly and unpredictably.
To address these limitations, traders often adjust their strategies. For instance, they might widen their stop-loss levels to account for higher volatility or break large trades into smaller ones to reduce the impact of low liquidity. These adjustments help traders stay flexible and better prepared for market surprises.
High Volatility
Rapid price changes can invalidate calculations
Widen stop-loss levels and reduce trade sizes
Low Liquidity
Slippage raises actual costs above estimates
Break large trades into smaller, manageable parts
Regulatory Changes
Disrupts planned exit strategies
Trade across several platforms for diversification
Emotional Trading
Leads to deviations from planned exits
Use automated orders and stick to preset rules
While break-even analysis provides a solid foundation for risk management, it’s not a one-size-fits-all solution. Successful traders use it as part of a broader approach, staying flexible and ready to adapt to the crypto market’s ever-changing landscape.
More and more traders are turning to analytics platforms to streamline break-even calculations and gain insights in real time. The global AI crypto wallet market hit $8.42 billion in 2022, with projections showing an annual growth rate of 24.8% through 2030. This rapid growth highlights the rising demand for tools that can handle the intricate needs of modern DeFi trading. These tools are essential for simplifying and interpreting the vast amounts of blockchain data traders face today.

Wallet Finder.ai provides tools designed to track wallet behaviors, trade histories, and performance trends across major blockchains. Its real-time wallet scanning feature quickly identifies high-performing wallets based on profitability metrics and transaction history.
The platform's analytics dashboard offers a clear view of historical wallet performance, using charts to illustrate returns and profitability. This makes it easier for traders to determine when their positions cross the break-even point and assess the overall health of their strategies. With loading times under two seconds, traders can act quickly, minimizing delays that could affect their calculations.
A standout feature allows users to sort wallets by net profit and review past trade data. This helps traders study successful patterns and pinpoint break-even points. Additionally, data can be exported to Excel or CSV for deeper offline analysis, enabling advanced modeling and backtesting.
Wallet Finder.ai doesn’t just focus on past performance - it also helps spot new trends. The token trade discovery tool analyzes real-time trading volumes and token trends, uncovering opportunities that can refine entry points and improve break-even calculations.
Wallet Finder.ai includes several tools tailored for optimizing break-even analysis and improving risk management.
Real-time Wallet Scanning
Quickly identifies profitable patterns
Study effective break-even strategies
Telegram Alerts
Instant updates on threshold breaches
Stay informed on critical break-even points
Advanced Filtering
Focuses on key profitability metrics
Identify wallets excelling in break-even performance
Data Export
Enables thorough offline analysis
Build detailed break-even models
Smart Contract Evaluation
Mitigates risks from unreliable tokens
Protect break-even strategies from token failures
These features help traders refine their strategies and manage risks more effectively, especially in fast-moving markets.
Wallet Finder.ai offers a freemium plan for basic wallet performance tracking, while premium options unlock advanced statistics, trade discovery tools, and enhanced filtering capabilities. By combining real-time blockchain data with user-friendly analytics, the platform simplifies the process of identifying profitable opportunities in DeFi trading. For traders focused on precise break-even strategies, Wallet Finder.ai provides the tools needed to make informed, data-driven decisions.
When it comes to managing risk and fine-tuning your trading strategy, knowing how you calculate your break-even point is a big deal. Whether you go for manual or automated break-even analysis can make a noticeable impact on your trading outcomes. Each method comes with its own set of pros and cons, and the choice often boils down to your trading experience, time availability, and overall goals.
Manual analysis involves crunching the numbers yourself for every trade. You’ll need to look at each position, account for all costs, and figure out the break-even points using tools like spreadsheets or even pen and paper. The upside? It gives you the flexibility to adapt to changing market conditions. The downside? It’s time-consuming and leaves room for errors.
Automated analysis, on the other hand, relies on algorithms to handle all the data. These systems can simultaneously track multiple positions, calculate break-even points instantly, and even execute trades based on pre-set rules. Automated trading is becoming the norm, making up about 60–73% of U.S. equity trading volume today. In crypto markets, this trend is growing even faster as traders aim to take advantage of 24/7 market activity.
One of the biggest perks of automated systems is their consistency. They stick to the rules and avoid emotional decision-making. However, they’re not perfect. Sudden market events or regulatory changes can throw them off, and there’s always a risk of over-optimizing based on past data.
Here’s a side-by-side look at how manual and automated analysis stack up:
10–15 seconds per calculation
Milliseconds per calculation
Prone to human error
Highly precise (but coding errors possible)
Limited by individual capacity
Can monitor multiple markets at once
Affected by fear, greed, and biases
Emotion-free execution
Very flexible
Limited unless reprogrammed
Low (mainly time investment)
Higher setup costs for advanced tools
Requires constant learning and updates
Needs technical updates and maintenance
Flexible but inconsistent
Precise with instant stop-loss execution
Manual trading is often more affordable to get started with, but it demands a lot of time and effort. Automated trading systems, while pricier upfront, tend to require less ongoing attention once they’re up and running.
Performance-wise, automated systems often aim for smaller profits per trade but make up for it with higher trading frequency. Manual trading, in contrast, might deliver higher profits per trade but at a slower pace. Many traders find success in combining the two approaches - using automation for speed and precision while keeping human oversight for strategic decisions.
Ultimately, your choice between manual and automated break-even analysis depends on how you like to trade. If you prefer hands-on control and take fewer trades, manual analysis might be your go-to. But if you’re juggling multiple positions or trading across time zones, automated systems can help you stay on top of things. Picking the right method ensures your strategy stays sharp in the unpredictable world of crypto markets.
Break-even analysis is a must-have tool for crypto traders, offering a clear way to protect your capital in unpredictable markets. Research shows that 90% of traders lose money, which makes understanding your break-even point an essential part of managing risk. When you know exactly what price your trade needs to hit to cover all costs, you can make decisions based on logic and data rather than emotions.
The strategies we've discussed - like setting realistic profit targets and adjusting stop-losses to break-even once trades become profitable - give you practical ways to improve your results. No matter what type of trade you're making, knowing your break-even point before putting money on the line is non-negotiable.
Whether you prefer manual calculations or automated tools depends on your trading style. Many traders find that a mix of both works best - automation ensures precision, while human oversight allows for strategic adjustments. Tools like Wallet Finder.ai can make a big difference by providing real-time tracking and advanced filtering options. With over 58% of high-frequency crypto traders using dashboards with automation features, having access to these analytics tools can give you an edge.
It's important to remember that break-even analysis isn't a shortcut to guaranteed profits. Instead, it's a foundational part of a smart risk management approach. By keeping track of your break-even points, calculating risk-reward ratios, and using stop-loss orders wisely, you build the discipline that separates successful traders from the majority who lose money.
Since crypto markets run 24/7, automated orders and alerts are crucial for protecting your investments when you're not actively monitoring trades. Break-even analysis helps set up these safeguards, making it an invaluable part of your trading toolkit. Whether you're just starting out or fine-tuning your strategy, mastering break-even analysis is key to navigating the challenges of cryptocurrency trading and achieving long-term success.
Break-even analysis is a handy tool for navigating the unpredictable world of cryptocurrency trading. It shows traders the exact price where their gains will match their costs - essentially the point where they neither lose nor profit. This insight helps them make smarter trading decisions.
By knowing their break-even point, traders can set stop-loss levels to limit losses and define profit targets that are achievable. This approach gives traders more control over their risks, making it easier to handle the market's ups and downs with confidence.
Break-even analysis in crypto trading stands apart from traditional asset trading because of the extreme price swings and the fast-paced nature of cryptocurrency markets. Crypto prices can shift dramatically in short periods, meaning traders often need to update their break-even calculations to keep up. On the other hand, traditional assets like stocks or bonds generally show steadier price trends, making break-even points easier to estimate and more reliable over time.
Another key difference is the higher transaction fees and frequent market shifts in crypto trading, which can heavily influence the break-even point. In contrast, traditional markets typically come with fixed costs and more predictable growth, simplifying expense tracking and investment planning. Recognizing these challenges is essential for navigating risks and making smarter choices in the volatile world of crypto trading.
Wallet Finder.ai helps crypto traders sharpen their break-even analysis by offering real-time insights into wallet performance, trading habits, and market trends. This information helps traders get a clearer picture of their costs, fine-tune their strategies, and spot opportunities to boost profits.
By tracking wallet activity and market shifts, the platform enables traders to tweak their trading limits and risk management plans with precision. This approach not only increases the chances of making a profit but also cuts down on potential losses, giving traders the tools to make smarter, more informed decisions.
{"@context":"https://schema.org","@type":"FAQPage","mainEntity":[{"@type":"Question","name":"How can break-even analysis help reduce risk in crypto trading?","acceptedAnswer":{"@type":"Answer","text":"<p>Break-even analysis is a handy tool for navigating the unpredictable world of cryptocurrency trading. It shows traders the exact price where their gains will match their costs - essentially the point where they neither lose nor profit. This insight helps them make smarter trading decisions.</p> <p>By knowing their break-even point, traders can set <strong>stop-loss levels</strong> to limit losses and define <strong>profit targets</strong> that are achievable. This approach gives traders more control over their risks, making it easier to handle the market's ups and downs with confidence.</p>"}},{"@type":"Question","name":"How does break-even analysis in crypto trading differ from traditional asset trading?","acceptedAnswer":{"@type":"Answer","text":"<p>Break-even analysis in crypto trading stands apart from traditional asset trading because of the <strong>extreme price swings</strong> and the <strong>fast-paced nature</strong> of cryptocurrency markets. Crypto prices can shift dramatically in short periods, meaning traders often need to update their break-even calculations to keep up. On the other hand, traditional assets like stocks or bonds generally show steadier price trends, making break-even points easier to estimate and more reliable over time.</p> <p>Another key difference is the <strong>higher transaction fees</strong> and frequent market shifts in crypto trading, which can heavily influence the break-even point. In contrast, traditional markets typically come with fixed costs and more predictable growth, simplifying expense tracking and investment planning. Recognizing these challenges is essential for navigating risks and making smarter choices in the volatile world of crypto trading.</p>"}},{"@type":"Question","name":"How does Wallet Finder.ai help crypto traders improve their break-even analysis?","acceptedAnswer":{"@type":"Answer","text":"<p>Wallet Finder.ai helps crypto traders sharpen their break-even analysis by offering <strong>real-time insights</strong> into wallet performance, trading habits, and market trends. This information helps traders get a clearer picture of their costs, fine-tune their strategies, and spot opportunities to boost profits.</p> <p>By tracking wallet activity and market shifts, the platform enables traders to tweak their trading limits and risk management plans with precision. This approach not only increases the chances of making a profit but also cuts down on potential losses, giving traders the tools to make smarter, more informed decisions.</p>"}}]}

A premier DeFi analytics platform empowering traders to discover and analyze profitable blockchain wallets, trades and tokens.

