
Recovery Factor Calculation for Smart Traders
Master the recovery factor calculation to measure a strategy's resilience. Learn the formula, see DeFi examples, and find top wallets with Wallet Finder.ai.

June 20, 2026


Wallet Finder
March 11, 2026

Trying to figure out if your crypto trades are profitable can feel like navigating a maze blindfolded. That’s where a coin profit calculator comes in. It's an essential tool that cuts through the complexity, instantly translating a messy history of transactions into simple, critical metrics like Profit and Loss (PnL) and Return on Investment (ROI).
Instead of wrestling with manual spreadsheets, a calculator automates the entire grind of tracking trades, fees, and price fluctuations. The result? You get a crystal-clear picture of how your portfolio is really performing.

If you're still plugging numbers into a spreadsheet, there's a good chance you’re working with flawed data. Manual tracking isn't just a massive time sink; it’s dangerously prone to errors that can paint a completely inaccurate picture of your financial health.
Even tiny mistakes—like forgetting a single exchange fee or slightly miscalculating your cost basis—add up. Over time, these small errors compound, leading to a warped understanding of which of your investments are actually making you money. A proper coin profit calculator is built to prevent exactly this kind of misstep.
Every crypto transaction has more moving parts than just the sticker price. Manual methods almost always miss the small-but-mighty details that directly impact your bottom line. These oversights can easily make a great trade look just okay, or worse, make a losing trade seem profitable.
Here's a list of common profit-killers that are often missed:
Tracking these variables isn't just about being a perfectionist—it's about making smart decisions. If you don't have a clear view of your net profit after all costs, you're essentially flying blind.
Think about it: imagine you invested $1,000 in Bitcoin on September 23, 2010, when it was trading for just $0.10. By 2025, with Bitcoin hovering around $90,366, that initial stake would have ballooned into an incredible $903,660,000. That's an extreme example, but it perfectly illustrates why every single detail matters.
By automating all these tedious calculations, a coin profit calculator gives you the clarity you need to stop guessing and start building a winning strategy. To dive deeper into this, check out our guide on the best practices for wallet-based profit tracking.

If you're going to trust a coin profit calculator, it pays to understand what’s going on under the hood. The math itself isn't rocket science, but it’s what reveals how every single fee, price jump, and network cost eats into your final take-home.
Let's get into the nitty-gritty. Even though a calculator handles this for you, knowing the formulas helps you sanity-check the results and really understand the mechanics of your trades.
PnL = (Current Value) - (Total Cost). A positive number means profit; negative means a loss.ROI = (PnL / Total Cost) * 100.The secret to accurate PnL and ROI is getting your Total Cost—also known as your cost basis—exactly right. This isn't just the coin's price; it's every single fee you paid to get it.
This is where most manual tracking falls apart. Forgetting to add a $5 trading fee or a $15 gas fee might not seem like a big deal, but these costs directly chip away at your PnL. On smaller trades, they can completely tank your ROI. A good coin profit calculator never misses these crucial details.
Formulas are one thing, but let's run the numbers on scenarios you've probably been in yourself. These examples show just how much those "hidden" costs can change the game.
Let's say you buy 0.02 ETH when the price is $3,000 per ETH. That’s a $60.00 purchase. Coinbase hits you with a 1.5% trading fee, which adds $0.90.
A month later, ETH hits $3,500. You decide to sell your 0.02 ETH, now worth $70.00. But there's another 1.5% fee on the way out, which is $1.05.
If you had ignored the fees, you'd think your profit was $10. That's an error of nearly 25%! Getting the full picture is critical, and you can dive deeper into how to calculate crypto profit in our dedicated guide.
Now for a classic DeFi play. You swap 0.03 ETH (worth $90 at the time) for a hot new memecoin. The network is buzzing, and the gas fee sets you back $18.
The memecoin pops, doubling in value. Your bag is now worth $180. You decide to cash out and swap it back to ETH, paying another $12 in gas.
In this trade, gas fees added up to $30—a huge slice of your potential profit. Once you see this math laid out, it becomes crystal clear why a coin profit calculator is so essential for making smart, informed decisions.
Okay, enough with the theory. Let's get practical. Using an online coin profit calculator is a dead-simple way to get quick, actionable insights without busting out a spreadsheet and pulling your hair out. These tools are fantastic for checking up on your current bags and analyzing the ghosts of trades past.
Most of these calculators keep things clean and simple. You’ll usually see a few fields: one to pick your crypto, another for your initial investment, and date selectors for when you bought and (maybe) sold. The whole point is to make it painless, letting you focus on the numbers that matter.
Garbage in, garbage out—it’s true for crypto, too. Getting accurate results means you need to feed the calculator the right info. Here’s a quick rundown of what you’ll be plugging in.
Here’s what a typical online calculator looks like. You just fill in the blanks and let it do the heavy lifting.
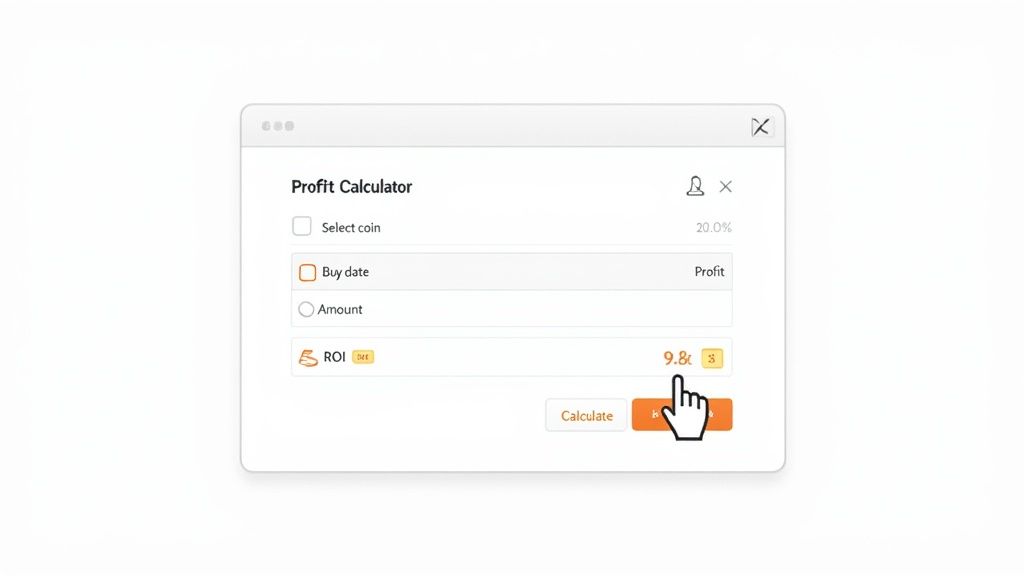
Once you’ve entered the data, the calculator will instantly spit out your profit, loss, and ROI, giving you a crystal-clear snapshot of that trade’s performance.
The real magic happens when you start playing with the numbers. The calculator will show your total profit (or loss) in dollars and your ROI as a percentage. This gives you an immediate thumbs-up or thumbs-down on a trade. And if you dollar-cost average, you might want to look into a crypto average calculator to figure out your blended entry price first.
One of the best things about these tools is running "what if" scenarios. Tweak the buy or sell dates and watch the numbers change. It's a powerful way to see how a few days could have dramatically altered your outcome and helps you sharpen your strategy for next time.
With the crypto market now sitting at a massive $2.59 trillion capitalization, these quick calculations have become a daily ritual for many. Think about it: a $10,000 investment in Ethereum during its 2015 ICO at $0.31 per ETH would be worth a mind-boggling $30.9 million today (at ~$3,094 per coin). That’s a 309,000% gain—a number a simple calculator can figure out in seconds. Tools like the one from CoinLedger make it easy to see these kinds of explosive returns without any complex math.
Your crypto portfolio probably isn't just a simple list of buys and sells. As you get more involved, you’ll likely run into other ways of acquiring tokens—like mining, staking, and airdrops—that can really complicate your profit calculations. A basic coin profit calculator might not have dedicated fields for these, but you still need to know how to account for them to keep your records straight.
With these kinds of activities, it's less about calculating profit from a purchase price and more about establishing a cost basis for assets you didn't directly buy. Nailing this is absolutely critical for tracking your actual net worth and, of course, for staying on the right side of the tax man.
Let's get one thing straight: crypto mining isn't free money. It's a business, and it comes with real-world costs that eat directly into your bottom line. To figure out if you're actually making money, you have to track every single expense and subtract it from the value of the coins you mine.
Here are the big ones you can't ignore:
The best way to think about it is this: the market value of the coins on the day you mine them is your gross revenue. Your net profit is that revenue minus all the costs above. It’s the only way to know if your mining rig is a profitable machine or a very expensive space heater.
This is why mining profitability calculators are non-negotiable. For instance, a miner with average electricity costs might discover that mining a brand new, low-difficulty coin is far more profitable than trying to compete on the insanely crowded Bitcoin network.
Just look at this screenshot from WhatToMine, a popular calculator. It shows the estimated daily profits for different coins once you plug in your electricity costs.
The numbers make it obvious. Different algorithms and coins generate wildly different returns, making these tools essential for making smart decisions about where to point your hash power.
Staking rewards and airdrops are fantastic, but they add another wrinkle. You didn't "buy" these tokens in a normal transaction, so how do you figure out your profit when you eventually decide to sell them?
The rule here is actually pretty simple: the cost basis of rewarded or airdropped tokens is their fair market value (FMV) at the exact moment you gained control of them. For tax purposes, this value is also typically treated as ordinary income for that year.
Let’s walk through a quick example.
Airdrops follow the exact same logic. The tricky part is pinning down the fair market value at the moment of receipt. While a standard coin profit calculator will make you enter this manually, more advanced portfolio trackers can automate this process for you.
Calculating past wins and losses is one thing, but the real magic happens when you use that data to build a smarter trading strategy. A good coin profit calculator is more than just a historical ledger; it becomes a powerful forecasting tool, especially when you pair it with solid on-chain intelligence.
This is where you make the leap from reactive analysis—simply measuring what happened—to proactive planning. The goal is to start modeling what could happen next, turning raw numbers into an actionable edge.
The blockchain is an open book. That means the trading histories of the most successful wallets are out there for anyone to see. Tools like Wallet Finder.ai are built specifically to surface these "smart money" players, zeroing in on wallets with a proven track record of high profitability.
Instead of guessing which tokens might pop, you can analyze the realized PnL of traders who consistently get it right. You get to see their exact entry and exit points, how much they put in, and which assets generated those massive returns.
By studying these top performers, you're tapping into strategies that are working right now, not six months ago. This isn't about blind copy-trading; it's about deconstructing successful moves to understand the logic that drove them.
Once you spot a compelling trade made by a top wallet, your coin profit calculator becomes your personal sandbox for risk assessment and strategy modeling.
The visual below gives a simplified flow of how crypto profits are generated through methods like mining, staking, and airdrops—all avenues that require diligent tracking.

Each of these methods for acquiring assets has its own cost basis and tax implications, underscoring why accurate PnL tracking is non-negotiable for a clear financial picture.
So, how do you turn all this on-chain data into a concrete plan? Here’s a practical, step-by-step workflow that bridges the gap between seeing a successful trade and deciding if a similar move is right for your portfolio.
By running these quick simulations, you turn a simple calculator into a sophisticated decision-making tool. It helps you set realistic price targets, understand your risk-reward ratio, and build a trading plan based on strategies that are already working.
Most traders who use a coin profit calculator accept whatever cost basis method the tool applies by default without realizing that the choice of method can produce dramatically different profit figures from identical trade histories. This is not a technicality. In a portfolio with multiple purchases of the same asset at different prices, two equally legitimate cost basis methods can produce profit calculations that differ by thousands of dollars on the same exit transaction. Understanding the mechanics of each method, and choosing the one that fits your situation, is one of the highest-leverage decisions in your profit tracking workflow.
Cost basis accounting matters most when you have accumulated a position through multiple purchases at different price levels, which describes the majority of active crypto traders who dollar-cost average or add to winners. The method you use determines which specific units you are treated as selling first, and that choice directly sets the taxable gain or loss for that transaction.
First In First Out (FIFO) is the most widely used cost basis method in crypto profit calculation and the default that most basic calculators apply without disclosing it. Under FIFO, when you sell a portion of your holdings, the calculator treats you as selling the oldest units you purchased first. The cost basis assigned to your exit transaction is therefore the price you paid for your earliest purchase, not your most recent one.
In a rising market, FIFO tends to produce the highest taxable gains because your earliest purchases are typically your cheapest ones. If you bought ETH at $1,200 in early 2023 and again at $2,000 in late 2023, a FIFO calculator treats any 2024 sale as disposing of the $1,200 batch first. If ETH is trading at $3,500 when you sell, your gain per unit is calculated against the $1,200 basis rather than the $2,000 basis, producing a larger reported profit.
For long-term strategic purposes, FIFO has one significant advantage: assets held for more than twelve months qualify for long-term capital gains treatment in most jurisdictions, which carries a lower tax rate than short-term gains in the United States and many other countries. If your earliest purchases have been held for over a year, using FIFO may generate larger gains on paper but at a more favorable tax rate than your more recent purchases would qualify for.
Highest In First Out (HIFO) assigns your highest-cost purchases as the units being sold first, regardless of when you acquired them. This method produces the smallest taxable gain on any given exit transaction because you are always using the most expensive basis available in your position to offset the sale price.
Using the same example, if you hold ETH purchased at $1,200 and $2,000, a HIFO calculator treats a sale as disposing of the $2,000 batch first. At a $3,500 exit price, your gain per unit is $1,500 rather than the $2,300 it would be under FIFO. Across a large portfolio with many purchases at various price levels, this difference compounds into substantial tax savings in high-profit years.
HIFO is not universally available or universally recognized, and its permissibility depends on the tax regulations of your jurisdiction. In the United States, the IRS permits specific identification of lots, which HIFO relies on, provided you maintain records sufficient to identify which specific units you disposed of. Dedicated crypto tax software that tracks individual lot identifiers makes this documentation straightforward. A basic coin profit calculator that does not support specific identification will not be able to implement HIFO correctly, which is one of the practical limitations of simple tools compared to full-featured tax platforms.
Average Cost Basis calculates your cost basis by dividing your total investment in an asset by the total number of units you hold, producing a single blended price that applies to every unit regardless of when you acquired it. This method eliminates the complexity of tracking individual lots and produces consistent, predictable basis calculations that are easy to verify manually.
The trade-off is that average cost basis rarely produces the optimal tax outcome in either direction. It does not capture the low-basis advantage of FIFO's long-term holding qualification, and it does not minimize gains the way HIFO does. It sits between the two in most scenarios, producing a moderate gain calculation that is neither the most favorable nor the least favorable method available.
Average cost basis is best suited for traders who prioritize simplicity and consistency over optimization, and for situations where the price variance between purchase batches is small enough that the method difference is immaterial. If you have accumulated a position through many small purchases over a long period with significant price variation, the difference between average cost and HIFO can be substantial, and accepting the simpler method without evaluating the alternative means potentially overpaying in taxable gains.
The practical decision framework for cost basis method selection involves two inputs: your jurisdiction's permissible methods and your portfolio's specific purchase history. If you are operating in a jurisdiction that only recognizes FIFO, the decision is made for you. If specific identification is permitted, the question becomes whether your purchase history produces a meaningful difference between methods, which is worth calculating before your next significant exit.
Run your trade history through each available method and compare the resulting gain figures before committing to a method for the tax year. If the difference is immaterial, FIFO's administrative simplicity makes it the reasonable default. If HIFO produces a significantly lower gain, the documentation requirement is a modest administrative cost for meaningful tax savings. Most dedicated crypto tax platforms allow you to toggle between methods and preview the tax impact before filing, which eliminates the guesswork entirely.
When you start digging into crypto profit tracking, a few questions always pop up. Even with a great coin profit calculator on hand, knowing the little details can make a huge difference in how accurate and useful your results are. Let's tackle some of the most common sticking points.
Getting these practical concerns sorted out means you can use any calculator with confidence, whether you're just reviewing an old trade or mapping out your next big move.
Most solid coin profit calculators are built for a global audience. They'll let you plug in your initial investment in your local fiat—whether that's USD, EUR, or GBP—and then spit out your final profit in that very same currency.
So how does that work behind the scenes? The tool taps into historical exchange rate data for both the crypto asset and your chosen fiat. When you punch in your purchase date, it fetches the crypto's price from that day, figures out how many coins your investment would have snagged, and then tracks its value all the way to the present, converting it back to your home currency for a clean, easy-to-read PnL.
For a quick look back at a past trade, most free online calculators are surprisingly accurate. They get their price data from reliable heavyweights like CoinGecko or CoinMarketCap, so the core numbers you're working with are solid.
But here’s the catch: a calculator is only as good as the numbers you feed it. Its accuracy is completely dependent on your inputs. If you want a truly precise PnL, you have to manually account for all the extra costs like trading fees, network gas fees, and slippage, because most basic calculators don't have dedicated fields for that stuff.
For anything official, especially tax reporting, you really need to step up to dedicated crypto tax software. These platforms can pull your entire transaction history directly from exchanges, guaranteeing every single fee is accounted for without you having to lift a finger.
At its core, a standard coin profit calculator is a historical analysis tool. It’s fantastic for telling you what you would have earned on a past investment or what your current unrealized profit looks like. What it can't do is predict where an asset's price is headed next.
However, that doesn't mean it's useless for planning. You can use it to run "what-if" scenarios, which is an incredibly powerful way to map out your strategy. By plugging in hypothetical future sale prices, you can model different outcomes. For instance, you can ask, "If Bitcoin hits $100,000, what's my ROI on the stash I'm holding now?" This is the perfect way to set realistic price targets and build an exit plan that aligns with your own financial goals.
Dollar-cost averaging, where you buy a fixed dollar amount of an asset on a regular schedule regardless of its price, produces a position with multiple cost basis entries that a simple single-trade calculator cannot handle directly. The correct approach requires calculating a weighted average entry price that reflects all of your purchases proportionally.
The weighted average entry price is calculated by summing the total dollar amount invested across all purchases and dividing it by the total number of units acquired across those same purchases. If you bought $200 worth of ETH when it was at $2,000 per ETH, acquiring 0.1 ETH, and then bought another $200 worth when it was at $2,500 per ETH, acquiring 0.08 ETH, your total investment is $400 and your total holdings are 0.18 ETH. Your weighted average entry price is $400 divided by 0.18 ETH, which equals approximately $2,222 per ETH.
This weighted average is the number to use as your cost basis input when calculating the profit on any partial or full exit from a DCA position. Using only your most recent purchase price or your earliest purchase price produces an inaccurate profit figure that will either understate or overstate your actual gain. The weighted average captures the full economic reality of the position across all of its component purchases and is the correct input for both your profit calculator and your tax records. Many dedicated portfolio trackers automate this calculation by aggregating all purchases of the same asset before displaying your average entry price, which eliminates the manual calculation step for complex DCA positions.
These two metrics answer different questions about your portfolio and both deserve regular attention, though they inform different kinds of decisions.
Realized profit is the gain or loss you have locked in by completing a round-trip trade: buying an asset and then selling it. Once a trade is closed, the profit or loss is permanent, it appears in your tax records, and it is the only form of profit that has actually changed your net worth in cash terms. Your realized PnL across your full trading history is the definitive measure of your trading performance because it represents money you have actually made or lost rather than money you might make or lose depending on future price movement.
Unrealized profit is the gain or loss on positions you currently hold but have not yet closed. It represents what you would receive if you sold at the current market price, less your cost basis. Unrealized profit is inherently provisional: it can expand, contract, or reverse entirely before you exit the position. Tracking it gives you a real-time picture of your portfolio's current market value and helps you assess whether open positions are moving in your favor, but it should not be treated as earned performance until it is locked in by a sale.
The practical answer to which you should track is both, for different purposes. Track realized profit as your definitive performance record and the basis for all tax reporting. Track unrealized profit as a real-time portfolio valuation tool and a decision input for managing open positions, particularly for setting profit-taking levels and evaluating whether current price levels justify holding or trimming. Most coin profit calculators display both metrics separately, and maintaining the distinction between them in your own thinking prevents the common error of counting open-position gains as realized performance before they are actually secured.
Cryptocurrency received as payment for goods or services occupies a different cost basis category than crypto you purchased with fiat, and the distinction matters significantly for both profit calculation and tax treatment.
When you receive crypto as payment, the fair market value of the crypto at the time you received it is the cost basis for that batch of tokens and is simultaneously the amount of income you must recognize for tax purposes in most jurisdictions. If someone pays you 0.05 ETH for a service and ETH is trading at $3,000 at the time of payment, you have received $150 worth of income and your cost basis in that 0.05 ETH is $150.
The profit calculation on a subsequent sale of that ETH is then straightforward: if you later sell the 0.05 ETH when it is trading at $4,000, you receive $200 and your gain is $50, which is the difference between the $200 sale proceeds and the $150 cost basis established at the time of receipt. The original $150 was already recognized as income when you received the payment, so taxing it again as a capital gain would constitute double taxation, which is why the step-up in basis to fair market value at receipt is the correct treatment.
The practical tracking requirement is that you must record the fair market value of every crypto payment you receive at the exact time of receipt, because that value cannot be reconstructed accurately after the fact if the asset's price has moved. A dedicated record of payment receipts with timestamps, amounts, and the verified market price at each timestamp is the documentation required to substantiate your cost basis in payment-received tokens if your records are ever reviewed.
Ready to stop guessing and start learning from the pros? Wallet Finder.ai surfaces the most profitable traders on-chain, giving you the data to model winning strategies. Discover what smart money is buying and selling in real time. Start your 7-day trial of Wallet Finder.ai today.

A premier DeFi analytics platform empowering traders to discover and analyze profitable blockchain wallets, trades and tokens.

