
Recovery Factor Calculation for Smart Traders
Master the recovery factor calculation to measure a strategy's resilience. Learn the formula, see DeFi examples, and find top wallets with Wallet Finder.ai.

June 20, 2026


Wallet Finder
March 7, 2026

Figuring out your crypto profit seems simple on the surface, but the devil is truly in the details. At its heart, the math is just your final sale price minus your total cost. While the basic formula is straightforward, getting the inputs right is what separates a guess from an accurate calculation.
The Basic Profit Formula:Sale Price - Cost Basis = Profit / Loss
A solid grip on this concept is the bedrock for everything else, especially before you start wading into complex trades and tax scenarios. This guide provides actionable steps and clear examples to ensure you can calculate your gains and losses with confidence.

Before you can confidently say how much you've made or lost, you need to master two key ideas: Cost Basis and Proceeds from Sale. Think of them as the two pillars holding up every profit calculation you'll ever make.
Your true cost basis is the sum of what you paid for the asset plus any and all fees it took to acquire it. Keeping meticulous records is vital because every fee you track helps lower your taxable profit.
Here’s an actionable checklist of what to include in your Cost Basis:
Actionable Example:Imagine you bought Bitcoin for $100,000, paid a $20 exchange fee, and later sold it for $120,000.
It might seem like a small difference, but these amounts compound quickly across multiple trades.
Key Takeaway: Every fee you pay to acquire crypto increases your cost basis. Ignoring these "small" amounts will cause you to over-report your profits and, in turn, potentially overpay on your taxes.
This simple framework is the foundation for every trade, from your very first crypto purchase to the most complex DeFi swap.
This table summarizes the essential terms and their roles in calculating your net profit or loss.
TermDefinitionExampleProceeds from SaleThe total cash value you receive when you sell your crypto.You sell 0.5 BTC for $35,000.Cost BasisThe original purchase price plus all associated acquisition fees.You bought that 0.5 BTC for $30,000 + $50 in fees = $30,050.Realized Profit/LossThe difference between your proceeds and your cost basis.$35,000 - $30,050 = $4,950 Profit.
Once you've mastered this basic formula, you've laid the groundwork for more advanced calculations. It's the same principle that underpins concepts like the ones we cover in our guide on break-even analysis for crypto trades.
Calculating your crypto profits would be simple if every transaction was a clean buy or sell. But reality is a messy web of fees and different transaction types that can complicate your P&L. Ignoring these costs is the fastest way to get a skewed view of your portfolio's performance.
To get a true picture of your profitability, you must track every single cost tied to buying, holding, and selling an asset. Most traders fixate on the exchange's trading fee, but a ton of other costs can quietly eat into your bottom line.
Here are the most common fees to track:
Pro Tip: Stop thinking of these fees as separate expenses. They are part of the total price you paid for the asset. This mindset shift doesn't just give you an accurate profit figure; it's also how you need to handle things for proper tax reporting.
Swapping one crypto for another—like trading ETH for an altcoin—is one of the most common actions in crypto. But this isn't a simple, neutral exchange. In most jurisdictions, it's a taxable event. You're effectively "selling" the first asset and immediately "buying" the second one.
Let's walk through an actionable scenario.
Imagine you originally bought 1 ETH for $2,000 (including all fees). This is your cost basis. A few months later, you swap that 1 ETH for 5,000 units of a new altcoin, NEWCOIN.
$3,000 - $2,000 = $1,000 profit. You will likely owe taxes on this gain.$3,000 / 5,000 = $0.60.When you eventually sell your NEWCOIN, your profit will be calculated from that $0.60 cost basis, not from zero.
Providing liquidity in DeFi is another area where things get tricky. When you add assets to a liquidity pool (LP), you receive LP tokens in return. This action is often treated as a disposal of your original assets.
Imagine you add $1,000 of ETH and $1,000 of USDC to a liquidity pool.
When you withdraw your liquidity, your profit or loss is the difference between the $2,000 cost basis of your LP tokens and the market value of the assets you receive back. Any fees you earn are typically counted as income.
Once you have a handle on calculating your cost basis for individual trades, the next layer of complexity is taxes. Tax authorities like the IRS require you to use a consistent accounting method to determine which specific coins you sold. This isn't just a technicality—it can drastically change your reported profit and tax bill.
The method you pick determines the cost basis you use when selling a portion of your crypto that was bought at different times and prices. Getting this right is a huge part of learning how to calculate crypto profit accurately for official reporting.
There are three main methods for tracking the cost basis of your crypto: First-In, First-Out (FIFO), Last-In, First-Out (LIFO), and Highest-In, First-Out (HIFO). Each one works on a different assumption about which assets you sold, leading to different profit outcomes.
Crucial Note: Always check which methods are permitted in your country. The IRS, for example, has historically pointed traders toward specific identification or FIFO, while LIFO is often not permitted for crypto in the U.S.
The decision tree below gives you a visual for tracking costs across different transaction types.

This highlights the importance of correctly identifying your transaction type so you can be sure every cost is added to your cost basis before applying an accounting method.
Let's walk through a scenario. Imagine you made three separate Bitcoin purchases:
You then sell 1 BTC for $35,000. The sale price is the same, but your calculated profit will be completely different depending on your accounting method.
Key Insight: Your choice of accounting method directly impacts your capital gains. A strategic choice can legally minimize your tax liability for a given year, while a poor or inconsistent choice can lead to overpaying.
Manually applying these rules across hundreds of trades is a nightmare. This is why many traders use specialized tools. If you're looking for one, our guide on the best crypto portfolio tracker apps is a great place to start.
The table below breaks down how our example sale of 1 BTC for $35,000 would be treated under each method, illustrating how the same trades can produce vastly different taxable gains.
Accounting MethodHow It WorksImpact on Taxable Gains (Example)Best ForFIFOAssumes you sold the first BTC you bought (the one from January).$15,000 Profit ($35,000 Sale - $20,000 Cost Basis)Long-term investors in a bull market, as it often results in higher long-term capital gains, which are taxed at a lower rate.LIFOAssumes you sold the last BTC you bought (the one from December).$5,000 Profit ($35,000 Sale - $30,000 Cost Basis)Traders in a rising market looking to report lower immediate profits. However, it's not always accepted by tax authorities.HIFOAssumes you sold the most expensive BTC you bought (the one from June).$5,000 Loss ($35,000 Sale - $40,000 Cost Basis)Actively managing your tax liability, as it prioritizes selling high-cost assets to realize losses or minimize gains.
As you can see, the same transaction resulted in a $15,000 profit, a $5,000 profit, or even a $5,000 loss. This is precisely why picking—and consistently using—an accounting method is a core part of accurately calculating and reporting your crypto profits.
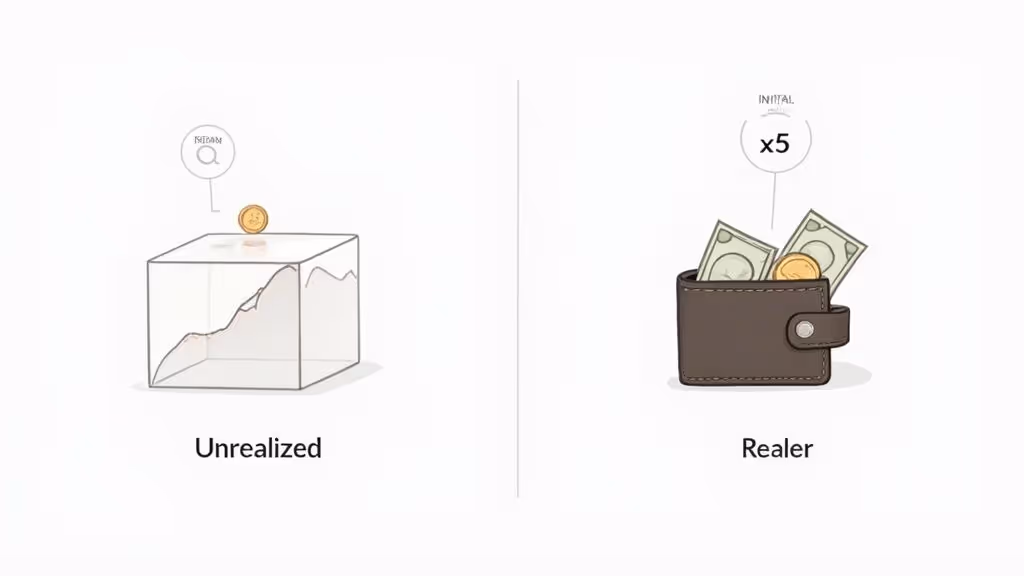
If you only look at closed trades, you're missing half the picture. While your realized gains are what matter for taxes, your unrealized gains—your "on-paper" profits—are what should drive your strategy.
Your unrealized Profit and Loss (P&L) is the current market value of your assets minus their cost basis. It's a live number showing the potential profit you could lock in if you sold that second. For example, if you bought 1 ETH for $2,000 and it's now trading at $3,500, you have a $1,500 unrealized gain. This metric tells you when it might be time to take profits or cut losses.
Leveraged trading introduces new layers to your P&L calculations. You are now playing with borrowed money and must track additional fees.
Key terms for leveraged trading include:
Forgetting to account for funding rates is a common mistake that can seriously distort your profit calculations for a leveraged trade.
Expert Insight: Leverage is a double-edged sword. It magnifies wins and losses. With 10x leverage, a 10% market move against you can wipe out your initial margin. Meticulous P&L tracking isn't just for taxes—it's a critical risk management tool.
Let's say you open a $10,000 long position on Bitcoin with 10x leverage at a price of $50,000 per BTC.
Opening the Position:
Bitcoin rallies to $52,000, and you close the position.
Closing the Position & Calculating Profit:The value of your position is now $10,400 (a 4% price increase). Here’s the final math breakdown.
MetricCalculationValueGross ProfitNew Position Value - Original Position Value$10,400 - $10,000 = $400Trading Fees(Entry + Exit Fees, e.g., 0.05% each)$10,000 * 0.0005 + $10,400 * 0.0005 = $10.20Funding Fees Paid(Sum of all funding payments)Let's assume you paid $5.00 in total.Net ProfitGross Profit - Trading Fees - Funding Fees$400 - $10.20 - $5.00 = $384.80
Your net profit is $384.80. Your Return on Investment (ROI) is based on your $1,000 initial margin, making your actual return a massive 38.48%. This shows how every fee must be accounted for to get a true read on profitability.

Let's be honest: Manually tracking hundreds of trades, swaps, and gas fees in a spreadsheet is a nightmare. It’s tedious and a recipe for costly mistakes. This is why automation tools have become non-negotiable for any serious trader. Crypto portfolio trackers and tax software are built to tame this complexity. For those starting out, 8 Actionable Crypto Trading Strategies for Beginners in 2025 offers practical steps to trade smarter and avoid common pitfalls.
These tools connect directly to your exchange accounts and public wallet addresses via secure API keys, automatically syncing your entire transaction history into a unified dashboard.
Not all trackers are equal. When choosing a platform, look for these essential features:
Key Takeaway: The goal of automation is to slash human error and reclaim your time. A solid tool should handle the grunt work of data aggregation and calculation, freeing you to focus on strategy, not data entry.
The best systems don't just collect your data; they turn it into actionable intelligence. For instance, a top-tier platform can generate detailed tax reports, like the IRS Form 8949, with a few clicks, saving hours of work and potential accounting fees.
On a larger scale, firms like Chainalysis use similar principles of data aggregation. They perform deep analysis of on-chain data to estimate crypto gains by country, tracking the movement of crypto to and from services where it can be converted to fiat. By measuring the difference between the dollar value of these withdrawals and deposits, they estimate the total gains realized across regions.
Advanced tools are a necessity for anyone operating at scale, and the concepts are just as crucial for individual DeFi traders. It's why we put together a detailed guide to PnL tracking for DeFi traders to get you started.
Simple math errors can snowball into bad trades and painful tax surprises. If you want to know how to calculate crypto profit the right way, you first have to know how to sidestep common pitfalls.
Here is a list of common mistakes and how to avoid them:
Crucial Tip: Inconsistent record-keeping is the root of almost every calculation error. The inaccuracies pile up until they're nearly impossible to untangle.
By actively avoiding these common mistakes, you can be confident your profit calculations are both accurate and defensible.
The profit calculation methods covered so far assume a relatively simple scenario: you buy an asset once at a known price, pay fees, and eventually sell it. The mechanics become significantly more complex when you buy the same asset multiple times at different prices, which is the reality for anyone using a Dollar-Cost Averaging strategy, averaging down into a position during a dip, or building a long-term holding incrementally. In these scenarios, the single-entry cost basis formula breaks down, and you need a different approach: weighted average cost basis calculation.
Most beginner guides either ignore this scenario entirely or point you toward automation tools without explaining the underlying math. Understanding how weighted average cost basis works gives you two important advantages. First, it lets you verify that your tracking software is calculating correctly. Second, it gives you the conceptual foundation to handle edge cases that automated tools sometimes misclassify, such as partial sells from a multi-entry position or the disposal of a position accumulated across different exchanges.
Weighted average cost basis is calculated by dividing the total amount of money you spent acquiring an asset (including all fees) by the total number of units you acquired. The result is a single average cost per unit that reflects the blended price across all your purchases.
The formula is:
Weighted Average Cost Per Unit = Total Amount Spent (including all fees) ÷ Total Units Acquired
Once you have the weighted average cost per unit, calculating profit on any partial or full sale uses the same fundamental formula as a single-entry trade:
Profit = (Sale Price × Units Sold) − (Weighted Average Cost Per Unit × Units Sold) − Sale Fees
The critical discipline is updating your weighted average cost basis every time you make an additional purchase, before you record any subsequent sale. Failing to update it means every profit calculation after the second purchase will be wrong.
Let's build a realistic scenario. Imagine you use a monthly DCA strategy to accumulate Bitcoin over three months, then sell a portion of your position.
The Purchases:
Entry 1: You buy 0.1 BTC for $5,000 and pay a $10 exchange fee. Your total cost for this purchase is $5,010.
Entry 2 the following month: You buy another 0.1 BTC for $4,500 and pay a $9 exchange fee. Your total cost for this purchase is $4,509.
Entry 3 the month after: You buy a further 0.1 BTC for $5,500 and pay an $11 exchange fee. Your total cost for this purchase is $5,511.
Calculating the Weighted Average Cost Basis:
Total amount spent across all three purchases: $5,010 + $4,509 + $5,511 = $15,030
Total units acquired: 0.1 + 0.1 + 0.1 = 0.3 BTC
Weighted average cost per BTC: $15,030 ÷ 0.3 = $50,100 per BTC
The Partial Sale:
Two months later, Bitcoin is trading at $58,000 and you decide to sell 0.15 BTC to take partial profits. Your exchange charges a $12 fee on the sale.
Gross proceeds from the sale: 0.15 × $58,000 = $8,700
Cost basis for the units sold: 0.15 × $50,100 = $7,515
Net profit: $8,700 − $7,515 − $12 = $1,173
The Remaining Position:
After the sale, you still hold 0.15 BTC. Importantly, your weighted average cost basis per unit does not change because of the sale. You still paid a weighted average of $50,100 per BTC for the units you hold. The cost basis of your remaining 0.15 BTC position is 0.15 × $50,100 = $7,515.
This is a point that consistently confuses traders. Many mistakenly recalculate their cost basis after a partial sale or believe the sale somehow resets it. Under the weighted average method, the cost basis per unit is fixed by what you paid when you bought, not affected by when or how much you sell.
Choosing between weighted average and FIFO doesn't just affect which formula you use. It can produce meaningfully different profit numbers from the identical underlying trades, which has direct implications for your tax liability.
Using the same three-entry example above, let's compare how the partial sale of 0.15 BTC would be calculated under FIFO versus weighted average.
Under FIFO, the sale of 0.15 BTC is treated as disposing of the oldest units first. You would first sell all 0.1 BTC from Entry 1 (cost basis $50,100 per BTC) and then 0.05 BTC from Entry 2 (cost basis $45,090 per BTC).
Cost basis under FIFO: (0.1 × $50,100) + (0.05 × $45,090) = $5,010 + $2,254.50 = $7,264.50
Net profit under FIFO: $8,700 − $7,264.50 − $12 = $1,423.50
Under weighted average, as calculated above, the net profit is $1,173.
The same sale, the same asset, the same prices, and the same fees produce a profit figure that differs by $250.50 depending solely on the accounting method. At scale, across hundreds of trades and thousands of units, these differences become substantial. This comparison illustrates why selecting and consistently applying a single accounting method is not a bureaucratic formality. It is a meaningful financial decision with real-world tax consequences.
A complexity that the worked examples above sidestep is the scenario where you've purchased the same asset across different exchanges and then sell from a specific exchange's wallet. This is common among traders who use both centralized and decentralized platforms, or who have moved assets between wallets across multiple purchase events.
The practical issue is that your weighted average cost basis is a portfolio-level figure, but your sale might be recorded against a specific exchange account that only sees a subset of your total purchase history. If your tax software or portfolio tracker doesn't have visibility into all your purchase entries, it will calculate an incorrect cost basis for the sale.
The solution is to treat all purchases of the same asset as a single pool for cost basis purposes, regardless of which exchange or wallet the units currently reside in. Before calculating profit on any sale, consolidate your complete purchase history for that asset across all platforms and wallets, recalculate the portfolio-level weighted average cost basis, and apply that figure to the sale. This approach produces a defensible and accurate profit figure even when your holdings are distributed across multiple accounts.
Record-keeping discipline is the prerequisite for this approach. Every purchase entry needs to be logged with the date, units acquired, total cost including all fees, and the platform where the purchase occurred. A single missing entry corrupts the weighted average calculation for every subsequent sale. If you discover a missing entry after the fact, reconstruct it from exchange statements or blockchain transaction records before recalculating.
For traders who make many purchases at varying prices, weighted average cost basis tends to produce a more stable and predictable profit figure than FIFO, LIFO, or specific identification because it smooths out the extremes. The lowest-cost purchase and the highest-cost purchase both get averaged into the pool rather than potentially being selected as the disposal basis at a tax-inconvenient moment.
Specific identification is the most powerful method for tax optimization because it lets you choose exactly which units you're selling. You can designate your highest-cost-basis units as the ones being disposed of, maximizing the cost basis deducted against the sale price and thereby minimizing your reported profit. The trade-off is that specific identification requires immaculate records at the individual-lot level and needs to be actively managed at the time of each sale, not reconstructed afterwards.
For most DCA investors and long-term accumulators, the administrative overhead of specific identification isn't justified unless you're operating at a scale where the tax savings materially exceed the cost of the additional record-keeping. Weighted average cost basis provides a reasonable approximation that is straightforward to apply consistently across a large number of transactions. Check with a qualified tax professional in your jurisdiction, as the methods permitted and the definitions applied to them vary by country.
Every calculation method covered in this guide depends on the accuracy of your input data: purchase prices, sale prices, and fees. When that input data comes entirely from exchange records and portfolio tracker imports, there is a category of error that can go undetected: discrepancies between what an exchange reports and what actually happened on the blockchain. On-chain profit verification closes this gap by using the permanent, immutable record of the blockchain itself as a cross-reference against your calculated figures.
Beyond error detection, on-chain data enables something no traditional accounting method can provide: the ability to benchmark your actual profit performance against the real, documented returns of the most profitable wallets in the market. This transforms profit calculation from a backward-looking accounting exercise into a forward-looking strategic tool that tells you not just what you made, but how your results compare to what the best participants in your trading category are achieving.
Exchange-reported transaction data is generally reliable, but it is not infallible. Common categories of discrepancy between exchange records and on-chain reality include gas fee misattribution, failed transaction fees, bridge transaction costs, and protocol-level fees embedded within DeFi interactions that exchanges don't surface in their transaction histories.
Gas fee misattribution is the most frequent source of cost basis understatement. When you execute a transaction on Ethereum or another EVM-compatible chain, the gas fee is paid directly from your wallet to the network validators, not through the exchange's fee processing system. Many exchanges only report their own platform fees in transaction records and do not capture the network-level gas cost. If your portfolio tracker is importing only exchange data, it is likely missing gas fees on every on-chain transaction, systematically understating your true cost basis.
The practical consequence is that your reported profits are slightly overstated on every gas-inclusive transaction, and your tax-deductible costs are understated. Over hundreds of DeFi transactions with Ethereum gas fees ranging from a few dollars to over $100 per transaction depending on network congestion, the cumulative understatement can be substantial.
Failed transaction fees represent a different category. On Ethereum and similar chains, a failed transaction still consumes gas. If your on-chain activity includes failed transactions due to slippage tolerance settings, insufficient gas limits, or contract execution errors, those gas costs are real expenditures that belong in your cost basis records. Exchange records will typically show no corresponding transaction because nothing was executed from the exchange's perspective, but the blockchain record shows the gas expenditure clearly.
To cross-check your exchange-reported data against on-chain records, look up your wallet addresses on a block explorer such as Etherscan for Ethereum activity or Solscan for Solana. Filter the transaction history by the same date ranges as your exchange records and compare the total fees paid on-chain against the fees your portfolio tracker has recorded. Any systematic gap between the two indicates a category of costs that is being missed in your profit calculations.
Block explorers provide transaction-level data, but dedicated on-chain analytics platforms go further by aggregating your wallet's complete transaction history into a calculated profit and loss view. These platforms pull every buy, sell, transfer, and fee payment associated with a wallet address and apply cost basis accounting to produce a realized and unrealized P&L figure.
The value of comparing this on-chain P&L against your exchange-reported P&L is that it creates two independent calculations of the same underlying activity. Where they agree, you have high confidence in your figures. Where they diverge, you have identified a specific transaction or fee category that needs investigation.
The most common sources of divergence between on-chain and exchange-reported P&L are transfers treated as taxable disposals when they should be non-taxable wallet moves, DeFi protocol fees not captured by the exchange integration, and staking reward income recorded at the wrong fair market value date. Each of these divergence categories has a different resolution: transfers need to be reclassified, DeFi fees need to be manually added to the affected transactions' cost basis, and staking income needs to be re-dated to the actual receipt block.
This reconciliation process is most practically performed quarterly rather than at year-end. Catching discrepancies when they're three months old is dramatically easier than untangling a year's worth of compounded errors in the weeks before a tax filing deadline.
Knowing your total profit in dollar terms tells you what you made. Knowing how your return compares to the most profitable active traders in the same market tells you how efficiently you made it and where the largest performance gaps exist. This is the strategic dimension of profit calculation that no accounting guide covers, because it requires access to on-chain wallet analytics rather than just your own transaction records.
Smart money wallets are addresses with documented histories of consistent profitable trading across multiple assets and market cycles. Their on-chain transaction histories are publicly accessible, which means their realized profit percentages, holding durations, average entry timing relative to price movements, and win rates across different trade categories are all calculable and comparable to your own figures.
The benchmarking framework works by extracting the same profit metrics from your own wallet that you would calculate from a top-performing reference wallet: realized profit as a percentage of deployed capital, average holding duration for profitable versus losing trades, win rate across closed positions, and average size of winning trades relative to losing trades. Comparing these figures side-by-side reveals where your trading behavior diverges most from the patterns associated with consistent profitability.
The most consistently revealing benchmarking insight for traders who are making money but underperforming their potential is holding duration asymmetry: the pattern of cutting profitable positions short while holding losing positions too long. When you calculate your average holding duration for closed profitable trades versus closed losing trades, and the profitable trades have a shorter average duration than the losing trades, you've identified a behavioral pattern that is reliably costing you returns. The on-chain record makes this visible in a way that subjective memory of your trading history never could.
Beyond benchmarking your existing returns, on-chain wallet analytics enables a form of counterfactual profit analysis: looking at the transactions made by profitable wallets that you observed but didn't act on, and calculating what your profit would have been if you had. This is not an exercise in regret. It is a systematic way to identify which categories of on-chain signals you are consistently identifying late or underweighting, so you can adjust your research and entry process accordingly.
If a pattern emerges where you are entering positions in assets that smart money wallets bought two or three days earlier, and the price gap between their entry and yours represents a meaningful difference in your realized profit percentage, that gap has a specific cause. The most common causes are over-reliance on social confirmation before entering a position, insufficient monitoring of on-chain accumulation signals, or a research process that requires too many confirmation layers before acting on an identified opportunity.
Each of these causes has a different solution, but none of them can be identified without the on-chain data that makes the timing comparison possible. Your exchange records tell you when you bought and at what price. The on-chain analytics tell you when the best traders bought the same asset and at what price. The difference between those two data points is the quantified cost of your information lag, expressed directly in forgone profit per trade.
Realized profit percentage benchmarked against a reference group of consistently profitable wallets is one of the most actionable metrics available to a developing trader precisely because it converts an abstract ambition ("trade like the best") into a specific, measurable gap that has identifiable behavioral and process causes. Once you can see the gap in numbers, you can start working backward from the data to find the process changes that close it.
Ready to cross-check your profit calculations against on-chain data and benchmark your returns against the most profitable wallets in real time? Wallet Finder.ai gives you direct access to smart money wallet analytics, on-chain P&L tracking, and the historical transaction data needed to turn your profit calculations into a genuine performance improvement tool.
Even with the basics down, specific situations can be tricky. Here are answers to common questions about how to calculate crypto profit.
A crypto-to-crypto swap is a taxable event in most jurisdictions. It is considered a disposal of the first asset and an acquisition of the second.
To calculate the profit:
No. Unrealized gains (or "paper profits") are not taxable. A taxable event only occurs when you realize the gain by selling, trading, or otherwise disposing of your crypto. While you don't owe taxes on unrealized gains, tracking this metric is crucial for smart portfolio management as it shows your potential tax liability.
Key Takeaway: While unrealized gains won't send you a tax bill, they're a vital metric for making strategic decisions. If you ignore them, you're flying blind with an incomplete picture of your portfolio's real performance.
While a spreadsheet is a start, it quickly becomes unmanageable. For accuracy and sanity, the easiest path is to use a specialized crypto portfolio tracker and tax software.
These platforms help by:
Automation is the most reliable way to keep a perfect record of your crypto activity, ensuring your profit calculations are always spot-on.
When you hold multiple purchase entries for the same asset, you need to calculate a weighted average cost basis before you can accurately calculate profit on any sale.
The formula is straightforward: add together the total amount you spent across all purchases of that asset, including every fee associated with each purchase. Then divide that total by the total number of units you acquired across all entries. The result is your weighted average cost per unit.
When you sell any portion of the position, multiply the number of units you're selling by your weighted average cost per unit to get the cost basis for that sale. Subtract the cost basis and any sale fees from your gross proceeds to get your net profit.
For example: if you bought 0.3 BTC across three purchases for a total all-in cost of $15,030, your weighted average cost is $50,100 per BTC. If you later sell 0.15 BTC for $8,700 with a $12 fee, your net profit is $8,700 minus (0.15 × $50,100) minus $12 = $1,173.
Remember to update your weighted average each time you make a new purchase of the same asset, but not when you sell. Selling units from a position does not change the weighted average cost basis per unit for the remaining holdings.
Discrepancies between on-chain profit figures and exchange-reported figures typically fall into three categories.
The most common is missing gas fees. Network-level transaction fees on chains like Ethereum are paid directly from your wallet to validators, not through the exchange's fee system. Many exchanges only report their own platform fees, leaving network costs out of the transaction record entirely. Over time, this causes your portfolio tracker to systematically understate your true cost basis, which overstates your calculated profit.
The second category is failed transaction fees. On Ethereum and similar chains, a failed transaction still consumes gas. These costs are real expenditures that belong in your records, but since no trade executed, they typically don't appear in exchange transaction histories.
The third category is DeFi protocol fees embedded within smart contract interactions. When you interact with a liquidity pool, lending protocol, or yield aggregator, some fees are deducted at the contract level and never surface in exchange records.
To check for discrepancies, compare the total fees your wallet address paid on-chain during a specific period, visible through a block explorer, against the fees your portfolio tracker has recorded for the same period. Any gap represents costs that need to be added to your cost basis records.
Publicly available on-chain data means that the realized profit figures, entry timing, holding durations, and win rates of other wallets are all calculable by anyone who knows how to read blockchain transaction data.
The practical use of this for your own profit calculation practice is benchmarking. By comparing your own realized profit metrics against those of consistently high-performing wallets trading in the same assets and market conditions, you can identify specific gaps between your performance and theirs.
The two most actionable benchmarking comparisons are entry timing and holding duration asymmetry. Entry timing comparison shows you whether consistently profitable wallets were buying the assets you traded days before you did, and quantifies how much of your profit was lost to that lag. Holding duration asymmetry analysis compares your average hold time on winning trades versus losing trades. When profitable trades are closed significantly faster than losing trades, it indicates a behavioral pattern of cutting winners short and letting losers run, which is one of the most common and quantifiably costly patterns in retail crypto trading.
On-chain wallet analytics platforms make this comparison accessible without requiring you to manually parse blockchain transaction records. The output is a set of specific, measurable performance gaps that can be traced to concrete changes in your research process, entry criteria, or exit discipline.
Ready to stop guessing and start tracking your crypto portfolio like a pro? With Wallet Finder.ai, you can discover profitable wallets, get real-time trade alerts, and see the PnL of top traders. Start your 7-day trial and turn on-chain data into actionable insights.

A premier DeFi analytics platform empowering traders to discover and analyze profitable blockchain wallets, trades and tokens.

