
Recovery Factor Calculation for Smart Traders
Master the recovery factor calculation to measure a strategy's resilience. Learn the formula, see DeFi examples, and find top wallets with Wallet Finder.ai.

June 20, 2026


Wallet Finder
March 8, 2026
A crypto average calculator is a tool that tells you the true average price you paid for a cryptocurrency after buying it multiple times. This number, known as your cost basis, is essential for tracking profits, making smarter trades, and dealing with taxes without having to guess.

Let's be honest—keeping track of your crypto portfolio gets messy, and it gets messy fast. You buy some Bitcoin today, snag a bit more next week during a dip, and suddenly you have no real clue what your actual entry price is. Trusting your memory or a rough estimate is a common trap, and in a market this volatile, it's an expensive one.
This is exactly where a crypto average calculator becomes one of your most valuable tools. It slices through the confusion and gives you a single, powerful number: your cost basis. This figure represents the true weighted average price you've paid for a coin, factoring in all your different purchases and even those pesky fees.
To really get a handle on this, it helps to know the lingo. These are the core components you'll be working with every time you calculate your average cost.
TermWhat It Means for YouSimple ExampleCost BasisThe total amount you've spent to acquire a crypto asset, including all fees. It's your financial starting line.You bought 1 ETH for $3,000 and paid a $20 fee. Your cost basis is $3,020.Average PriceThe per-unit cost of your holdings. It's your total cost basis divided by the total number of coins you own.If you have 2 ETH with a total cost basis of $6,000, your average price is $3,000 per ETH.Weighted AverageA calculation that considers both the price and the quantity of each purchase to find a true average.Buying 1 ETH at $3,000 and 0.5 ETH at $2,800 gives you a weighted average price, not a simple average of the two prices.Profit/Loss (P/L)The difference between the current market value of your holdings and your total cost basis.If your ETH is now worth $7,000 and your cost basis was $6,000, you have a $1,000 unrealized profit.
Getting these terms down makes every other step feel much more intuitive. You're no longer just looking at numbers; you're understanding the story they tell about your investment.
Without an accurate cost basis, you're flying blind. You might feel like you're in profit when you’re actually at a loss, or the other way around. This lack of clarity leads directly to bad decisions, like selling way too early or holding on too long because your assumptions are flawed.
A precise cost basis is the foundation of effective portfolio management. It transforms ambiguous feelings about your investments into concrete data, allowing you to strategize with confidence rather than emotion.
Knowing this one number brings immediate clarity to your entire strategy:
The crypto market's explosive growth makes precise tracking more critical than ever. The global cryptocurrency market was valued at USD 5,702.5 million in 2024 and is projected to hit USD 11,713.1 million by 2030. You can dig into more market growth insights from Grand View Research. As more investors pile in, the need for reliable tools to manage portfolios effectively becomes undeniable.
Simply guessing your numbers isn't a sustainable strategy. By taking the time to calculate your average cost, you shift from being a speculative participant to a strategic investor who understands their financial position with absolute certainty.
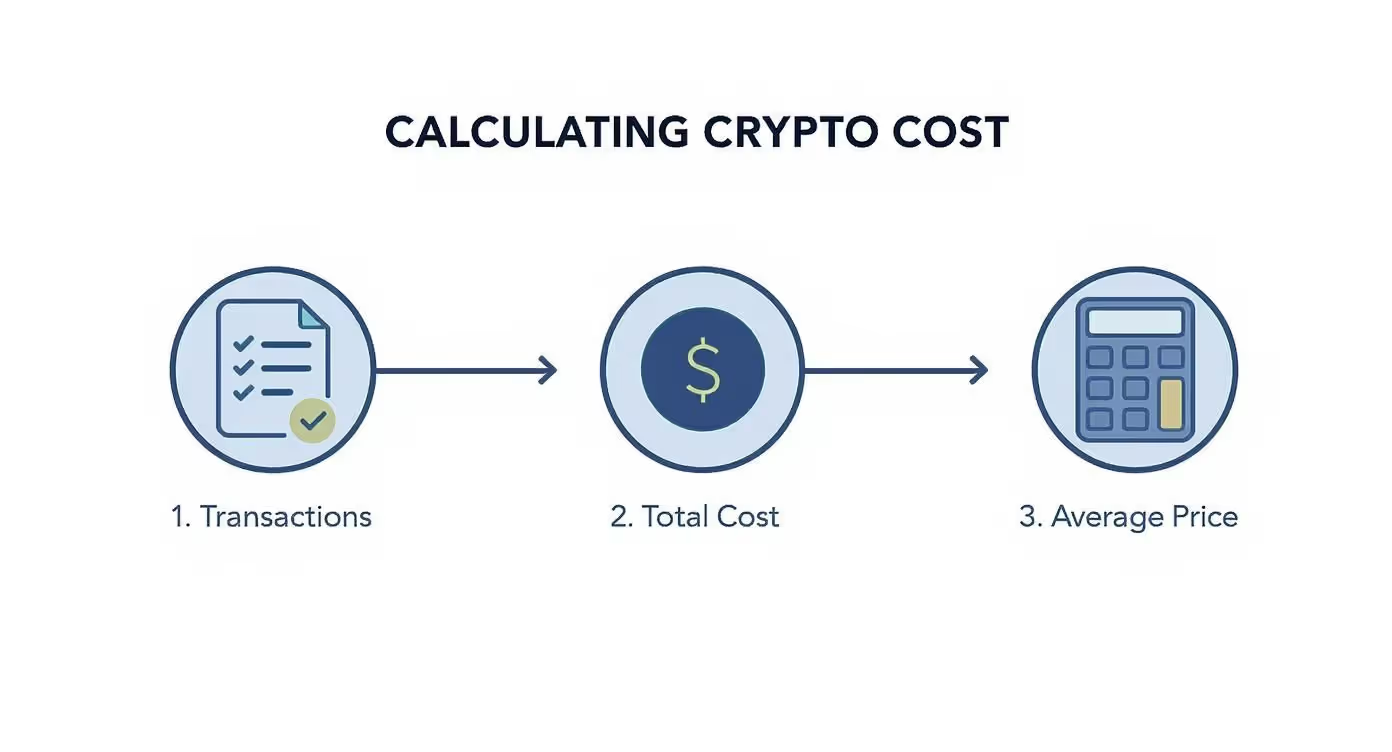
Ready to ditch the guesswork and find your true cost basis? The good news is the actual math is way simpler than it sounds. It’s all about finding the weighted average, which just means that your larger buys have a bigger impact on the final average price. This gives you a much more realistic picture of your investment.
At its core, the process is just three simple actions: pulling together your transaction data, adding up your costs and coins, and then doing one quick division.
Let's walk through it with a real-world example.
First thing's first: you need to round up all your purchase records for a specific crypto, like Bitcoin. You can usually download this history as a CSV file straight from the exchange you used.
Let's imagine you've been dollar-cost averaging into Bitcoin for a few months. Your purchase history might look something like this:
Transaction DateAmount Spent (USD)BTC ReceivedPrice per BTCJanuary 15$5000.0125 BTC$40,000February 5$3000.0070 BTC$42,857March 20$7000.0150 BTC$46,667
Heads up: Make absolutely sure your "Amount Spent" column includes any transaction or trading fees. These are a part of your acquisition cost, and skipping them—even the small ones—will mess up your numbers by understating your cost basis and overstating your potential profits.
Once you have your data lined up, it's just basic arithmetic. You need to find two key totals from your transaction history:
Using our Bitcoin example from above:
And that's it. You have everything you need for the final calculation. The formula for your weighted average cost is incredibly simple but powerful.
The Average Cost Formula
(Total Amount Spent) / (Total Crypto Received) = Your Average Cost Per Coin
Plugging our numbers into the formula:
$1,500 / 0.0345 BTC = $43,478.26 per BTC
That number, $43,478.26, is your true cost basis per Bitcoin. It’s your breakeven price. If the market is trading above this, you're in profit. If it's below, you're sitting on an unrealized loss.
Nailing this down is the first real step to mastering your portfolio. It's also the exact number you'll need when it's time to calculate your crypto profit down the line.
Getting comfortable with this manual calculation is a fantastic way to understand the mechanics behind your investments. And as crypto becomes more mainstream, these skills are only getting more important. According to the 2025 Global State of Crypto Report by Gemini, nearly one in four (24%) people surveyed across several major countries now own crypto.
The simple weighted average formula is a great starting point, but the crypto market rarely keeps things that simple. In the real world, you'll constantly run into two things that can mess up your calculations: transaction fees and partial sales.
Ignoring these is a surefire way to get an inaccurate cost basis, which completely defeats the purpose of tracking your portfolio. Let's walk through exactly how to handle both so your numbers stay razor-sharp. If you want to see how top traders interpret market trends and make smarter moves, A Trader's Guide to the Smart Money Index provides a clear roadmap.
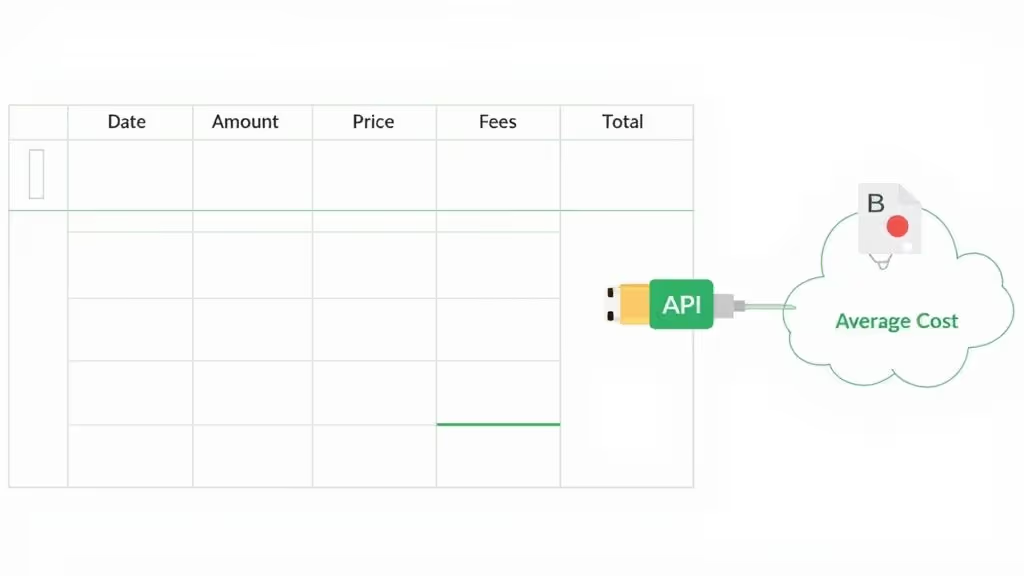
This flow chart gives a great visual of how individual buys, with all their details, roll up into a single, accurate average price.
As you can see, every little cost and quantity matters. The average price is the final output, so getting the inputs right is everything.
Every time you buy, sell, or swap crypto, you're almost guaranteed to pay a fee. It could be an exchange fee, a network gas fee, or a withdrawal fee. They might seem small, but these costs are a critical part of your acquisition cost and they absolutely add up.
You have to think of fees as part of the total price tag. If you buy 1 ETH for $3,000 but pay a $25 network fee, your actual cost for that trade wasn't $3,000—it was $3,025.
The only correct way to handle fees is to add them directly to the cost of each purchase. If you don't, you're understating your cost basis. That makes your profits look bigger than they really are and could lead you to overpay on taxes.
This is especially true if you’re trading often. For anyone deep in the DeFi space, our guide on how to track gas fees for high-frequency DeFi trades is a must-read to see just how quickly these costs can stack up.
Selling a portion of your holdings is probably the number one thing that trips people up when using a crypto average calculator. It feels complicated, but the logic is simple. When you sell some of your crypto, your total holding goes down, but your average cost for the coins you still hold doesn't change.
Let’s make this crystal clear with an example.
Imagine you own 2 ETH, and your total cost basis is $6,000. That gives you an average price of $3,000 per ETH.
Now, you decide to sell 0.5 ETH. To update your records properly, you need to subtract the cost basis of the portion you just sold.
With that number, you can update your portfolio totals:
So, what's the average cost for the ETH you have left? You guessed it—it's still the same.
$4,500 / 1.5 ETH = $3,000 per ETH
Your average price per coin only changes when you buy more at a different price. When you sell, you're just cashing out a piece of your investment at its existing average cost. Understanding this difference is absolutely crucial for accurate profit and loss tracking.
Doing the math by hand is a great way to really get the mechanics of your portfolio's cost basis. But let's be honest—it's tedious, time-consuming, and an open invitation for human error, especially once your transaction list starts to grow.
The good news is you don't have to live in spreadsheet hell forever. There are some fantastic tools out there that can simplify things or even put the entire process on autopilot. This is where a good template or a dedicated portfolio tracker becomes a total game-changer, handling all the complex stuff we've talked about so you know your numbers are always spot-on.
To help you get started on the right foot, we put together a free, no-fuss Google Sheets template. Think of it as the perfect middle ground between scribbling on a notepad and plugging into a fully automated system. It gives you all the structure and pre-built formulas to do the heavy lifting for you.
Our template is set up to track every piece of data you need for an accurate average cost calculation:
From there, the built-in formulas take over. They'll automatically calculate your running total cost, your total holdings, and—the main event—your continuously updated weighted average price. It’s a dead-simple way to use a crypto average calculator without getting tangled up in the formulas yourself.
A spreadsheet is a huge step up from manual math, but the ultimate solution for truly effortless tracking is a dedicated portfolio tracker. These platforms are designed to connect directly to your various exchange accounts and wallet addresses using secure APIs, creating a completely seamless, hands-off system.
This approach means you can finally say goodbye to manual data entry for good.
Once you're connected, an automated tracker pulls your entire transaction history—buys, sells, swaps, even staking rewards. It crunches all the numbers in real-time, giving you a live, accurate view of your cost basis and P&L across your whole portfolio.
Platforms like Wallet Finder.ai are built to transform this raw, messy on-chain data into clear, actionable insights. Just take a look at how a platform like this can present your portfolio data.
This kind of dashboard view consolidates all your holdings, showing your net worth, profit and loss, and how each individual asset is performing at a glance. It’s a level of clarity that you just can't get when you're tracking things manually.
Here's a comparison of manual vs. automated tracking:
FeatureManual Tracking (Spreadsheet)Automated TrackerSetup TimeQuick to start, but requires manual formula setup.Initial setup to connect accounts, then runs automatically.Data Entry100% manual. Every transaction must be entered.Automatic sync via API or wallet address. Zero manual entry.AccuracyProne to human error (typos, forgotten fees).Highly accurate, as data is pulled directly from the source.Real-Time ViewOnly as up-to-date as your last manual entry.Live, real-time updates on P&L and cost basis.Tax ReportingRequires manual calculations and report creation.Often includes automated tax report generation.Best ForBeginners with few transactions or those wanting to learn.Active traders or investors with multiple wallets/exchanges.
Making that jump to automation pays off in a few key ways:
Picking the right tool is a critical part of managing your investments well. To help you sort through the options, we put together a detailed guide on the best crypto portfolio tracker platforms out there today. Whether you stick with a template or go for full automation, the right tool ensures your financial decisions are built on solid data, not guesswork.
Figuring out your cost basis seems straightforward on the surface, but a few common slip-ups can throw your numbers off completely. Avoiding these mistakes is just as crucial as learning the formula itself if you want your financial decisions to be based on solid data.
Here's a quick checklist of pitfalls to watch out for:
Pro Tip: Think of fees as part of the purchase price. If you buy 1 ETH for $3,000 and pay a $20 gas fee, your real cost for that transaction is $3,020. Getting into the habit of adding these small amounts keeps your cost basis precise.
It’s surprisingly easy to mix up accounting methods without even realizing it. While the weighted average cost method is popular and simple, tax authorities in different regions might actually require something else.
MethodHow It WorksCommon Use CaseAverage CostPools all assets to create one average entry price.Great for personal P&L tracking; accepted in some regions for taxes.First-In, First-Out (FIFO)Assumes the first coins you bought are the first ones you sell.Required or default method for tax purposes in many countries (e.g., USA).Last-In, First-Out (LIFO)Assumes the last coins you bought are the first ones you sell.Less common for crypto taxes, but used in traditional accounting.
Confusing these can cause massive headaches and lead to major discrepancies in your capital gains calculations. For instance, tax rules in the UK use a specific variation of pooling and FIFO, which can result in a totally different taxable gain than a simple weighted average calculation would show.
This is where a good crypto average calculator or a dedicated portfolio tracker can save the day. They automate the correct application of these rules, preventing costly mistakes when tax season rolls around. By staying aware of these common pitfalls, you can keep your records straight and manage your crypto portfolio with much more confidence.
Most guides treat dollar-cost averaging as a single, fixed strategy: invest the same amount at the same interval, repeat indefinitely. That simplicity is one of DCA's greatest strengths. But it also means most DCA practitioners leave meaningful cost-basis improvement on the table by ignoring two refinements that can lower the final weighted average without requiring market timing skills.
The first refinement is value averaging — a DCA variant that adjusts your investment amount each period based on how your portfolio is performing against a predetermined growth target, rather than investing a fixed dollar amount regardless of price. The second is signal-modified DCA — adapting your purchase frequency or size based on a small set of objective, observable market indicators rather than fixed calendar dates.
Neither of these approaches requires predicting the market. Both operate within a disciplined, rules-based framework that eliminates emotion from the entry decision. What they share is the recognition that all DCA purchase intervals are not created equal: buying during periods of depressed price and fear creates a larger impact on lowering your average cost than buying during periods of elevated price and greed. These two strategies are methods for systematically increasing your allocation during the former and reducing it during the latter.
Value averaging was originally described in academic finance literature as a complement or alternative to standard DCA. Where standard DCA fixes the contribution amount, value averaging fixes the target growth path of the portfolio and makes the contribution variable.
The mechanics work as follows. Before you begin, you define a target growth rate for your portfolio — for example, you want your Bitcoin position to grow by $500 in value per month. At the end of each period, you check the actual value of your holdings. If the portfolio has grown to exactly $500 above the previous month's value, you invest nothing. If the portfolio has grown by only $200 (because price fell), you invest $300 to bring the portfolio back to its target growth path. If the portfolio grew by $800 (because price rose sharply), you invest nothing — and in the strictest form of value averaging, you would sell $300 of holdings to bring the portfolio back down to its target path.
Why value averaging tends to produce a lower average cost than fixed DCA:
The mathematical advantage of value averaging over fixed-amount DCA comes from the inverse relationship it creates between investment size and price. When price falls and your portfolio underperforms the target, your contribution increases — meaning you buy more coins at the lower price. When price rises and your portfolio outperforms the target, your contribution decreases or goes to zero — meaning you buy fewer coins at the higher price. Over time, this structure systematically concentrates your purchasing activity at lower prices and reduces it at higher prices, which is exactly the outcome every cost-basis-conscious investor wants.
To see the difference concretely, consider a simplified three-month scenario comparing fixed DCA at $300 per month versus value averaging targeting $300 monthly portfolio growth:
Month one: Price is $40,000. Fixed DCA buys $300 worth = 0.0075 BTC. Value averaging: portfolio grew $300 as targeted, no purchase needed.
Month two: Price drops to $30,000. Fixed DCA buys $300 worth = 0.0100 BTC. Value averaging: portfolio lost $4,000 in value against the target, requiring a $4,300 contribution = 0.1433 BTC at the lower price.
Month three: Price recovers to $45,000. Fixed DCA buys $300 worth = 0.0067 BTC. Value averaging: portfolio grew well above target, no purchase required.
Total BTC acquired under fixed DCA: 0.0242 BTC at a weighted average of approximately $37,190. Total BTC acquired under value averaging: 0.1508 BTC with a much lower weighted average, concentrated at the month-two price of $30,000.
The value averaging approach acquired significantly more coins at the lowest price point in the sequence because the rules mechanically demanded a larger purchase exactly when price was depressed. Fixed DCA bought the same dollar amount regardless.
Practical limitations of value averaging:
Value averaging requires available capital at the moments when large contributions are required — precisely the moments when price has fallen significantly and fear is elevated. If month two in the example above required a $4,300 contribution but you only had $300 available, the strategy breaks down. Practitioners address this by maintaining a cash reserve specifically for value averaging top-ups, typically equal to two to four months of the target growth amount. They also commonly cap the maximum single contribution to a defined multiple of the target amount to prevent extreme market drawdowns from demanding contributions that exceed available capital.
The sell discipline in strict value averaging — reducing holdings when the portfolio outperforms its target — is also psychologically difficult to implement during strong bull markets. Many practitioners apply value averaging only on the buy side, simply investing nothing during periods of outperformance rather than selling, which preserves the cost-basis advantage while avoiding the emotional resistance of selling into appreciation.
Signal-modified DCA keeps the fixed-amount structure of standard DCA but adjusts the frequency or size of purchases based on a small set of objective, rules-specified market indicators. The goal is not to time the market in the discretionary sense but to deploy capital more heavily during objectively fear-driven market conditions and more lightly during objectively euphoric ones.
Two indicators work particularly well for signal modification because they are simple, publicly available, and have demonstrated correlation with short-to-medium-term price direction: the Crypto Fear and Greed Index and on-chain exchange netflow.
Using the Crypto Fear and Greed Index as a signal modifier:
The Crypto Fear and Greed Index aggregates volatility, market momentum, social media activity, and dominance data into a single number between 0 (extreme fear) and 100 (extreme greed). For signal-modified DCA, you establish a simple rule set that links your regular contribution amount to the current index level.
A straightforward three-tier rule set: when the index is above 70 (greed to extreme greed), make your standard contribution or skip the period entirely. When the index is between 30 and 70 (neutral), make your standard contribution. When the index is below 30 (fear to extreme fear), double or triple your standard contribution. This rule set requires no forecasting judgment — the number is publicly visible, the rule is specified in advance, and the contribution size follows mechanically.
The logic is not that the Fear and Greed Index predicts future price with certainty. It is that buying more coins during periods of broad market fear systematically concentrates your purchases toward lower prices relative to your overall average across the contribution cycle.
Using exchange netflow as a signal modifier:
On-chain exchange netflow — the net difference between coins flowing into and out of major exchanges — is a second objective indicator that can serve as a signal modifier for DCA contribution sizing. Sustained negative netflow (more coins leaving exchanges than arriving) reflects broad accumulation behavior by large holders and correlates with bullish market conditions. Sustained positive netflow (coins moving onto exchanges in net terms) reflects increasing sell-side pressure.
A signal-modified DCA rule using netflow: when the seven-day average netflow for Bitcoin is negative (net outflow), increase your contribution by 50% above the standard amount. When the seven-day average netflow is positive (net inflow), reduce your contribution to 50% of the standard amount. When netflow is near zero or mixed, make the standard contribution.
This approach anchors one part of your DCA contribution adjustment to actual on-chain behavior by large market participants rather than sentiment surveys or price action. The underlying logic is similar to the Fear and Greed modifier: systematically allocate more capital when the behavioral evidence from large holders suggests accumulation conditions and less capital when it suggests distribution conditions.
One important implication of both value averaging and signal-modified DCA is that the contribution amounts vary from period to period. This means you cannot use a simplified "fixed amount times number of periods" shortcut for any cost basis estimate — you must track every actual purchase with its exact amount and price, exactly as you would for any other irregular purchase history.
The weighted average formula remains identical to what was introduced earlier in this guide. The only difference is that the "Amount Spent" column in your transaction records will show variable figures rather than the same number repeating. This makes automated tracking more useful, not less, because the variable contribution amounts create more calculation complexity than fixed-amount DCA. Platforms that sync directly with your exchange accounts handle this automatically, pulling each actual transaction regardless of size variation and computing the running weighted average without requiring you to manually record every adjusted contribution.
The core insight to carry forward is this: your final weighted average cost is not determined by the strategy you intended to follow but by the actual purchases you made and their prices. Signal-modified DCA and value averaging improve the weighted average by structuring which prices you buy at most heavily. The calculation method for the result is the same regardless of the strategy that produced the purchase history.
The scenarios covered earlier in this guide — multiple buy-ins, partial sells, and transaction fees — represent the cost basis complexity that most crypto investors encounter. But for anyone participating in decentralized finance, there is a substantially more complicated layer of cost basis events generated by DeFi activity itself. Liquidity pool participation, auto-compounding yield positions, and cross-chain bridge transactions all create cost basis events that standard crypto average calculators and basic spreadsheet templates handle poorly or not at all.
Understanding how to treat these events correctly is critical not just for accurate P&L tracking but for tax compliance, since many tax authorities are increasingly treating DeFi activity with the same scrutiny as exchange-based trading. The three categories below cover the most common DeFi cost basis complications and the correct framework for handling each.
When you provide liquidity to a decentralized exchange like Uniswap or Curve, you deposit two tokens into a liquidity pool in exchange for LP tokens that represent your proportional share of the pool. This transaction creates a cost basis event that most simple calculators completely miss.
The deposit as a disposal and acquisition event:
In most tax frameworks, depositing tokens into a liquidity pool is treated as a disposal of the tokens you deposited and an acquisition of the LP tokens you received in return. This means the deposit triggers a taxable event based on the fair market value of the tokens at the moment of deposit, not at your original purchase price.
The cost basis of your LP tokens is set at the total fair market value of the assets you deposited at the time of deposit. For example, if you deposit 1 ETH worth $3,000 and $3,000 of USDC into a Uniswap ETH/USDC pool when ETH is trading at $3,000, the cost basis of your LP tokens is $6,000 — the combined value of both assets at deposit time.
The withdrawal as another disposal and acquisition event:
When you remove your liquidity from the pool, the same logic applies in reverse. You dispose of your LP tokens and acquire the underlying tokens returned to you. The fair market value of the tokens you receive at the time of withdrawal becomes the proceeds from your LP token disposal, which is compared against your LP token cost basis to calculate gain or loss on the LP position itself. The returned tokens then establish new cost basis lots at their fair market value on the date of receipt.
Impermanent loss and its effect on cost basis:
Impermanent loss — the divergence between the value of tokens held in a liquidity pool versus simply holding the same tokens outside the pool — affects your P&L but does not directly change the cost basis calculation mechanics. The cost basis of your LP tokens remains the value at deposit. The impermanent loss is reflected in the difference between what you receive at withdrawal and what you would have received if you had simply held. It is not a separately deductible cost; it is embedded in the realized gain or loss calculation at withdrawal.
Tracking LP positions accurately requires recording four data points at the time of deposit: the quantity and fair market value of each token deposited, the total value of the LP tokens received, and the date of the transaction. These records are necessary for the withdrawal calculation and for any interim cost basis assessments.
Yield farming, staking, and auto-compounding strategies generate returns in the form of new tokens or additional units of an existing token. Each of these distributions creates a new cost basis lot at the fair market value of the reward at the time it is received. This is consistent with how staking rewards are treated (covered in the FAQ section of this article), but the complexity compounds significantly in auto-compounding protocols.
The auto-compounding problem:
In a standard yield farming position, you manually claim rewards, which creates a single taxable income event at a specific date and fair market value. Auto-compounding protocols — such as yield optimizers that automatically reinvest earned rewards back into the position — generate a continuous stream of micro-distributions, each of which technically constitutes a new cost basis lot. A position that auto-compounds daily creates 365 separate cost basis lots per year, each with a different fair market value and a different acquisition date.
In practice, tracking 365 individual lots per position per year manually is not feasible. The approaches used by practitioners and tax professionals fall into two categories.
Snapshot-based tracking: Rather than recording every individual auto-compound event, take a snapshot of the position's total value at the beginning and end of each calendar month. The difference between the end-of-month value and the beginning-of-month value, adjusted for any additional deposits or withdrawals during the month, represents the approximate income from auto-compounding for that month. The total income recognized over the year is the sum of these monthly increments, which establishes the aggregate cost basis for the compounded returns. This approach introduces some imprecision but is defensible as a reasonable estimate when exact records are not available.
Protocol-level reporting: Some DeFi protocols and portfolio aggregation platforms now provide transaction-level records of compounding events exported as CSV files. When these records are available, they should be used because they provide the most accurate cost basis assignment for each compounded lot. The compounded amount at each event establishes both the income recognized at that moment and the cost basis for those newly added units.
The key takeaway for DeFi yield positions: The total cost basis of a yield farming or auto-compounding position at any given moment is not simply the original deposit amount. It is the original deposit amount plus the aggregate fair market value of all rewards received or compounded since the position was opened. Ignoring the compounded rewards understates cost basis, which overstates taxable gain at exit.
As multi-chain activity becomes standard — moving assets between Ethereum mainnet, Arbitrum, Base, Optimism, Solana, and other networks — cross-chain bridge transactions have become one of the most mishandled cost basis events in retail crypto accounting.
The two competing treatment frameworks:
There is genuine ambiguity in how bridge transactions should be treated for cost basis purposes, and the appropriate treatment may depend on the specific bridge mechanism and the tax jurisdiction involved. Two treatment frameworks are used in practice.
Continuity treatment: Under this framework, bridging an asset from one chain to another is treated as a transfer of the same asset rather than a disposal and re-acquisition. The cost basis and acquisition date of the original tokens carry through to the bridged tokens on the destination chain. This is analogous to transferring assets between your own exchange accounts — a non-taxable event that does not reset cost basis or acquisition date. Continuity treatment is most defensible when the bridge uses a lock-and-mint mechanism, where the original tokens are locked in a smart contract on the source chain and a wrapped or synthetic representation is minted on the destination chain.
Disposal treatment: Under this framework, sending tokens through a bridge is treated as disposing of the original tokens (potentially triggering a taxable gain or loss) and acquiring new tokens on the destination chain at their fair market value at the time of receipt. The new tokens start a fresh cost basis lot at current market value. This treatment may be required or preferred in jurisdictions that treat any change in the on-chain representation of an asset as a disposal.
How to decide which treatment to use:
In the absence of specific guidance from your tax authority on bridge transactions, the most defensible approach is to apply continuity treatment for bridges where you control both the source and destination wallet addresses (same beneficial owner throughout), the bridged token represents the same underlying asset, and no economic gain or loss is realized by the bridge mechanism itself. Document the bridge transaction clearly — source chain, destination chain, token quantity, bridge protocol used, and transaction hashes on both chains — so that the continuity treatment can be substantiated if questioned.
For bridges where you receive a distinctly different token on the destination chain (such as exchanging ETH for a wrapped version with a different smart contract address that does not maintain a 1:1 peg), disposal treatment is more appropriate regardless of jurisdiction.
Tracking bridge costs:
Bridge transactions typically involve fees paid in the native gas token of the source chain. These fees should be recorded as additional cost basis allocated to the bridged tokens under continuity treatment, or as transaction costs reducing the disposal proceeds under disposal treatment. Either way, failing to record bridge fees is a common omission that slightly understates your aggregate cost basis across multi-chain activity.
The cumulative complexity of LP positions, compounding yield, and bridge transactions makes manual tracking of DeFi cost basis impractical for anyone with active multi-protocol activity. The probability of errors accumulating to a material level over six to twelve months of active DeFi participation is high when spreadsheet-based tracking is the only tool in use.
The practical recommendation is a tiered approach: maintain a spreadsheet for your straightforward exchange-based buy/sell history where manual tracking is reliable, and use a dedicated DeFi portfolio tracker or on-chain analytics platform for LP positions, yield farming, and cross-chain activity where the transaction frequency and complexity exceed what spreadsheet formulas handle accurately. Wallet Finder.ai provides on-chain wallet analytics across Ethereum, Solana, and Base, giving you a clear view of your total position across chains so your cost basis records stay complete even as your DeFi activity expands.
Even with the best tools, crunching the numbers on your crypto cost basis can leave you with a few lingering questions. Let's tackle some of the most common ones I hear from investors so you can manage your portfolio with confidence.
No, you don’t pay taxes on unrealized gains. Think of these as "paper profits"—the potential gains on assets you're still holding.
A taxable event only gets triggered when you realize that gain. This happens when you dispose of the asset, which in the crypto world means selling it for cash, trading it for another crypto, or even spending it on goods and services. You might be sitting on a massive unrealized profit, but you don't owe a dime on it until you actually make a move.
This is a great question and a point of confusion for many. When you earn rewards from staking or yield farming, those rewards are usually treated as income, valued at their fair market price on the day you received them.
So, how does that play into your cost basis? It's a two-step process:
Let's say you earn 0.1 ETH from staking when ETH is trading at $3,000. You've just generated $300 of taxable income. At the same time, the cost basis for that specific 0.1 ETH is now set at $300. You'd then add these new coins to your total holdings, which will slightly adjust your overall weighted average price.
This is where a lot of people get tripped up. The P&L your portfolio tracker shows is your net profit, but your taxable gain is a specific calculation based on the rules set by tax authorities like the IRS or HMRC. The two are rarely the same.
Here’s a classic scenario: you have an overall net loss for the year but still owe a surprising amount in taxes. How? You might have realized some big gains early in the year before a market crash. Those sales are locked-in taxable events, no matter what happened to your portfolio's value afterward.
That’s exactly why just glancing at your portfolio's current balance isn't enough for proper tax planning. A good crypto average calculator tracks each sale or trade as a distinct realized event, giving you a true picture of your tax liability and helping you avoid any nasty surprises.
Standard dollar-cost averaging invests a fixed dollar amount at fixed intervals regardless of market conditions. Value averaging is a modified DCA strategy where the investment amount varies each period based on whether your portfolio is tracking above or below a predetermined growth target.
The key difference for your cost basis is how each strategy distributes purchases across price levels. Standard DCA buys the same dollar amount whether price is high or low, so the distribution of your purchases across prices is roughly proportional to how often you buy — no preference for low prices over high prices. Value averaging mechanically requires larger purchases when price has fallen (because the portfolio has underperformed its growth target) and smaller purchases or none when price has risen (because the portfolio has outperformed). This systematic concentration of purchasing activity at lower prices tends to produce a lower weighted average cost over time compared to fixed DCA run across the same period.
The practical trade-off is that value averaging requires available capital at moments when market fear is highest and price has dropped most — exactly when it is psychologically hardest to deploy capital. Standard DCA avoids this by using the same fixed amount every period, which requires no judgment about whether capital availability is adequate for an unusually large contribution. For investors who cannot reliably maintain a capital reserve for larger value averaging contributions, standard DCA with signal modification (adjusting contribution size based on objective indicators like the Fear and Greed Index) offers a middle ground between the simplicity of fixed DCA and the cost basis optimization potential of value averaging.
Calculating cost basis for a liquidity pool position requires tracking the transaction in two stages: the deposit and the withdrawal.
At deposit, your cost basis for the LP tokens you receive equals the combined fair market value of both tokens you deposited at the exact time of deposit. If you deposit 1 ETH at $3,200 and $3,200 of USDC when ETH is worth $3,200, your LP token cost basis is $6,400. This deposit is typically treated as a disposal of the deposited tokens at their current fair market value, which may trigger a taxable event if either token has appreciated since your original purchase.
At withdrawal, you receive back the underlying tokens from the pool. The fair market value of the tokens you receive at withdrawal becomes the proceeds from your LP token disposal, compared against your $6,400 cost basis to calculate the realized gain or loss on the LP position. The returned tokens then establish fresh cost basis lots at their fair market value on the date of withdrawal.
The complication most investors encounter is that the pool returns tokens in different proportions than what was deposited, due to the price rebalancing mechanism of AMM (Automated Market Maker) pools. This is the mechanism that generates impermanent loss. The impermanent loss is not a separate deductible item; it is simply reflected in the fact that your withdrawal proceeds may be lower than what the deposited tokens would have been worth if held outside the pool.
To track this accurately, record the date, quantity, and fair market value of tokens deposited; the LP tokens received and their aggregate value; and at withdrawal, the date, quantity, and fair market value of tokens returned. Any DeFi portfolio tracker that connects to your wallet address on the relevant chain will record these events automatically.
Bridge transactions sit in a tax gray area because guidance from most tax authorities has not specifically addressed them. The two treatment frameworks used in practice are continuity treatment (where the cost basis and acquisition date of your original tokens carry through to the bridged tokens as if no disposal occurred) and disposal treatment (where bridging is treated as selling the original tokens and buying new ones at current market value on the destination chain).
Continuity treatment is the more widely used approach when you control both the source and destination wallet, the bridged token represents the same underlying asset, and no economic gain or loss results from the bridging mechanism itself. It is analogous to how most practitioners treat transfers between your own wallets — a non-taxable event that preserves the original cost basis and acquisition date. Under this approach, your weighted average cost for the asset on the destination chain is the same as it was on the source chain, adjusted only for any bridge fees paid (which are added to the cost basis of the bridged tokens).
Disposal treatment is more appropriate when you receive a fundamentally different token on the destination chain — one with a different smart contract address and no guaranteed 1:1 redemption mechanism — because in that case you have genuinely exchanged one asset for another, which is economically equivalent to a swap.
Regardless of which treatment applies, always record bridge transactions with the source chain, destination chain, token quantity and type, bridge protocol, transaction hashes on both chains, and any fees paid. These records are necessary to substantiate your chosen treatment and to reconstruct your cost basis history accurately if your tax situation is reviewed.
Ready to stop guessing and start making data-driven trades? Wallet Finder.ai gives you the tools to analyze on-chain data, track profitable wallets, and discover opportunities before the market moves. Find your edge and mirror the strategies of top traders in real time. Start your 7-day trial of Wallet Finder.ai today.

A premier DeFi analytics platform empowering traders to discover and analyze profitable blockchain wallets, trades and tokens.

