
Recovery Factor Calculation for Smart Traders
Master the recovery factor calculation to measure a strategy's resilience. Learn the formula, see DeFi examples, and find top wallets with Wallet Finder.ai.

June 20, 2026


Wallet Finder
February 15, 2026

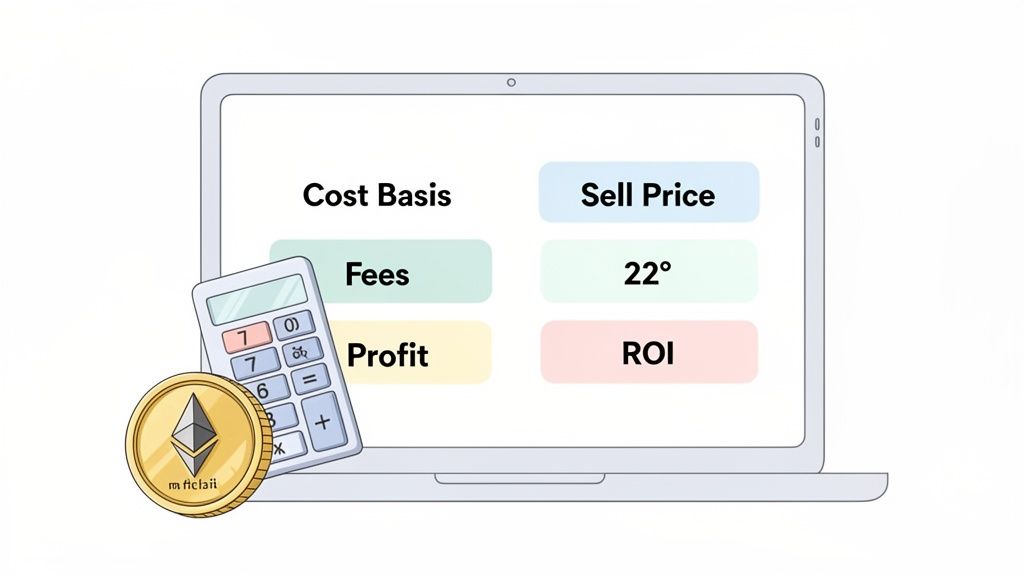
Figuring out your crypto profits sounds simple, but it's a step that trips up a surprising number of traders. In a nutshell, you need to know your cost basis (what you paid, including all fees) and subtract that from your sale price (what you sold it for, minus fees). For coins you're still holding, the math is Current Market Value - Cost Basis.
Getting this right is essential for tracking your performance, refining your strategy, and for tax reporting.
Before diving into complex DeFi strategies, you must nail the fundamentals. Accurately calculating your crypto profits isn't just a chore for tax season—it's how you measure what's working and refine your strategy. Getting these basics wrong can lead to poor decisions and painful financial surprises.
At the heart of it all are a few core terms. These concepts are the building blocks for every scenario, from a simple buy-and-sell trade to tracking a complex liquidity pool position.
Let’s define the key terms you need to know. Your Cost Basis is the total amount you spent to acquire an asset. This isn't just the purchase price; it must include all transaction fees.
Here are the essential metrics for tracking your performance:
The single biggest mistake I see new traders make is ignoring small transaction fees. On active chains like Ethereum, those gas fees can pile up fast and completely wipe out your net profits, turning what looked like a winning trade into a loser.
For a deeper dive, you can learn more about profit and loss analysis in our dedicated guide.
This table provides a quick reference for the essential formulas you'll use to measure your crypto gains and losses.
MetricFormulaWhat It Tells YouCost BasisPurchase Price + All Associated FeesYour total initial investment for an asset.Realized PnL(Sale Price - Sale Fees) - Cost BasisThe actual profit or loss locked in from a completed trade.Unrealized PnLCurrent Market Value - Cost BasisThe "on paper" profit or loss for an asset you still hold.ROI (%)(Net Profit / Cost Basis) x 100Your gain or loss relative to your initial investment.
Keep these handy as they form the foundation of all profit calculations.
How you calculate profits can change dramatically depending on your trading style. For a long-term hodler, things are relatively clean—you often have one cost basis and one eventual sale. The profit potential here can be staggering.
For instance, in the last five years, Bitcoin delivered an average annual return of over 155%, dwarfing traditional assets like gold (at 7% annually). The historical numbers are even wilder: Bitcoin soared 30,203% in 2010 and another 5,870% in 2013. You can explore more historical data on Bitcoin's performance over time at casebitcoin.com.
Now, contrast that with a day trader who might execute dozens of trades in a single session. Every single one of those trades has its own unique cost basis and sale price. Without a rock-solid system for tracking everything, it's virtually impossible to know your true PnL. This is why meticulous record-keeping isn't just good practice; it's non-negotiable for anyone serious about trading.
To get a grip on your portfolio’s health, you must understand the two sides of profit: realized and unrealized. One is money you can actually spend, and the other is potential value that could disappear in an instant.
Let’s walk through a real-world example to see how sneaky transaction fees can be.
Imagine you decide to buy 0.5 ETH.
A few weeks later, ETH pumps to $3,400, and you decide to sell.
Now for the final calculation.
Realized PnL = Net Sale Proceeds - Total Cost Basis$1,685 - $1,525 = $160 Profit
If you hadn't tracked the $40 in total fees, you might have thought you made $200. Multiply that small error across hundreds of trades, and you see why accurate PnL tracking is so important. For a deeper dive, check out our complete guide to PnL tracking for DeFi traders.
Now let's look at unrealized gains, which represents your portfolio's value for open positions. This number is key for understanding your current net worth and risk exposure.
Let's say you invest in a Solana memecoin.
A month later, your 10,000 WIF are worth $1,200. You haven't sold any.
Here’s how to calculate your paper gains:
MetricCalculationResultCurrent Market ValueThe live value of your 10,000 WIF.$1,200Cost BasisYour initial all-in investment.$500.50Unrealized PnLCurrent Market Value - Cost Basis$699.50
That $699.50 is your unrealized profit. It isn't real until you hit the sell button. If the token's value dumps to $300 tomorrow, you’d have an unrealized loss of $200.50. This is why it’s critical to monitor unrealized PnL but always ground your performance in what you’ve actually realized.
Once you step into Decentralized Finance (DeFi), calculating your crypto profits gets much more complicated. Simple buy-and-sell math no longer works. Now you're juggling token swaps, gas fees, liquidity pools, and impermanent loss.
At its core, the process remains the same: you buy an asset, sell it, and then figure out the gain or loss.
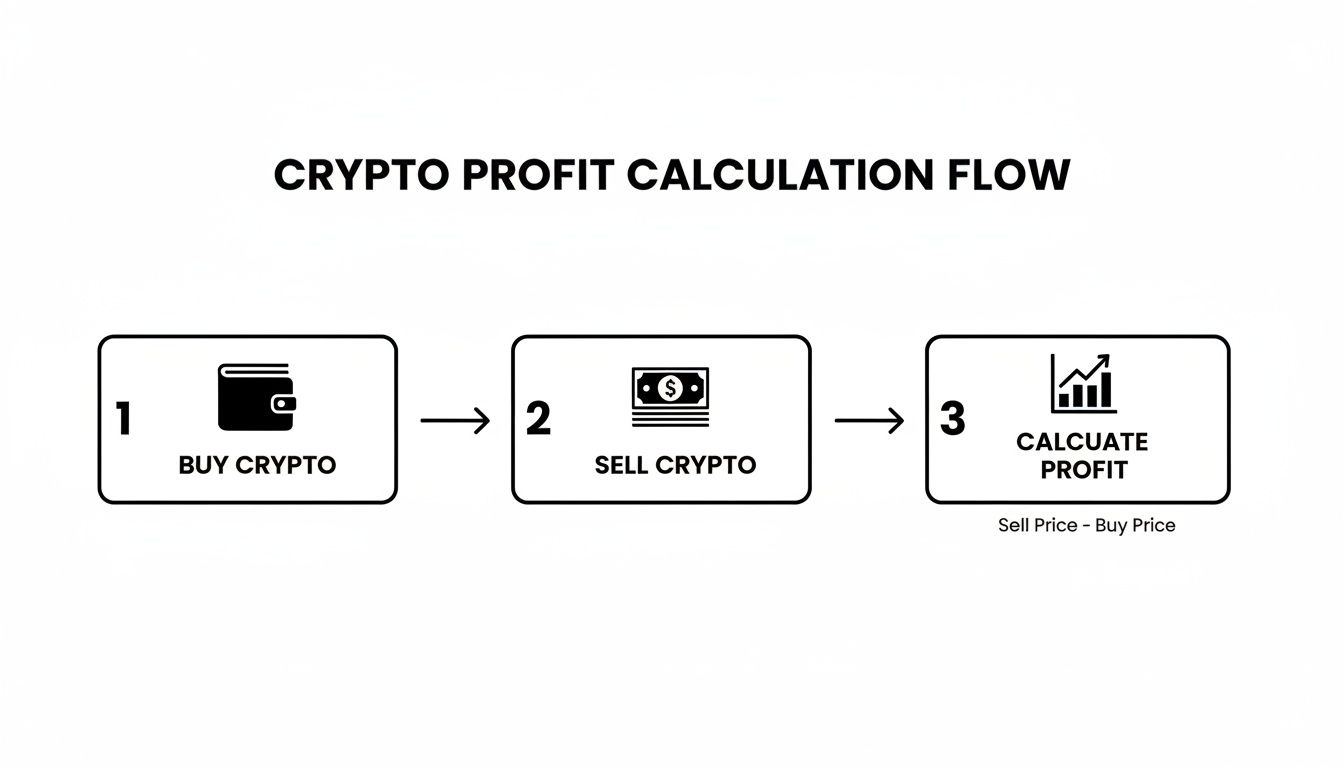
This image shows the basic idea, but in DeFi, the devil is in the details between each step.
On a Decentralized Exchange (DEX) like Uniswap, you are swapping one crypto for another. This is a crucial detail: a crypto-to-crypto swap is a taxable event.
Think of it as two separate transactions:
You must calculate the realized profit or loss on the asset you "sold." For example, if you swap 1 ETH (which you bought for $1,500) for 10,000 TOKEN when ETH’s price is $3,000, you just realized a $1,500 profit on your ETH. Your new cost basis for the 10,000 TOKEN is now $3,000.
Gas fees, especially on Ethereum, are a silent portfolio killer. A trade might look profitable on paper, but after network fees, that profit can vanish or even become a loss.
It is essential to treat gas fees as part of your costs:
Skipping this gives you an inflated view of your trading performance.
The article above correctly points out that gas fees need to be included in your cost basis. What nobody shows you is what happens when you actually run the math across a full year of active trading. The compounding effect of fees across dozens or hundreds of transactions doesn't just eat into your profits — it fundamentally changes which trades were actually profitable and which weren't.
Here's what a realistic active trading year looks like in fee terms. An active DeFi trader on Ethereum might execute three to five transactions per day across swaps, deposits, withdrawals, and approvals. At an average gas cost of fifteen to thirty dollars per transaction on a moderately congested day, that's sixty to one hundred fifty dollars daily. Over a trading year, that's somewhere between twenty-two thousand and fifty-five thousand dollars in gas fees alone.
That number hits differently when you put it against actual returns. If your gross trading profit for the year was eighty thousand dollars and your gas fees totaled forty thousand, your real profit was forty thousand — half what your trades looked like on paper. Every single performance metric you calculated without fees built in was wrong by a factor of two.
The compounding effect goes deeper than just the total dollar amount. Gas fees inflate your cost basis on every buy and deflate your proceeds on every sell. When you're trading the same token repeatedly — buying, selling, buying again — each round trip accumulates fees that stack on top of each other. A token you bought and sold five times over the year has five separate cost basis adjustments and five separate sale adjustments, and the cumulative fee drag on that single token might be hundreds of dollars.
The practical defense is not avoiding gas fees — that's impossible if you're trading on Ethereum — but building them into your decision-making before you execute. If a trade looks like it will net you forty dollars of profit but gas will cost twenty-five dollars round trip, you're making fifteen dollars of real money for the risk and time involved. Many trades that look attractive on price alone become marginal or negative once you run the fee math. Layer-two chains like Base, Arbitrum, and Optimism exist partly because this problem was so painful on mainnet Ethereum that it drove serious traders off the chain entirely.
The tracking approach that actually works is treating gas fees as a separate running total alongside your trade-by-trade PnL. At the end of each week, subtract your cumulative gas spend from your gross trading profit. This gives you a real-time view of your net performance that accounts for the fee drag you're actually carrying. Most traders who run this calculation for the first time are genuinely shocked by how much gas has been eating their returns.
Providing liquidity is a popular way to earn yield in DeFi, but tracking profits is a beast. You deposit a pair of assets (e.g., ETH and USDC) into a Liquidity Pool (LP) and receive LP tokens. In return, you earn trading fees but also expose yourself to Impermanent Loss (IL).
Impermanent Loss occurs when the price ratio of your two deposited assets changes. The more the prices diverge, the greater the IL. This means your profit from being a liquidity provider is:
LP Profit/Loss = Fees Earned - Impermanent Loss
Calculating this is difficult because the amount of each token you own in the pool is always shifting. You have to compare the current value of your assets in the pool against what their value would have been if you’d just held them.
This volatility creates huge opportunities. Looking at Bitcoin's monthly performance from 2011 to 2025, it had positive returns in 56% of months. But the real story is in outliers, like the 451.2% gain in November 2013. The annual stats show similar trends: 2017 brought 1,338% returns, and the DeFi summer of 2020 fueled a 302% run. You can dig into this kind of data using tools like Curvo's backtester.
To win in DeFi, you must be meticulous. If you're not tracking these complex scenarios properly, you’re flying blind.
Every DeFi guide tells you impermanent loss is something to worry about. Almost none of them show you how to actually calculate it with real numbers. The formula exists, it's not that complicated, and running it before you provide liquidity is the single most important step between "I think this LP position will be profitable" and actually knowing whether it will be.
Impermanent loss happens because of how automated market makers work. When you deposit two tokens into a liquidity pool, the AMM constantly rebalances your position to maintain a specific ratio. If one token's price doubles relative to the other, the AMM has sold you out of the winner and bought more of the loser. You end up with less of the asset that performed and more of the one that didn't. The "loss" is the difference between what your tokens would be worth if you'd just held them versus what they're actually worth inside the pool.
Let's use a concrete example that shows exactly what happens to your money. You deposit one thousand dollars into an ETH/USDC liquidity pool on a DEX. At the time you deposit, ETH is priced at two thousand dollars. So you put in 0.25 ETH (worth five hundred dollars) and five hundred USDC, splitting your deposit evenly as the pool requires.
Three months pass. ETH's price moves to three thousand dollars — a fifty percent increase. The AMM has been constantly rebalancing your position throughout this move, selling ETH as it rose and accumulating USDC. When you withdraw, you don't get back 0.25 ETH and 500 USDC. You get a different mix.
Here's the math. The impermanent loss formula compares two scenarios: what your tokens are worth now inside the pool versus what they would have been worth if you'd simply held the original amounts in your own wallet.
If you'd held, your 0.25 ETH would now be worth seven hundred fifty dollars (0.25 times three thousand), and your five hundred USDC would still be five hundred. Total value if held: twelve hundred fifty dollars.
Inside the pool, your position has been rebalanced by the AMM. Using the standard IL formula, which compares the geometric mean of price ratios to the arithmetic mean, a fifty percent price increase in one asset of the pair results in approximately 2.3 percent impermanent loss. That means your pool position is worth about twelve hundred twenty-one dollars instead of twelve hundred fifty.
The twenty-nine dollar difference is your impermanent loss. It doesn't sound like much on a one-thousand-dollar position, but the loss scales non-linearly. If ETH had doubled in price — a one hundred percent move — your IL would jump to about 5.7 percent. If ETH had tripled, IL hits around 13.4 percent. The relationship isn't linear, and the losses accelerate as price divergence grows.
The critical question isn't whether impermanent loss exists — it always does when prices move. The question is whether the trading fees you earn while providing liquidity exceed the IL you accumulate. If fees beat IL, you profit. If IL beats fees, you lose money despite earning yield.
High-volume pools on major trading pairs like ETH/USDC tend to generate enough fees to overcome moderate IL because the volume is enormous and the fee percentage, while small per trade, multiplies across thousands of daily swaps. Lower-volume pools on obscure token pairs might offer attractive APY numbers that make no sense once you factor in the IL you're accumulating from price volatility on those same volatile tokens.
The way to check before deploying is looking at historical fee income for the specific pool versus historical price volatility of the token pair. Pools where the fee income consistently exceeded IL over the past month are likely to continue doing so unless market conditions change dramatically. Pools where the APY looks great but the token pair has been volatile enough to generate significant IL are likely value traps — the displayed yield doesn't account for the IL silently eating your position.
Tracking this after you're already in a position requires periodic checks. Pull your current pool value, calculate what your original deposit would be worth if you'd held, and compare. The difference is your running IL. Add your accumulated fee income. If fees minus IL is positive, the position is working. If it's negative and the trend isn't improving, exiting and holding the underlying tokens would have been more profitable.
Tracking profits manually is like crossing a minefield. One wrong step can lead to messy records, poor trading decisions, and a massive tax headache. Let's cover the most common errors and tricky situations.
Getting these edge cases right separates the pros from the hobbyists. Everything from bridging assets to handling an airdrop impacts your profit calculations.
A common mistake is messing up your cost basis, especially when you've bought the same coin at different prices. If you bought ETH at $2,000, $3,000, and $2,500, which one are you selling first? Your answer completely changes your reported profit.S
Another pitfall is ignoring taxable events that aren't straightforward sales. In many places, like the US, numerous on-chain actions count as a disposal of your asset and trigger a tax event.
These include:
A critical detail that trips up a lot of people is handling staking rewards. These are almost always treated as income, and you're taxed on their value the moment you receive them. That value also becomes the cost basis for those rewards, which you'll need when you eventually sell.
Moving assets between blockchains—like bridging USDC from Ethereum to Base—adds complexity. While bridging itself isn't typically a taxable event, the fees are important.
The gas fees you pay on the source chain (Ethereum) and any fees on the destination chain (Base) should be added to the asset's overall cost basis. This meticulous tracking keeps your profit calculation accurate.
How you account for your trades can have a massive impact on your tax bill. The two most common methods are First-In, First-Out (FIFO) and Last-In, First-Out (LIFO). The method determines which "batch" of coins you're considered to have sold.
Imagine you bought 1 BTC at $30,000 and another at $50,000. Later, you sell 1 BTC when the price is $60,000.
Accounting MethodBest For...Impact on Taxable Gains (Rising Market)Impact on Taxable Gains (Falling Market)FIFOSimplicity and compliance; long-term holding strategies.Higher taxable gains, as you sell cheaper, older coins first.Lower taxable gains, as you sell more expensive, older coins.LIFOPotentially deferring taxes in a bull market.Lower taxable gains, as you sell newer, more expensive coins.Higher taxable gains, as you sell cheaper, newer coins first.
With FIFO, your taxable gain would be $30,000 ($60k - $30k). With LIFO, it would only be $10,000 ($60k - $50k). The most important rule is consistency—you can't flip-flop between methods each year.
These scenarios show exactly why manually calculating crypto profits is a recipe for disaster.
Here's a tax scenario that trips up a significant number of active crypto traders and that almost no crypto guide addresses directly: wash sales. In traditional stock investing, a wash sale is when you sell a stock at a loss and buy back the same or substantially identical stock within thirty days. The IRS disallows the loss deduction — you can't harvest the tax benefit of the loss if you immediately rebuy.
As of now, the IRS has not officially classified cryptocurrency as a security for wash sale purposes. This means, technically, wash sale rules do not currently apply to crypto the way they apply to stocks. Many traders have exploited this gap deliberately — selling a token at a loss, claiming the tax deduction, and buying the same token back the next day. Legal under current rules. But this is a gray zone that is actively closing.
The reason this matters for your profit calculations right now is twofold. First, if wash sale rules get applied retroactively or prospectively to crypto — which multiple pieces of pending legislation have proposed — every trader who harvested losses through rapid rebuy cycles could face amended tax bills. Second, and more immediately, some tax preparation software and CPA firms are already applying wash sale logic to crypto voluntarily, either because they're being conservative or because they genuinely believe the rules should apply. If your tax software flags your crypto losses as wash sales and disallows them, your profit calculation changes dramatically regardless of what the law technically says today.
The practical approach is understanding what your specific tax software does. Run a test scenario: sell a token at a loss, buy it back within thirty days, and see whether your software flags it. If it does, you need to either accept the disallowance or structure your loss harvesting to avoid triggering the pattern — selling for thirty-one days before rebuying, or selling into a different but correlated asset rather than the identical token.
The deeper issue is that relying on a tax loophole that everyone can see is closing, and that multiple regulatory bodies have signaled they want to close, is a risky strategy for anyone building long-term tax efficiency. Harvesting legitimate losses on positions you genuinely don't want to hold anymore is solid tax strategy. Manufacturing losses specifically to rebuy immediately, betting that the current regulatory gap stays open, is gambling with your tax bill.
Manually calculating crypto profits—from simple swaps to the complex math of impermanent loss—is a nightmare. A spreadsheet quickly becomes a source of costly mistakes and a skewed view of your performance.
For any serious trader, manual tracking is slow, reactive, and prone to error.
This is where you graduate from reactive data entry to proactive, data-driven trading. Instead of hunting down transaction hashes, you can automate the whole process and focus on what matters: finding your next alpha.
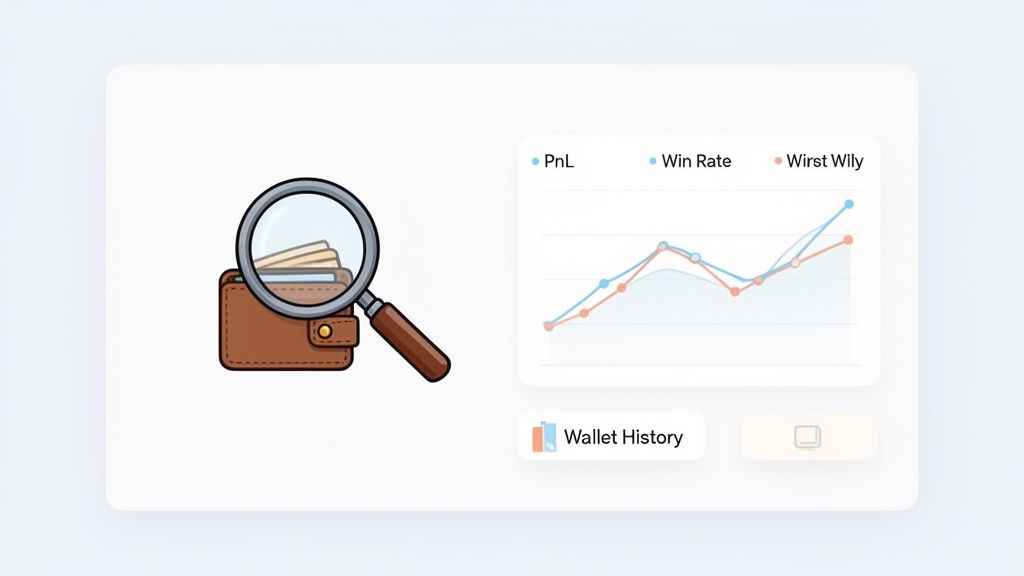
Tools like Wallet Finder do the heavy lifting for you. Simply enter a wallet address, and the platform pulls the entire on-chain history across major chains like Ethereum, Solana, and Base.
It crunches every transaction to create a live performance dashboard. This isn't just a single profit number; you get a full breakdown of the stats that tell a trader's story.
This level of detail is a game-changer. You’re no longer guessing if a wallet is good; you’re looking at cold, hard data.
The true power of on-chain analysis isn't just about tidying up your own portfolio. It's about getting a massive informational edge by seeing—in real time—what the most profitable traders on the planet are doing, with zero filters.
The real magic of a tool like Wallet Finder is tapping into raw market intelligence. The 'Discover Wallets' feature is a search engine for profitable traders, letting you find and vet the best performers based on real numbers.
You can filter wallets by total PnL, recent gains, or win rate to find traders whose style you want to learn from. Once you spot a promising wallet, you can dive into its history to reverse-engineer its strategy.
With immediate access to verified performance data, you can cut through the noise from influencers and paid groups. You are looking at raw, immutable on-chain facts. If a trader claims to be profitable, the data will either back them up or expose them.
Once you've found wallets that are consistently profitable, add them to a watchlist. This is where automation kicks in. You can set up real-time alerts via Telegram or push notifications that trigger the moment a tracked wallet makes a move.
Imagine getting an instant ping when a top trader you follow:
This lets you act on their moves almost instantly, giving you a chance to get in before the market catches on. You are no longer just looking at old data; you’re using live signals to inform your own trades. You can see how to discover and track top wallets using Wallet Finder.ai to see how powerful this is.
By automating the tedious work to calculate crypto profits and leveraging clean on-chain data, you can stop getting bogged down in the past and start capitalizing on the future.
Calculating your crypto profits can bring up many questions. Let's tackle some of the most common ones.
Getting these details right is essential for tracking your real performance and staying on the right side of tax authorities.
First, determine your cost basis: what you paid for the crypto plus any acquisition fees. A taxable event occurs when you sell, trade, or spend your crypto. Your profit or loss is the final sale price minus that cost basis.
Tax treatment often depends on your holding period:
You must also consistently use an accounting method, like FIFO (First-In, First-Out). Given the complexities, it’s wise to consult a tax professional or use specialized software.
Manually tracking transactions across multiple wallets and chains in a spreadsheet is a recipe for disaster. It is time-consuming and prone to errors.
The easiest and most accurate method is to use an automated on-chain analysis tool. These platforms connect directly to the blockchain, pulling all activity from any wallet address. They do the heavy lifting—calculating PnL, ROI, and other key metrics—giving you one clean dashboard without any manual entry.
Absolutely. In most jurisdictions, including the US, a crypto-to-crypto swap is a taxable event. Tax authorities view it as two separate transactions: you're selling the first asset and then immediately buying the second.
You must calculate the capital gain or loss on the crypto you disposed of based on its fair market value at the moment of the swap. This is a common trip-up for DeFi users.
It's a classic mistake to think, "I didn't cash out to dollars, so no tax is due." Tax agencies don't see it that way. They consider a swap a "disposition" of property, which triggers a taxable event no matter what.
You must include gas fees in your calculations to get a true picture of your profitability.
Ignoring these fees will give you a false sense of profitability. Factoring them in reveals the true cost of trading and provides an accurate PnL.
Stop guessing and start making data-driven decisions. Wallet Finder.ai gives you the on-chain intelligence to discover top traders, analyze their strategies, and get real-time alerts on their every move. Find your edge with a free 7-day trial at Wallet Finder.ai.

A premier DeFi analytics platform empowering traders to discover and analyze profitable blockchain wallets, trades and tokens.

