
Recovery Factor Calculation for Smart Traders
Master the recovery factor calculation to measure a strategy's resilience. Learn the formula, see DeFi examples, and find top wallets with Wallet Finder.ai.

June 20, 2026


Wallet Finder
November 14, 2025
Cluster analysis tools help group DeFi wallets based on their behavior, like trading habits, transaction frequency, and profitability. These tools simplify blockchain data, making it easier to identify patterns and strategies used by successful wallets. For US investors, they offer insights into compliance, tax tracking, and market timing while comparing performance with similar wallets.
These tools help US investors optimize strategies, align trading with market hours, and ensure compliance with regulations.
To get a complete picture of wallet activity, cluster analysis tools need to support multiple blockchains. DeFi activity spans networks like Ethereum, Polygon, Arbitrum, and many others. Focusing on just one chain leaves major gaps in understanding. Without cross-chain insights, you could miss key profit patterns.
Multi-chain support uncovers trading strategies that might otherwise go unnoticed. For example, a wallet might seem unprofitable on Ethereum due to high gas fees, but the same wallet may be thriving on Polygon through yield farming or arbitrage on Binance Smart Chain.
In May 2024, the total value locked in DeFi surpassed $192 billion across multiple networks. QuickNode, a leading blockchain infrastructure provider, supports over 60 chains and 100 networks, showing just how fragmented the DeFi ecosystem has become. This complexity makes it crucial to track wallets across all relevant chains for accurate analysis.
Cross-chain strategies are getting more advanced. Wallets often use assets on one chain to unlock opportunities on another or execute arbitrage across several networks at once. These intricate strategies become visible only when you have a full, multi-chain view of wallet activities, from trades and staking to lending and even NFT transactions.
Such comprehensive insights set the stage for effective visual analysis.
After gathering multi-chain data, visual tools transform it into actionable insights. Charts and graphs help you see how wallets cluster together based on trading behaviors and profitability. These visualizations make it easier to spot wallet groups that consistently perform well. To explore how data visualization can uncover profitable wallet patterns, read our post on Token Distribution Analyzer.
Profit pattern charts highlight timing and strategy trends within wallet clusters. For instance, they can reveal groups that consistently predict market movements or perform well under specific conditions. These patterns are often buried in raw data but become clear through visual analysis.
As DeFi usage grows, visualization tools are becoming more critical. By Q2 2024, daily dApp users exceeded 10 million, a 40% increase from the previous quarter. With this level of activity, manual data analysis is no longer practical. Visual clustering tools are essential for identifying profitable wallet behaviors at scale.
Interactive charts should allow users to zoom in from broad overviews to individual wallet performance. This feature helps pinpoint why certain wallets in a cluster excel, offering insights into the strategies that set them apart.
To round out the analysis toolkit, real-time alerts and historical data are indispensable. Together, they provide the tools needed to track trends and validate strategies. Real-time alerts notify you when profitable clusters make significant moves, giving you the chance to act on successful strategies as they develop. Historical data, on the other hand, offers the context needed to determine whether these moves are part of a larger trend or just short-term anomalies. For traders and developers, Smart Contract Security Risks in Liquidity Pools highlights how vulnerabilities in pool contracts can impact both performance and capital safety.
Alert systems should focus on cluster-wide behavior, not just individual wallets. For instance, if multiple wallets in a high-performing cluster start buying the same token or taking similar positions, it could signal a broader opportunity. Isolated wallet actions might not mean much, but coordinated activity within a cluster often points to larger market trends.
Historical data is equally important for backtesting strategies. By examining how wallet clusters performed during market crashes, bull runs, or volatile periods, you can identify which groups consistently succeed and which only thrive under certain conditions. This context helps you evaluate the reliability of different strategies.
Combining real-time alerts with historical data gives you a complete view of wallet behavior. You can spot emerging trends as they happen while using past performance to gauge the sustainability of those trends. This dual approach enhances the precision of cluster-based investment decisions.
Dive into some of the top platforms designed to analyze DeFi wallet clusters. These tools are especially helpful for US-based investors aiming to track and understand profitable wallet patterns.
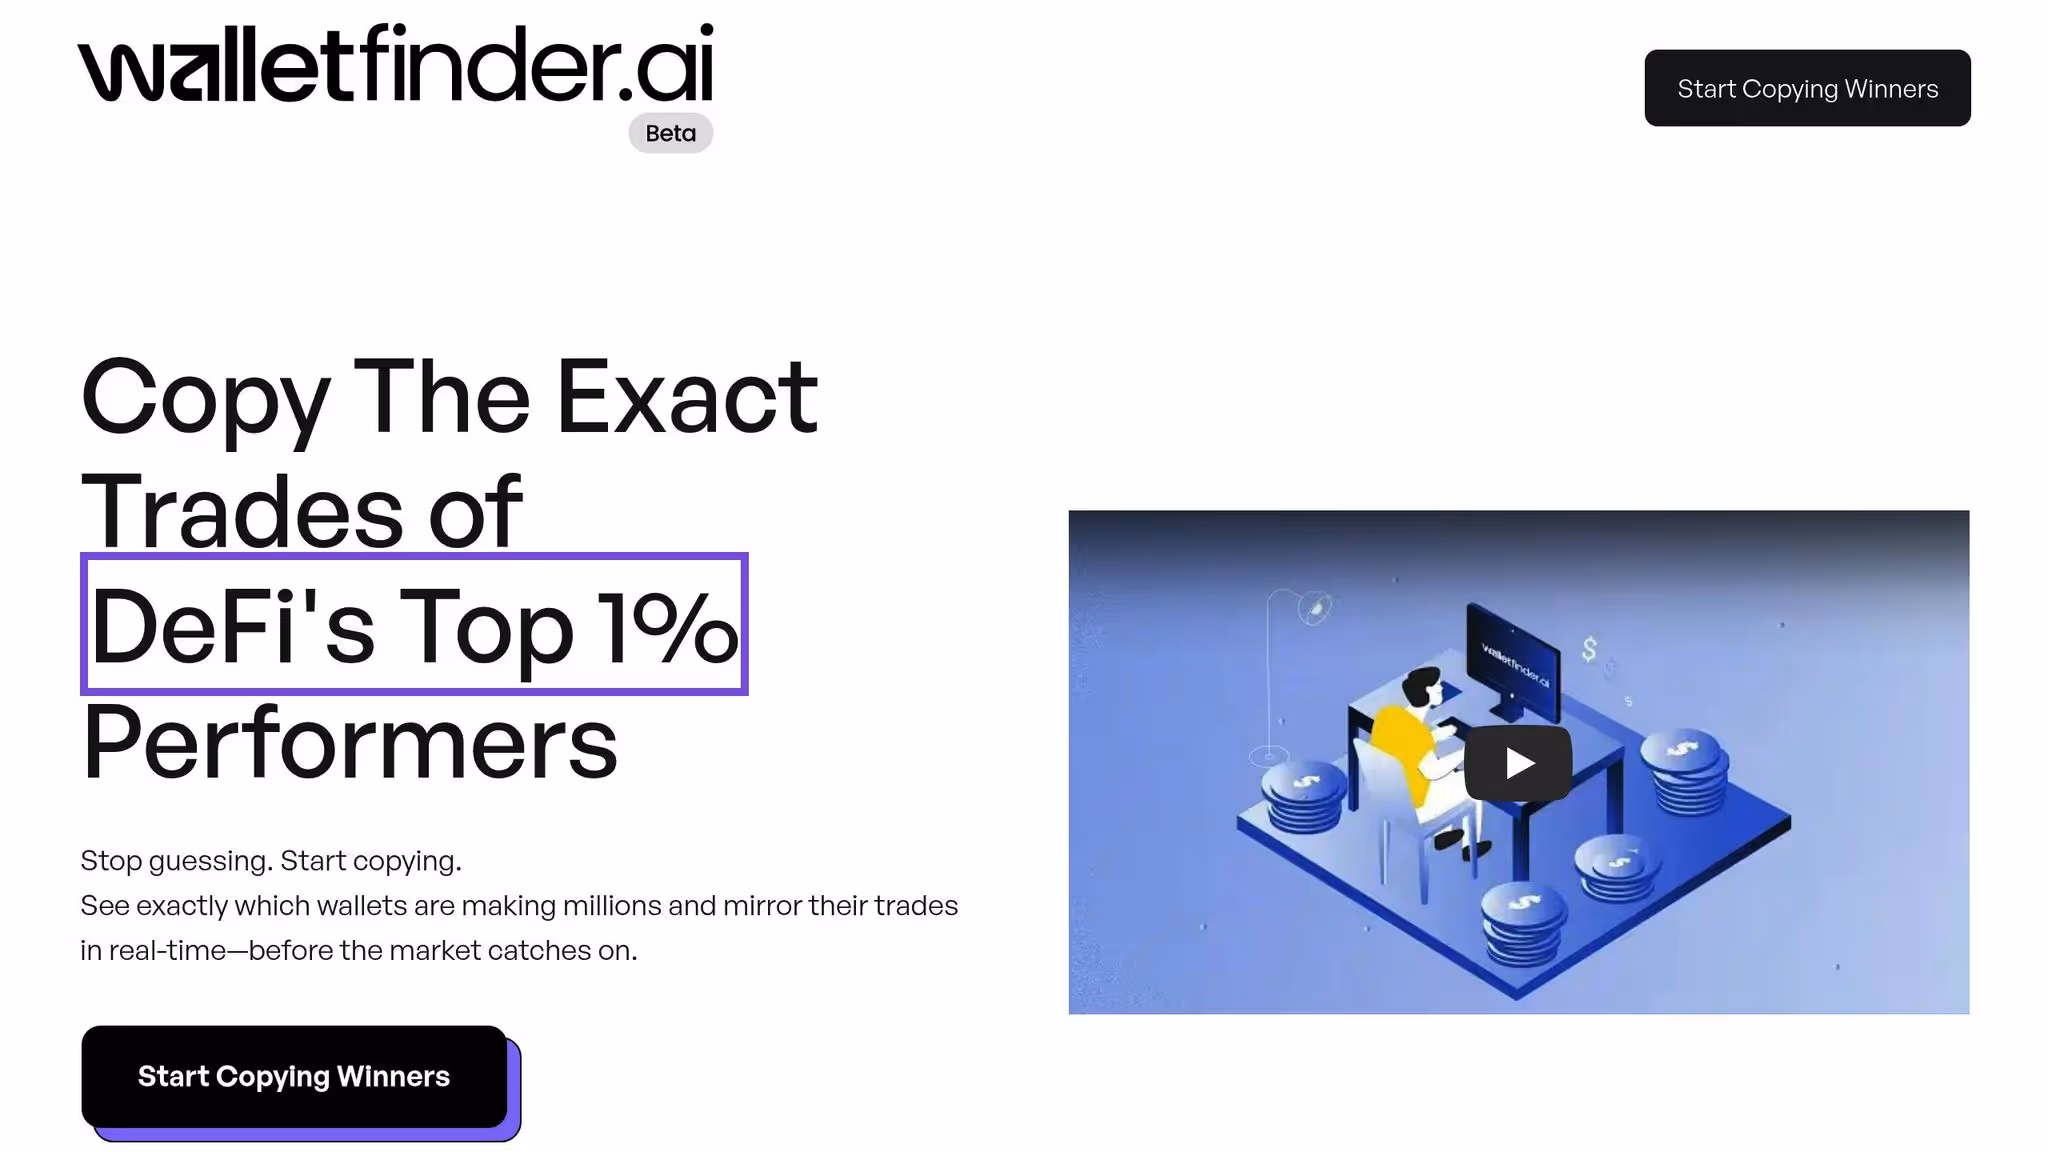
Wallet Finder.ai is a blockchain analytics platform that helps users discover profitable wallet clusters. It pulls real-time data from major blockchains like Ethereum, Solana, Base, and Arbitrum, all through an easy-to-use interface that simplifies cluster analysis.
"Wallet Finder.ai empowers DeFi traders to transform their investment strategies with precise blockchain analytics, providing detailed insights into wallet profitability, token performance, and trading activities across Ethereum, Solana, Base, and more."
The platform stands out with its advanced filtering options, which let users sort wallets by metrics such as All-Time High profit, alpha percentage, and trade speed. By focusing on "realized profit", users can get a clearer picture of trading performance. It also features real-time monitoring with Telegram alerts that notify users when tracked wallets make new trades. For deeper analysis, data can be exported in CSV, Excel, or PNG formats. Additionally, users can link their personal wallets to compare their performance against identified clusters.
Next, let’s look at how Nansen uses smart money tracking to shed light on profitable wallet clusters.
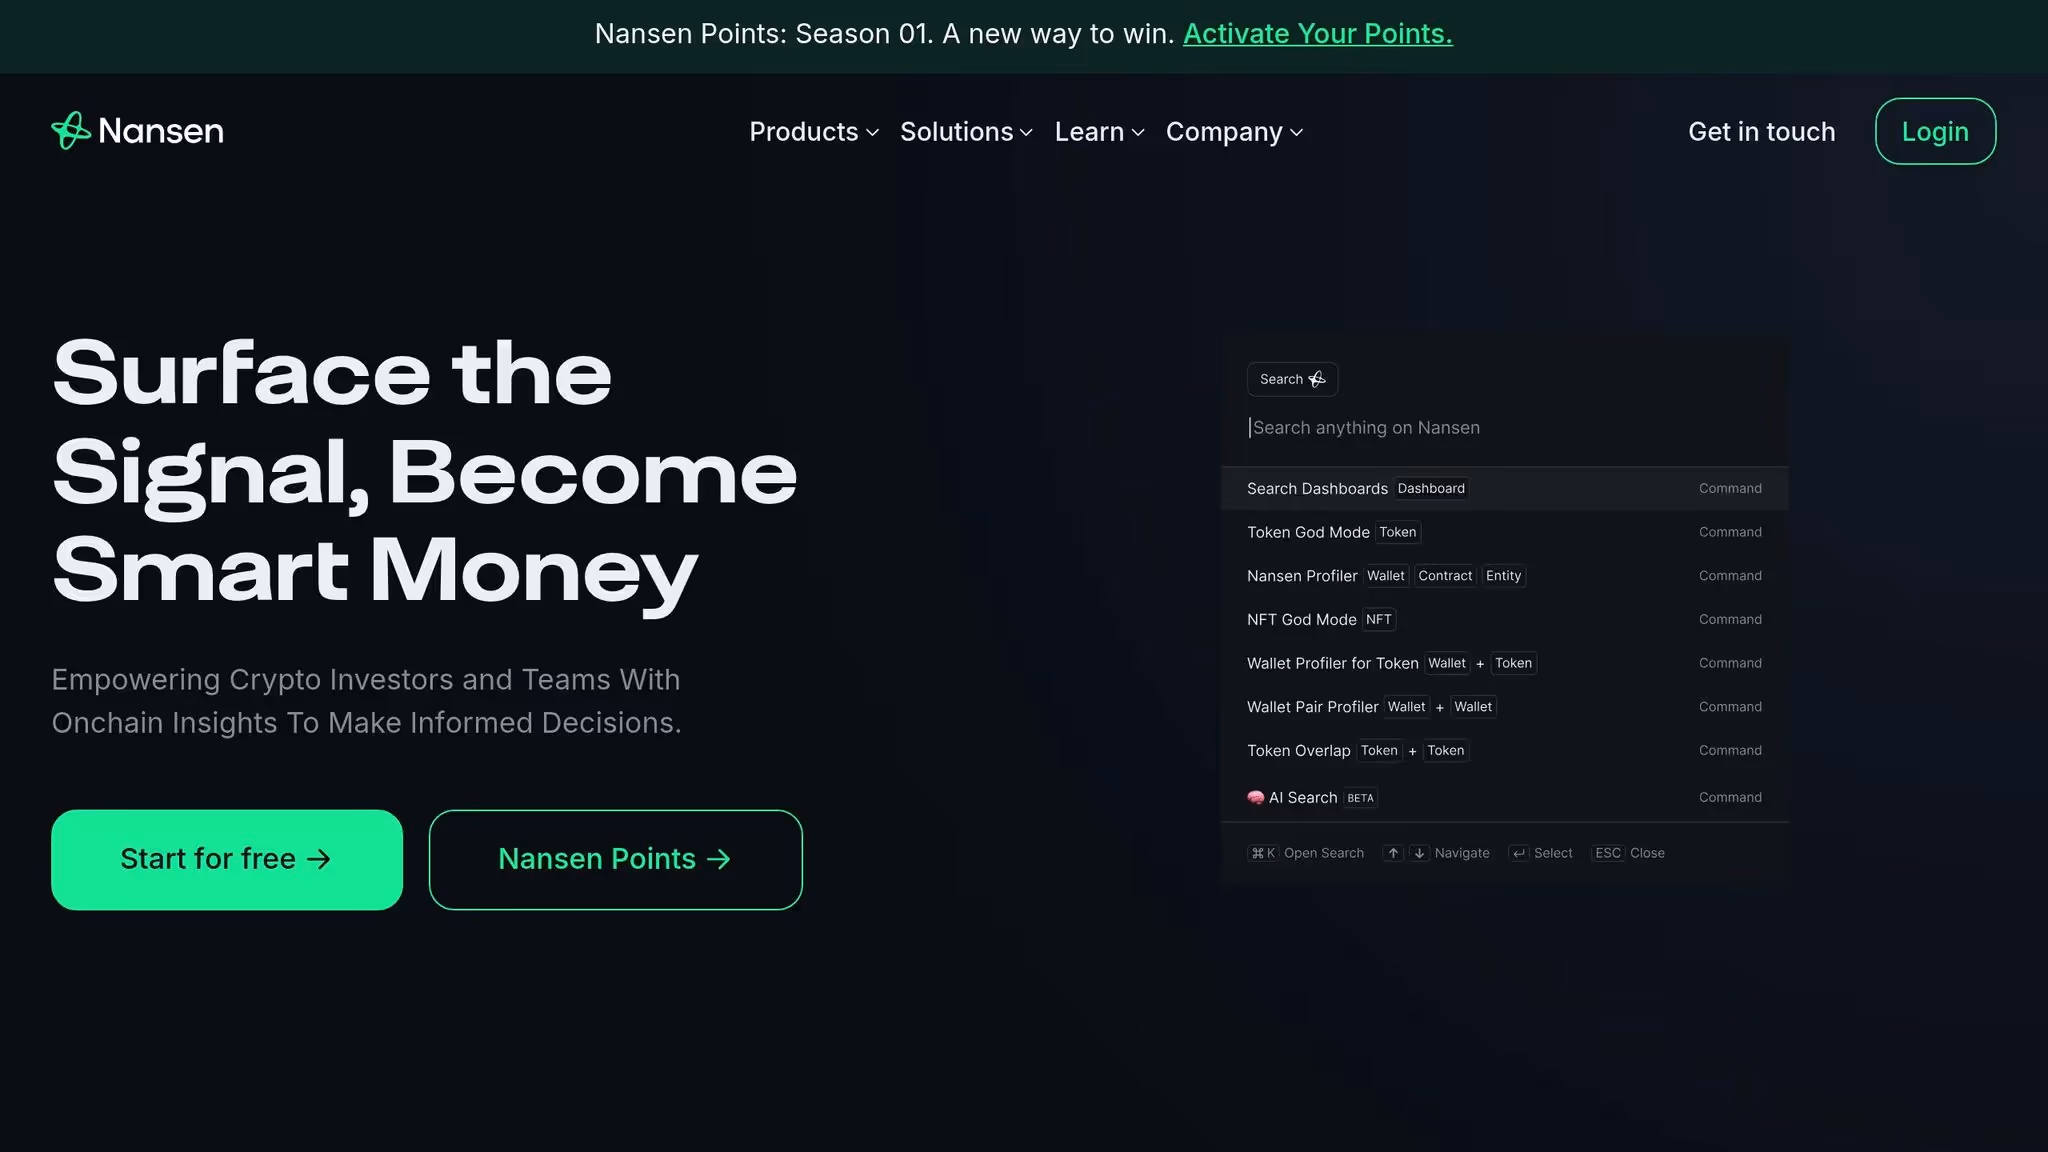
Nansen is a go-to platform for US investors looking to understand institutional strategies. It’s well-known for its wallet labeling system and smart money tracking, which categorizes wallets based on behavior and transaction history.
One of Nansen’s strengths is its ability to track "smart money" by grouping wallets tied to funds, whales, and experienced traders. These clusters help users identify and follow wallets that consistently show profitable strategies.
The platform also includes visualization tools, like interactive network graphs, which show relationships between wallets. These graphs reveal how wallets connect - whether through direct transactions, similar token purchases, or coordinated trades - offering valuable insights for users who want to uncover trading patterns and potential opportunities.
Nansen also tracks historical performance, helping users analyze how wallet clusters perform in different market conditions.

Bubble Maps takes a different approach by focusing on transaction flow visualization. It creates interactive charts that show how value moves between wallet clusters, making complex transaction patterns easier to understand.
Using transaction flow data, Bubble Maps identifies wallet clusters based on shared counterparties, similar transaction timing, and coordinated activities. These visualizations highlight groups of wallets that often move together or follow similar strategies.
The platform’s real-time tracking updates these visual clusters as new transactions happen, giving users the ability to see how wallet clusters evolve. Its pattern recognition tools also help identify recurring behaviors, which can be key for fine-tuning trading strategies. By breaking down complex relationships, Bubble Maps makes it easier for users to see how wallets interact within various networks.
For US investors navigating the complex world of DeFi trading, understanding clustering methods can sharpen investment strategies. These techniques rely on mathematical algorithms and data analysis to group wallets based on behavior, profitability, and transaction patterns.
Flow-based clustering focuses on tracking how funds move between wallets. By examining the timing and direction of transactions, it creates a network map of wallets with similar trading strategies.
The process begins by analyzing transaction flows over different time periods. Algorithms identify patterns, such as wallets that repeatedly trade the same tokens within short timeframes or those that frequently interact with each other. For instance, wallets buying the same altcoin within minutes may end up in the same cluster.
Subgraph analysis zooms in on smaller, tightly connected wallet groups within the larger blockchain network. Instead of evaluating every transaction, it focuses on clusters of wallets that coordinate large trades or display copy-trading behaviors.
Using graph theory, wallets are represented as nodes and transactions as edges. Algorithms like k-means or hierarchical clustering group wallets based on their connection strength and similar transaction patterns. This builds on flow analysis by identifying clusters with shared strategies.
Transaction mapping digs deeper into wallet behavior by analyzing trading habits, token choices, and timing strategies. It creates detailed profiles that reveal how wallets execute profitable trades.
Pattern correlation compares wallet histories to find similarities. It evaluates factors like trade sizes, preferred trading times, token holding durations, and profit-taking strategies. For example, wallets that consistently sell tokens after hitting a specific profit margin may be grouped together.
Statistical measures calculate the similarity between wallets, with high correlation coefficients often pointing to coordinated strategies or copy-trading relationships. This helps identify influential wallets that others might follow.
Time-series analysis adds another layer by examining how wallet behavior changes with market conditions. Algorithms track which clusters perform better during bull or bear markets, offering insights into strategy effectiveness under different scenarios.
These methods pave the way for more advanced tools that make the data easier to interpret.
Modern tools transform raw blockchain data into clear, actionable insights through visualizations and real-time integrations. These systems make it easier to understand wallet clusters and their trading strategies.
Network visualization is a popular approach, showing wallet clusters as interconnected nodes on a graph. Profitable clusters often appear as tightly connected groups, while less active wallets are more isolated. Color coding can highlight performance levels, making it simple to spot successful strategies.
API integration brings in real-time transaction data, ensuring that clustering analysis stays up-to-date with the fast-moving DeFi market. Automated alerts can notify users when new wallets join profitable clusters or when clusters change their trading behavior.
Heat maps offer another way to visualize activity, showing cluster performance across different time periods and token categories. For US investors, these maps can highlight clusters most active during American trading hours (9 AM to 4 PM EST) compared to other global sessions.
Understanding how to analyze DeFi wallet clusters effectively starts with choosing the right tools that can uncover patterns by grouping wallets with similar behaviors.
When selecting tools for cluster analysis, prioritize multi-chain support to capture opportunities across multiple networks - something single-blockchain tools can't do. Real-time data processing is another essential feature, ensuring that wallet classifications stay up-to-date as market conditions change. Advanced filtering options are crucial, too, allowing you to zero in on relevant clusters by factors like profit margins, trading frequency, or activity trends. Additionally, tools with data export capabilities let you dig deeper by analyzing clusters in external programs like Excel or Python, giving you the flexibility to pair insights with your own trading models.
If you're an investor in the US, here are some specific strategies to keep in mind:
Ready to dive into DeFi wallet analytics? Begin by experimenting with tools like Wallet Finder.ai, which offers a freemium option. This lets you explore wallet performance and analyze masked DeFi wallets without spending any money upfront.
Once you connect your wallet, establish a performance baseline and create custom watchlists to track high-performing wallet clusters. Set up Telegram alerts to stay informed about significant cluster movements. Use these tools to study trading behaviors, including entry and exit points and position sizing, helping you develop pattern recognition skills without feeling overwhelmed by data.
It's also important to distinguish between institutional and retail wallet clusters, as these groups often have different risk levels and time horizons. By analyzing blockchain transactions, you can identify wallets linked to the same entity, such as institutional players or large-scale traders ("whales"). Recognizing these differences is essential for tailoring your strategies and managing risks effectively.
Cluster analysis tools help investors in the US stay on the right side of financial laws by spotting unusual transaction patterns and grouping similar activities. This makes it easier to manage risks and meet regulatory standards.
These tools also sharpen DeFi trading strategies by revealing market trends, identifying the best times to buy or sell, and supporting smarter, data-backed decisions. By studying wallet activity and trading patterns, investors can boost performance, lower risks, and navigate the fast-moving DeFi market with greater confidence.
Multi-chain support allows users to monitor and analyze assets across various blockchain networks, giving them a clearer picture of their holdings and activities. This feature makes it easier to track wallet behavior, understand transaction trends, and follow the movement of assets between chains.
With this expanded perspective, users can make smarter trading choices, improve how they manage liquidity, and detect risks across different networks. Plus, real-time transaction monitoring keeps users updated on market shifts, helping them seize opportunities at the right moment.
Visualization tools take the complexity of blockchain data and turn it into something much easier to grasp, like charts or transaction flow diagrams. These visual aids help users quickly spot trends, such as clusters of large transactions or repeating patterns that could hint at opportunities for profit.
By showcasing unusual activity or consistent behaviors, these tools give users the insights they need to make smarter decisions, fine-tune trading strategies, and uncover potential risks when dealing with DeFi wallets.
{"@context":"https://schema.org","@type":"FAQPage","mainEntity":[{"@type":"Question","name":"How can cluster analysis tools help US investors improve compliance and enhance their DeFi trading strategies?","acceptedAnswer":{"@type":"Answer","text":"<p>Cluster analysis tools help investors in the US stay on the right side of financial laws by spotting unusual transaction patterns and grouping similar activities. This makes it easier to manage risks and meet regulatory standards.</p> <p>These tools also sharpen <a href=\"https://www.walletfinder.ai/blog/defi-tokens-strategies\">DeFi trading strategies</a> by revealing market trends, identifying the best times to buy or sell, and supporting smarter, data-backed decisions. By studying wallet activity and trading patterns, investors can boost performance, lower risks, and navigate the fast-moving DeFi market with greater confidence.</p>"}},{"@type":"Question","name":"How does multi-chain support improve DeFi wallet analysis and trading strategies?","acceptedAnswer":{"@type":"Answer","text":"<p>Multi-chain support allows users to monitor and analyze assets across various blockchain networks, giving them a clearer picture of their holdings and activities. This feature makes it easier to track wallet behavior, understand transaction trends, and follow the movement of assets between chains.</p> <p>With this expanded perspective, users can make <strong>smarter trading choices</strong>, improve how they manage liquidity, and detect risks across different networks. Plus, real-time transaction monitoring keeps users updated on market shifts, helping them seize opportunities at the right moment.</p>"}},{"@type":"Question","name":"How do visualization tools in cluster analysis help uncover profitable wallet behaviors in DeFi?","acceptedAnswer":{"@type":"Answer","text":"<p>Visualization tools take the complexity of blockchain data and turn it into something much easier to grasp, like charts or transaction flow diagrams. These visual aids help users quickly spot trends, such as clusters of large transactions or repeating patterns that could hint at opportunities for profit.</p> <p>By showcasing unusual activity or consistent behaviors, these tools give users the insights they need to make smarter decisions, fine-tune trading strategies, and uncover potential risks when dealing with DeFi wallets.</p>"}}]}

A premier DeFi analytics platform empowering traders to discover and analyze profitable blockchain wallets, trades and tokens.

