
Recovery Factor Calculation for Smart Traders
Master the recovery factor calculation to measure a strategy's resilience. Learn the formula, see DeFi examples, and find top wallets with Wallet Finder.ai.

June 20, 2026


Wallet Finder
February 24, 2026

Forget trying to guess if Bitcoin is going to the moon or crashing to zero. There's a smarter way to play the crypto markets, one that doesn't rely on being right about the overall market direction. It's called pair trading, and it’s a game-changer for anyone tired of the endless bull vs. bear debate.
Pair trading is a market-neutral strategy that profits from the relationship between two cryptocurrencies, not their individual prices. You're not betting on a coin going up; you're betting on the price gap between two related coins returning to normal.
Most traders live and die by directional bets. They buy, hope it goes up. They short, hope it goes down. But what if you could make money when the market is just chopping sideways? Or even during a crash?
That’s the whole point of pair trading. It’s a strategy built on relative value, and it thrives in the volatility crypto is famous for.
The core idea is simple: find two tokens that are joined at the hip, a bit like two dance partners who almost always move in sync. Every now and then, one stumbles or leaps ahead, and their synced movement breaks. That temporary divergence is your trading opportunity.
Let's use a classic example: Ethereum (ETH) and Lido Staked Ether (stETH). These two are meant to trade at a nearly 1:1 ratio. But sometimes, market stress or liquidity issues can knock that ratio out of whack.
Imagine stETH suddenly dips and is only worth 0.95 ETH. A pair trader sees this and immediately jumps into action:
The profit doesn't come from ETH's price soaring or tanking. The win comes when the spread between them snaps back. Once stETH climbs back to its normal peg against ETH, the trader closes both positions and banks the difference.
The beauty of this is that your exposure to the wider market is tiny. Since you have both a long and a short position open, a sudden market-wide pump or dump has a much smaller impact on your bottom line.
This isn't your typical "HODL" strategy. Pair trading is a form of statistical arbitrage. Success hinges on solid statistical analysis of the relationship between two assets, not on gut feelings or Twitter hype about a single coin.
It's a complete mindset shift. You stop being a price forecaster and become an analyst of spreads and mean reversion.
The advantages of taking a market-neutral stance are clear:
In this guide, we’ll walk through the entire process—from finding promising pairs and setting entry/exit rules to managing risk. Let's turn raw on-chain data into a real, tradable edge.
Moving from theory to a live trading strategy takes a systematic, data-driven approach. A solid framework is the absolute backbone of any successful crypto pair trading plan, as it’s designed to turn market noise into clear, actionable signals. The goal here is to replace guesswork with a repeatable process.
The first and most critical job is to find pairs that are genuinely connected. It's easy to get fooled—lots of coins might seem to move together, but looks can be deceiving. A simple correlation check just doesn't cut it, because two assets can trend in the same direction without having a stable, long-term economic link.
This is where statistical rigor becomes your best friend. We need to find pairs that aren't just correlated but are cointegrated. What that means is even when their prices drift apart for a bit, a powerful statistical force tends to pull them back together. That's the whole game.
Finding these true relationships is a two-step process, and it hinges on the right statistical tests. Think of cointegration as the gold standard; it confirms a real, mean-reverting relationship, which is the entire premise of pair trading. A high correlation, on the other hand, might just mean both assets are reacting to a third factor—like Bitcoin's price swings—without being fundamentally tied to each other.
The power of this strategy isn't just theoretical. One analysis of 33 major cryptocurrencies really put it to the test. The study pinpointed cointegrated pairs and traded them whenever their price spread deviated by more than two standard deviations. The results were incredible, achieving an average 12% monthly abnormal return after factoring in transaction costs.
Even more telling, in just one six-month window, the BTC-ETH pair alone drove a 43.4% portfolio return. This wasn't luck; it was a testament to a statistically sound model.
To find these opportunities yourself, you have to pick the right tool for the job. Each statistical method has its strengths and is better suited for different types of analysis. Let's break down the two main approaches.
Ultimately, cointegration is what separates a robust strategy from a fragile one. Relying only on correlation is like building a house on a shaky foundation—it might stand for a little while, but you know it’s eventually going to collapse.
Once you’ve locked in a genuinely cointegrated pair, the next move is to quantify their relationship and set rock-solid rules for getting in and out of trades. We do this by calculating the price ratio (Asset A Price / Asset B Price) and then normalizing that ratio using a z-score.
The z-score is a game-changer. It tells you exactly how many standard deviations the current price ratio is from its historical average. A z-score of 0 means the pair is trading right at its historical mean. A z-score of +2 means the ratio is two standard deviations above its average, signaling one asset is overvalued relative to the other.
This standardization is what creates universal trading signals. A z-score of +2 for an ETH/SOL pair means the exact same thing as a +2 for an ARB/OP pair—it’s a statistically significant deviation that screams "potential trade."
Your trading rules could look something like this:
This entire process—diverge, trade, and converge—is the classic flow of market-neutral trading.
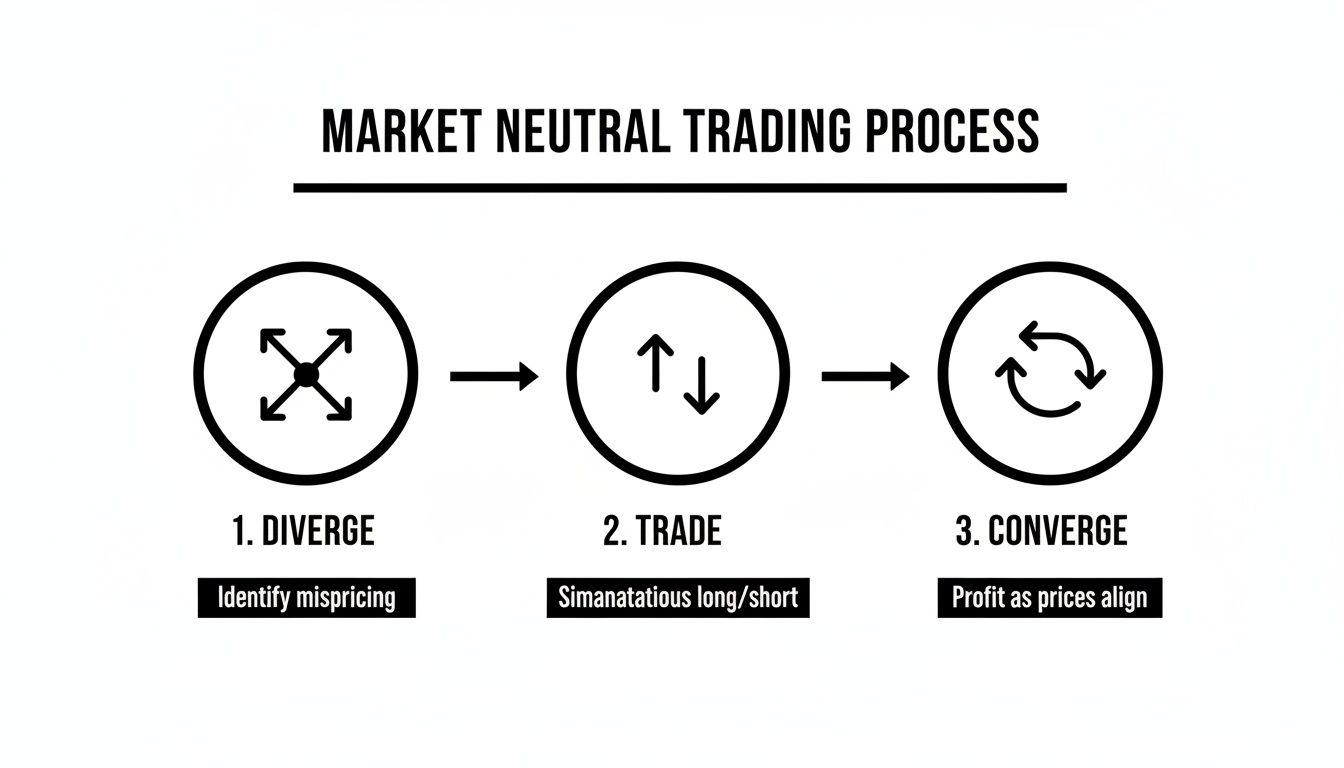
As the diagram shows, you're betting on the relationship between two assets returning to its historical norm, and that's where the profit is captured.
By building this type of framework, you create a disciplined system that strips out emotion and relies purely on statistical probabilities. To expand your knowledge and discover more ways to apply this thinking, you can explore some innovative pairs trading strategies.
You've done the hard work of finding a statistically solid pair. Now comes the part where discipline makes or breaks you: execution. This is where your strategy gets real. Knowing when to enter is one thing, but knowing exactly how to enter and, more critically, when to get out, is what separates the pros from the crowd.
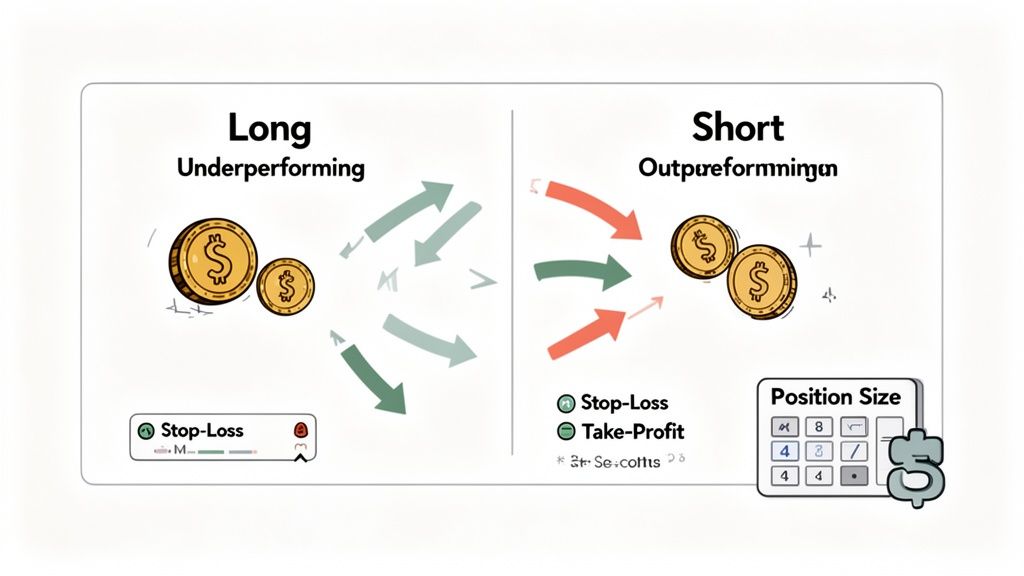
The mechanics are pretty straightforward. Once your z-score hits a trigger point—let’s say +2.0—it’s go-time. You’ll place two trades at the exact same time: go long (buy) on the asset that’s lagging and short (sell) the one that’s outperforming. This move creates a market-neutral position. You’re no longer betting on whether the market goes up or down, just on the spread between your two chosen assets snapping back to normal.
Before you even think about clicking "buy" or "sell," you must have two non-negotiable exit points locked in. There's zero room for winging it here. A statistical strategy leaves no place for gut feelings or emotion. Your exits are both your safety net and your profit-taking plan.
Here are your only two ways out:
The biggest mistake I see traders make is holding onto a losing pair trade, hoping it will "come back." If the statistical relationship that underpinned your entire trade thesis breaks down, the trade is invalid. Period. The only smart move is to cut the loss and move on.
Risk management is the absolute foundation of any trading strategy, and in the wild west of crypto, it's your lifeline. Without it, even a perfect system will eventually blow up. You need to master three things: position sizing, hard stops, and your risk-to-reward ratio.
Every single trade should have a clear and attractive risk-to-reward ratio. If your take-profit target (the spread returning to zero) could net you $300, and your stop-loss is set at a maximum loss of $100, your risk-to-reward ratio is a solid 3:1. This kind of asymmetry is how you build a profitable track record over the long haul.
This isn't just theory; the data backs it up. Backtesting a cointegrated ETC-FIL pair showed just how powerful a well-managed system can be. The strategy generated an average winning trade of $344,000 while the average loss was just $61,372. That’s an incredible 5.6:1 win/loss ratio.
Even better, the annualized volatility was only 17.26%—a fraction of what you normally see in crypto. This is the beauty of a market-neutral approach: the potential for steady gains without the gut-wrenching volatility.
To truly master your risk, it helps to understand concepts like the probability of going broke. A risk of ruin calculator can be a real eye-opener. When you combine precise execution with iron-clad risk controls, pair trading evolves from a cool concept into a professional, sustainable strategy.
An untested trading strategy is really just a good idea. To turn that idea into a professional, data-backed system, you absolutely must backtest it. This is the process where you simulate your strategy on historical market data to see how it would have performed, exposing its strengths, weaknesses, and true profit potential before a single dollar is on the line.
Think of backtesting as your strategy's trial by fire. It takes your crypto pair trading approach out of the realm of theory and into a world of cold, hard statistical proof.
You get to test different z-score thresholds for your entries and exits, play with various stop-loss levels, and see exactly how your chosen pairs behaved during a wild bull run, a gut-wrenching crash, or a long, boring stretch of sideways chop. The whole point is to generate performance metrics that give you a clear, unbiased picture of whether your system actually works. Without this step, you're just gambling.
When you run a backtest, you’re not just looking for a positive PnL. Staring at the final profit number is a rookie mistake that ignores the journey—and in trading, the journey is often more important than the destination.
You need a complete dashboard of metrics to truly understand your strategy's performance and risk profile. Focus on these essentials:
A strategy with a 40% win rate but a profit factor of 3.0 is far superior to one with a 70% win rate and a profit factor of 1.1. It's not about how often you win; it's about how much you make when you're right versus how much you lose when you're wrong.
Backtesting is incredibly powerful, but it’s also riddled with traps that can give you a dangerously false sense of confidence. If you're not careful, you can create a strategy that looks like a world-beater on paper but completely falls apart the second it touches a live market.
You have to aggressively avoid two major pitfalls:
Recent research shows how sophisticated models are pushing the boundaries, even in crypto's chaotic markets. One deep learning pairs trading strategy, tested on extensive crypto data, hit a remarkable 71.68% win rate by dynamically forecasting the spread between pairs. This adaptive approach worked far better than rigid, traditional models, proving that robust systems can be built. You can read the full study to see where the pros are taking this.
Ultimately, a good backtest is an honest one. Use a portion of your historical data to build the strategy (this is your "in-sample" period) and a separate, untouched portion to validate it (the "out-of-sample" period). If your strategy still performs well on data it has never seen, you might just have a real edge.
For those wanting to go even deeper, check out our complete guide on how to backtest trading strategies. This is the process that transforms a hypothesis into a proven advantage.

Backtesting your strategy against historical price data is a great starting point, but it's like driving by only looking in the rearview mirror. To get a real-time advantage in crypto pair trading, you have to look at the blockchain itself.
On-chain analysis gives you a live, transparent view of every transaction as it happens. It’s a layer of intelligence that historical charts just can't provide. Instead of relying solely on your own statistical models, you can see what the most profitable traders are doing right now. This is where you find a genuine edge—by identifying and tracking the "smart money" already running successful pair trades.
This creates an incredibly valuable feedback loop. Imagine you get an alert that a top wallet just sold OP and bought ARB. You can immediately pull up your own z-score chart for that pair. If their trade lines up with a statistical entry signal you've already identified, it provides powerful confirmation for your own idea.
Watching these traders is just the start. The real magic happens when you start deconstructing their strategies. Export the complete trading history of a target wallet to dig into their patterns.
You’re looking for answers to some key questions:
This level of detailed analysis turns you from a simple copy trader into a strategic analyst. You aren't just mirroring trades; you're learning from the best, validating your own models, and sharpening your pair trading approach with live, actionable market data.
Combining your own statistical work with this on-chain intelligence gives you a powerful, two-layered advantage that very few other traders have. This approach transforms the blockchain from a simple ledger into a dynamic source of tradable alpha.
When you first dive into pair trading, a flood of questions is perfectly normal. How do I pick the right assets? How does shorting even work in DeFi? What happens when a pair suddenly breaks its historical relationship? Getting clear on these points from the start is what separates a sharp, focused strategy from one that fizzles out.
Relying on machine-driven insights and on-chain data is always going to beat pure guesswork, especially when the market gets choppy. Let's walk through some of the most common hurdles so you can use statistical methods and tools like Wallet Finder.ai to build a real edge.
Your choice of assets is a trade-off between liquidity and opportunity. Large-cap coins like BTC and ETH are highly liquid, which means their price gaps tend to snap back to the mean in a predictable, gentle fashion. On the other hand, mid-cap tokens can be a lot noisier, but that noise often creates wider, more profitable spreads.
I’ve found the strongest pairs are often tokens within the same ecosystem. Think about Layer 2s like ARB and OP, or liquid staking tokens like stETH and rETH. Because their value is tied to shared fundamentals, they often show high cointegration. This translates to tighter deviation ranges and much faster reversions to the mean.
A few things to keep in mind:
Your first and most important job is to pick assets with a proven historical relationship. Don't even think about placing a trade until you've validated this.
Shorting in the DeFi space might sound complex, but it's really just a matter of using borrowing protocols like Aave or Compound. The process lets you bet against an asset without touching a centralized exchange.
Here’s the basic mechanical flow:
This is the key to creating market-neutral opportunities directly on-chain, freeing you from the constraints and fees of CEXs.
Can you pair trade something like DOGE or SHIB? Technically, yes, but it’s like playing with fire. Memecoins can diverge wildly and stay that way for a long time, completely ignoring any statistical relationship they once had.
A strategy that boasts a win rate above 60% on memecoins might look good on the surface, but it's often hiding massive tail risks. One bad trade can wipe out dozens of small wins.
Here’s a quick risk comparison:
If you decide to venture into high-volatility pairs, you absolutely need to use extra margin for safety and implement much tighter stop-losses. Always, always test the spread’s cointegration rigorously before putting any real capital on the line.
This is the big one. What do you do when two tokens that have always moved together suddenly don't? You have to have a plan in place to cut your losses on the combined pair. No exceptions.
I recommend defining a pair-level stop-loss before you even enter the trade. For example, you might decide to close the entire position if it shows a loss of 3% of your portfolio value. This acts as a circuit breaker and protects you from a prolonged, catastrophic breakdown.
Periodic re-testing of your pair's statistics is non-negotiable. Run a walk-forward analysis on a sliding window of data to see if the relationship still holds. I do this monthly or quarterly to clean out pairs that are no longer valid and replace them with fresh ones.
Think of regular statistical checks as your primary defense against sudden regime shifts in the crypto markets. It’s your strategy’s immune system.
This is where combining data with on-chain signals becomes so powerful. Wallet Finder.ai alerts can warn you the moment a top trader you're tracking exits their pair trade, giving you a live confirmation that something might be wrong with the relationship.
Of course. Let's make this tangible.
Imagine the ETH/stETH spread, which normally hovers around a 1-to-1 peg, suddenly widens to 0.97. Your model detects a z-score of -2.2, a clear statistical signal that the pair has deviated too far from its mean.
You spring into action, going long on the "undervalued" asset (stETH) and simultaneously shorting the "overvalued" one (ETH).
Just 72 hours later, the market corrects itself. The spread snaps back toward the peg. You close both legs of your trade as the ratio realigns. That small deviation just netted you a profit of 0.02 ETH per stETH token. On an asset priced at $1,500, that’s a quick $30 gain per token.
A few key takeaways from this example:
Small, consistent gains are the name of the game. Executed with precision, these little deviations add up to a reliable source of profit.
This is exactly how a structured pair trading strategy works—it turns small, temporary market inefficiencies into a repeatable process. You can even find these opportunities by watching what the pros do.
By combining your own statistical triggers with live on-chain signals from proven traders, you build maximum confidence into every move you make.
Ready to follow top traders and boost your edge? Try Wallet Finder.ai for a 7-day trial. Discover profitable wallets, set real-time alerts, and mirror winning pair trades instantly.

A premier DeFi analytics platform empowering traders to discover and analyze profitable blockchain wallets, trades and tokens.

