
Recovery Factor Calculation for Smart Traders
Master the recovery factor calculation to measure a strategy's resilience. Learn the formula, see DeFi examples, and find top wallets with Wallet Finder.ai.

June 20, 2026


Wallet Finder
February 17, 2026

Think of the DeFi Boost Meter as your 'market pressure gauge' for crypto. It cuts through the noise of price charts and speculation to give you a simple, powerful score based on what smart money is actually doing on-chain.
Instead of just watching the price, the Boost Meter gives you a look behind the curtain, showing you the real momentum driving a token. It's built to help you base your decisions on evidence, not just hype.
In DeFi, price charts are only one piece of the puzzle. The real story unfolds on the blockchain, where every transaction tells you something about market sentiment. But trying to make sense of all that raw data is like trying to hear a single voice in a roaring crowd.
That's exactly what the DeFi Boost Meter is designed to fix.
It works by pulling together multiple high-conviction signals all at once. It’s less like a crystal ball and more like the dashboard in your car. Sure, you can see your speed, but the dashboard also shows your engine temperature and fuel level—all the vital signs that tell you how the car is really doing. The Boost Meter does the same for a token's health, going far beyond surface-level price action.
The meter takes complex on-chain activity and boils it down to one easy-to-read score. By focusing on what the most influential players are doing, it spots early signs of buying or selling pressure, often long before the market catches on.
Here are the key signals it’s watching:
With the DeFi market projected to hit an eye-watering USD 1,417.65 billion by 2033, tools like this are becoming essential. The DeFi lending space alone has USD 19.1 billion in open borrows, spread across countless platforms. This complexity is exactly where the opportunity lies for tools that can cut through the chaos. You can find out more about the explosive growth of the DeFi market.
When you see a rising Boost Meter score, it doesn’t just mean people are buying. It means the right people are buying—wallets with a proven track record. It’s the difference between random market noise and genuine momentum.
Reading the meter is simple. We've designed it to give you an at-a-glance understanding of market conditions so you can quickly gauge what's happening.
This table breaks down what each reading means for your strategy.
Meter ReadingInterpretationPotential Market ActionExtreme BullishOverwhelming buying pressure from smart money and whales.Strong conviction for a potential upward price movement.HighSignificant accumulation is underway; momentum is building.Positive signal, indicating growing interest from key players.ModerateBalanced on-chain activity with no strong directional bias.Neutral conditions; a 'wait and see' approach is often best.BearishSmart money is distributing or selling assets.A warning sign of potential downward price pressure.
Ultimately, the meter is there to give you a clear, data-driven edge, helping you time your moves based on smart-money conviction.
The DeFi Boost Meter isn’t a black box spitting out random numbers. It's a data engine that looks "under the hood" of the blockchain to see what the most influential players are doing. It works by combining distinct, high-conviction on-chain signals into a single, easy-to-read score.
These signals were handpicked because they represent real market conviction, cutting through the noise of everyday retail chatter. Instead of getting lost tracking thousands of random wallets, the meter hones in on the specific actions that have historically preceded major price moves.
This graphic breaks down how raw, messy blockchain data gets refined by the Boost Meter into a clean market score.
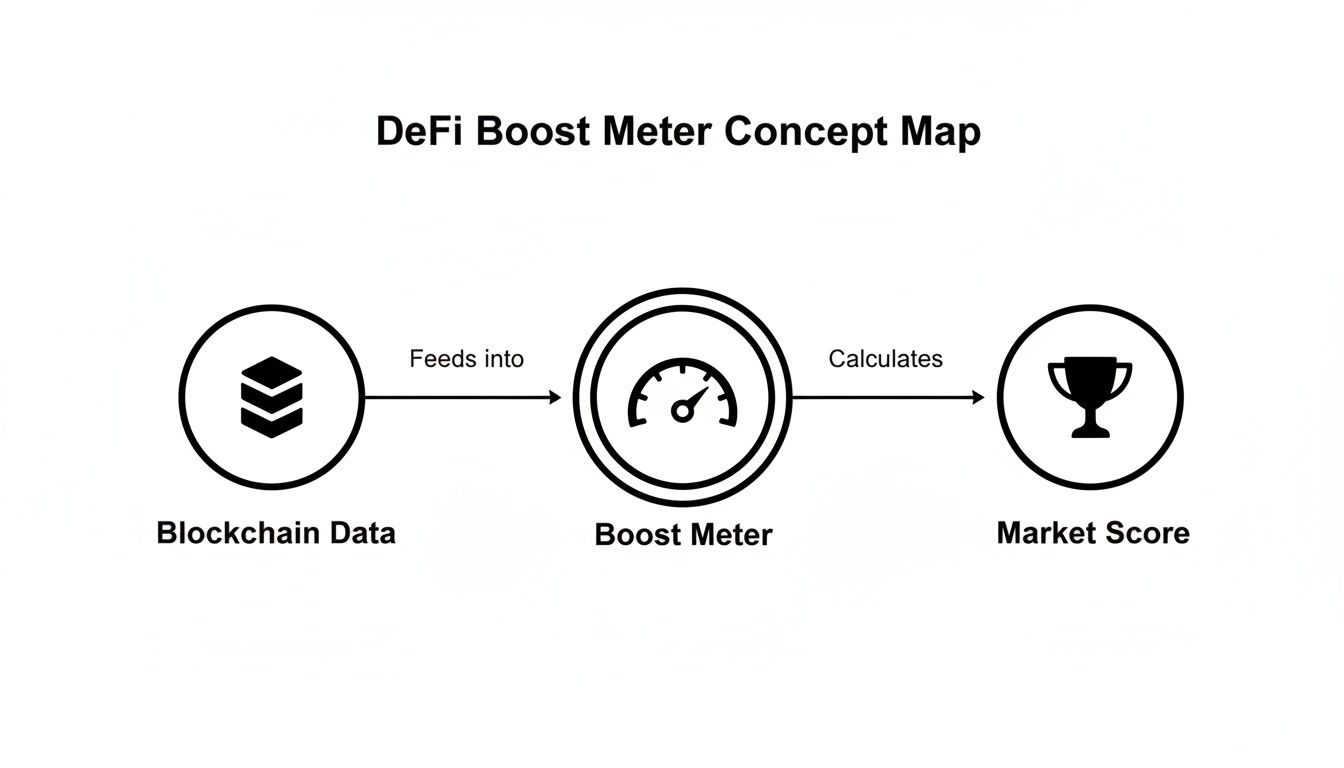
This entire process is designed to turn complex on-chain activity into an insight you can actually use.
In the crypto ocean, whales are wallets holding a massive amount of a specific token. When they move, they make waves. Tracking their behavior gives us a direct line into the sentiment of the market's biggest players. When whales start steadily buying up a token, it’s rarely a random whim—it’s a calculated move based on deep conviction.
The meter keeps an eye on these patterns by monitoring:
A big spike in whale accumulation is often a heads-up that deep-pocketed investors think an asset is undervalued and are positioning for a rally. It's one of the most trusted indicators of institutional interest.
Whales have size, but "smart money" has skill. These are wallets we’ve identified based on their proven track record of profitability—traders who consistently beat the market. Their capital is nimble, informed, and often shows up right before a token takes off.
The DeFi Boost Meter identifies these wallets and follows their money to see where the most successful traders are placing their bets.
Watching smart money is like getting to look over a pro trader’s shoulder. You see their moves as they happen, backed by their own capital and a history of winning. This signal is all about skill, not just the size of the wallet.
This signal is powerful because it reflects the actions of people who have proven they know how to navigate crypto's wild swings. A sudden inflow from these wallets into a token can be a sign of a hidden gem.
Exchange netflow is a classic on-chain metric for a reason. It simply measures how many tokens are moving onto exchanges versus how many are moving out. It’s a straightforward but incredibly effective way to gauge supply and demand pressure.
Here's the logic:
The Boost Meter analyzes these flows to spot accumulation or distribution trends before they show up in the price.
Finally, the meter looks at signals tied to adoption and social buzz. A project's momentum isn't just about the big players; it's also about a growing community and genuine engagement.
Here, the meter measures two things:
By blending these four pillars—whales, smart money, exchange flows, and adoption signals—the DeFi Boost Meter gives you a complete, 360-degree view of a token's real on-chain strength.
The four signals powering the Boost Meter — whale accumulation, smart money flow, exchange netflow, and social velocity — are not equally useful at all times. Each carries a predictive window, a period during which it has meaningful forward-looking value. After that window closes, the signal is describing history rather than opportunity. Understanding signal decay is the difference between acting on fresh intelligence and acting on a stale data trail that has already been priced in.
Whale accumulation has the longest useful window of any on-chain signal, typically 24 to 96 hours. Whales accumulate deliberately and over extended periods because large position building takes time without moving the market against themselves. A whale accumulation signal from 12 hours ago is still highly relevant. One from 5 days ago may already have been the catalyst for a price move that has since played out. When evaluating whale accumulation data, always check the timestamp of the transactions driving the signal, not just the aggregate score. Accumulation that is still ongoing, with transactions from the last 4 to 12 hours, is a live signal. Accumulation that peaked 72 hours ago and has since slowed is a signal that has likely already delivered its price impact.
Smart money inflow decays fastest. The wallets tracked as smart money are frequently among the fastest executers in the market. When a cluster of high-PnL wallets buys into a token, their collective purchase often catalyzes the price move within hours rather than days. A smart money inflow event that occurred 18 to 24 hours ago and has not produced price movement yet is either early-stage accumulation ahead of a delayed catalyst, or a signal that did not play out and whose window has closed. The actionable interpretation differs radically. Smart money signals are most valuable in the first 6 to 12 hours after detection. After 24 hours without price follow-through, treat them as context rather than a live entry trigger.
Exchange netflow occupies the middle ground. Sustained exchange outflow over 24 to 48 hours represents genuine long-term holding intent and remains relevant longer than a single large outflow event. A sudden large outflow spike — one or two transactions moving significant supply to cold wallets — has a predictive window of roughly 12 to 18 hours before the scarcity premium is either reflected in price or dissipated by other supply entering the market. Monitoring the trend of netflow over 48 to 72 hours gives more reliable signal than any individual outflow transaction.
Social velocity decays the fastest of all four signals, typically within 2 to 6 hours. Social media attention in crypto is fleeting. A trending token at 9 AM has usually peaked its attention cycle by early afternoon. Social velocity signals are most useful as short-term momentum confirmation — useful for timing entries in already-identified setups, not as standalone reasons to initiate a position. By the time social velocity appears high on a composite score, the entry window for that momentum cycle is often already closing.
The practical implication for reading the Boost Meter is to not treat a high composite score as a single synchronous signal. A score incorporating a 4-hour-old smart money inflow, a 48-hour-old whale accumulation trend, a current exchange outflow spike, and surging social velocity represents very different trade quality than a score built from a 3-day-old whale purchase, a 2-day-old smart money buy, and today's social mention spike. The former is a live, multi-signal convergence. The latter is mostly stale data with a social media overlay that may reflect price action that already happened rather than price action about to happen.
Knowing what the DeFi Boost Meter is telling you is one thing. Actually turning those signals into profitable trades? That's the real game. The meter isn't a magic crystal ball, but it's an incredibly powerful tool for nailing your timing, managing risk, and backing up your trading ideas with solid on-chain data.
A common mistake is to just buy when the meter is high and sell when it's low. A much smarter play is to weave its readings into your entire trading plan. For instance, an 'Extreme' reading can be the final piece of the puzzle, giving you the green light to jump on a breakout you were already eyeing.
This kind of on-chain insight is becoming non-negotiable. The total value locked (TVL) in DeFi protocols shot past USD 68.3 billion in 2024, a jump of nearly 40% from the year before. And with over 790 new DeFi products hitting the market in 2024 alone, the noise is getting louder. A tool like the DeFi Boost Meter cuts right through it. You can dig deeper into this explosive growth in this comprehensive DeFi market report.
Think of a high Boost Meter score as your green light. It's a clear signal that smart money and whales are building positions. This is your cue to move from the sidelines into the action.
Here are two actionable ways to use it:
The meter is just as crucial for protecting your capital as it is for finding entries. When momentum starts to fade, the meter is often your first warning.
So many traders hold on to a winning trade for too long, only to watch their profits vanish. The DeFi Boost Meter acts as your objective co-pilot, taking emotion out of the equation and telling you when the smart money is quietly heading for the exits.
Here's how to use it to manage risk:
This table outlines specific strategies for each level of the DeFi Boost Meter. Think of it as your cheat sheet for turning raw on-chain data into confident trading decisions.
Boost Meter LevelPrimary StrategyRisk Management TacticConfirmation Signal to Look ForExtreme BullishEnter or add to a position with high conviction.Use a wider stop-loss to account for volatility but be ready to take initial profits.Price breaking through a major resistance level on high volume.HighLook for entry opportunities on minor pullbacks.Scale into the position rather than going all-in at once.Positive social sentiment and increasing new wallet growth.ModerateMonitor the token on a watchlist; prepare for a move.Keep position sizes small or stay in cash.A decisive move in the meter toward 'High' or 'Bearish'.BearishAvoid new long positions; consider taking profits.Tighten stop-losses on existing positions to protect gains.Price action confirming a downtrend, like a lower high.
By adopting this framework, you elevate the DeFi Boost Meter from a simple indicator to the core of a disciplined, data-driven trading system.
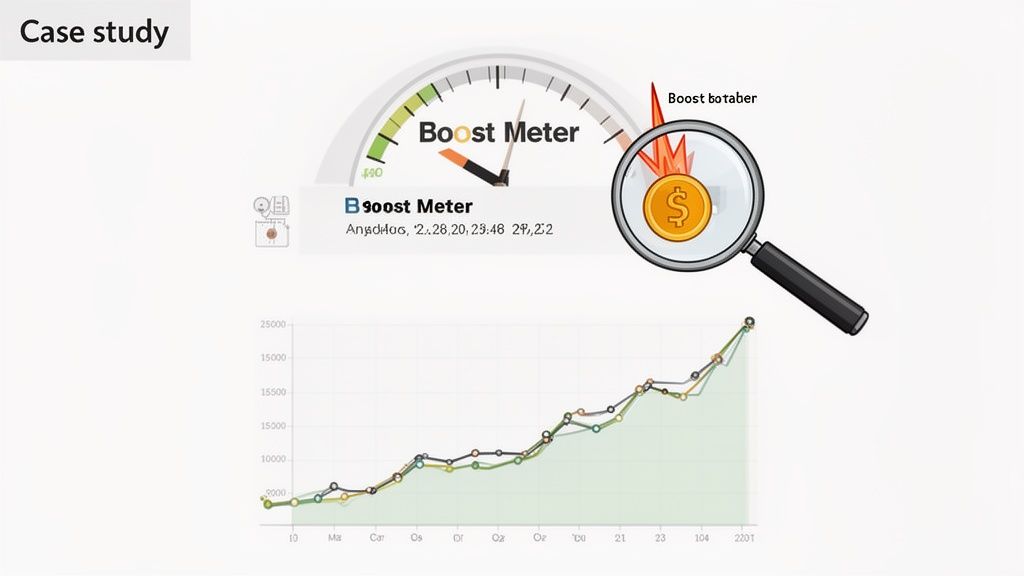
Theory is great, but nothing beats seeing the DeFi Boost Meter nail a real market move. Let's walk through a couple of case studies that show how the meter's signals gave traders a clear, early, and profitable edge.
For each scenario, we’ll look at the specific on-chain activity that caused the meter's reading to spike and the massive price action that came next. These aren't just backward-looking charts; they're proof of how on-chain data translates directly into a trading advantage.
Our first example features a small-cap token—let's call it $ALPHA—that had been trading sideways for weeks. While its price chart was flat, the story unfolding on-chain was anything but.
On October 12th, the DeFi Boost Meter for $ALPHA suddenly shot up from 'Moderate' to 'High'. This was a direct result of two powerful signals:
This combo of smart traders buying up a shrinking available supply was a textbook bullish setup.
The meter's alert was the canary in the coal mine. It signaled that conviction was building among informed traders, long before the broader market—and the price—reacted.
A trader who acted on this 'High' signal could have opened a position around $0.05. Just four days later, as the on-chain buying pressure finally spilled over into market demand, the price of $ALPHA took off. The token ripped to $0.18, delivering a potential gain of 260%.
Next, let's look at a token in the AI narrative, which we'll call $NEURA. Tokens driven by narratives are notoriously volatile, but on-chain data helps separate signal from noise. In early January, social media buzz around AI was picking up, but the $NEURA Boost Meter stayed put at 'Moderate'.
Then, on January 22nd, the meter spiked to 'Extreme Bullish'. This was the moment that mattered. The jump was triggered by a massive increase in whale accumulation and a sharp rise in new wallet growth. Big, established players were taking positions, and new retail interest was flooding in at the same time.
It was the perfect storm for a major rally, showing the narrative had graduated from just talk to serious capital deployment.
A trader who spotted the meter flip to 'Extreme Bullish' could have confidently entered a long position at $1.10. Over the next week, $NEURA soared to a peak of $3.52, handing over a potential profit of 220% based on the meter's timely signal.
These case studies drive home a critical lesson: price is often the last thing to move. The real opportunities show up when on-chain momentum diverges from the current market price. The DeFi Boost Meter is built to pinpoint these exact moments.
Let's break down the performance in a simple table.
TokenMeter Signal TriggerEntry Price (Hypothetical)Peak PricePotential PnL$ALPHASmart Money & Exchange Outflow$0.05$0.18+260%$NEURAWhale Accumulation & New Wallets$1.10$3.52+220%
In both situations, the meter didn't just confirm a trend that was already happening; it provided a leading signal of a trend that was about to kick off. By pulling together the right on-chain data, it gave traders the confidence to act before the crowd.
The Boost Meter's four signals are not equally predictive across all token types. A weighting system that works well for a mid-cap DeFi protocol produces materially different results when applied to a newly launched memecoin or a large-cap Layer 1 asset. Understanding which signals carry the most weight for each token category lets you interpret the same composite score differently depending on what you're analyzing.
This is not a theoretical concern. Misweighted signal interpretation is a specific failure mode where a trader sees a high composite score on a memecoin driven almost entirely by social velocity and treats it with the same confidence as a high score on an established protocol driven by whale accumulation and sustained exchange outflows. The underlying on-chain quality is completely different but the displayed score may be identical.
Large-cap assets (BTC, ETH, top 10 by market cap) are the category where exchange netflow carries the highest predictive weight. Whale and smart money movements on large-cap assets are frequent enough to generate constant signal, making them less distinctive as directional indicators. Exchange outflow sustained over 48 to 72 hours on large-cap assets has the most consistent historical relationship with subsequent price appreciation because it reflects genuine supply reduction at scale. Social velocity on large-caps is almost noise — it follows price rather than leading it, and high social mentions on Bitcoin typically reflect retail reacting to moves already in progress.
Established mid-cap DeFi protocols (top 50 to 200 by market cap) weight most reliably toward smart money inflow combined with exchange netflow. These assets have enough liquidity to absorb meaningful capital from sophisticated traders, but not enough visibility to attract the constant background noise of large-cap whale tracking. A smart money inflow event on a mid-cap protocol is statistically more distinctive than the same event on ETH, because mid-cap smart money entries are rarer and more deliberate. Social velocity on mid-cap DeFi protocols has moderate predictive value when it represents genuine community engagement around a product update or protocol milestone, and low value when it is narrative-driven.
Early-stage and micro-cap tokens (outside top 200, under $10M market cap) are the category where new wallet growth carries the highest predictive weight, and where exchange netflow is least reliable due to manipulation ease. For a token with $200,000 in daily volume, moving $50,000 between self-controlled wallets to create a fake outflow signal is trivially cheap. New wallet growth at this token stage is harder to fabricate at scale because creating hundreds of genuinely distinct wallet addresses with funding histories requires more operational overhead. When new wallet growth on a micro-cap is accelerating at 30 to 50 new wallets per day from diverse funding sources, that organic adoption signal has strong predictive value for the 5 to 21 day price window. Smart money inflow on micro-caps should be treated cautiously and verified against the common-funding-source check described earlier.
Narrative-driven memecoins weight most heavily toward the convergence of whale accumulation and social velocity, but with an important temporal constraint. On memecoins, the social velocity signal has an extremely short useful window of 2 to 6 hours before the attention cycle peaks. A high social velocity reading on a memecoin that is also showing whale accumulation is relevant only if the accumulation is current (within 12 hours) and the social velocity is still in its early acceleration phase rather than at its peak. A memecoin showing high composite scores where the whale accumulation occurred 3 days ago and the social velocity is at its peak today is a token where smart money has already positioned and is waiting to sell into the social wave — not a setup to enter long.
The practical calibration step before acting on any Boost Meter reading is to look at which of the four signals is driving the score and match that against the token's category. A score driven by the right signals for the token type you're analyzing is a genuine edge. A score driven by the wrong signals for that category deserves significant skepticism regardless of how high the number reads.
Knowing what the DeFi Boost Meter is telling you is one thing. Turning that on-chain intel into a repeatable trading strategy is another. This is where you connect the meter’s insights directly to the discovery and monitoring tools inside Wallet Finder.ai. It’s how you turn abstract data into tangible opportunities.
You can build an automated system that finds these opportunities for you and pushes them right to your screen the second they happen.
The heart of this strategy is Wallet Finder's 'Discover Wallets' feature. It's about creating a laser-focused filter designed to pinpoint traders who consistently nail tokens with a rising DeFi Boost Meter score.
Here’s a simple, actionable recipe for your "Boost Hunter" filter:
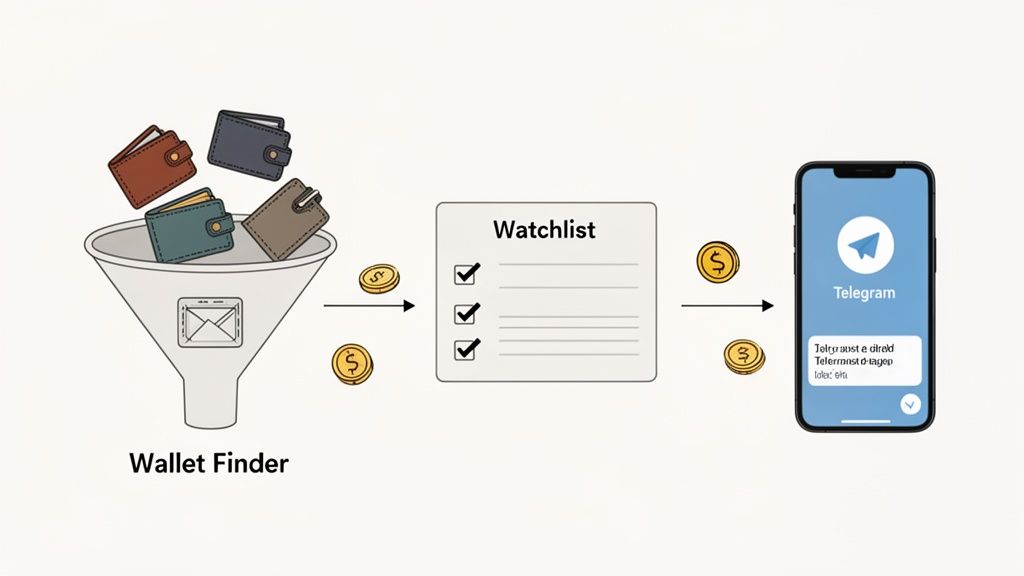
This simple setup creates a live feed of elite traders who are accumulating tokens the Boost Meter has flagged for serious momentum.
Finding the right wallets is only half the battle. Timing is everything. Once your filter has identified a solid list of 'Boost Hunter' wallets, the next step is to get instant alerts so you never miss a critical entry or exit.
Wallet Finder lets you pipe these notifications straight into Telegram whenever a tracked wallet makes a move.
By creating an alert for your 'Boost Hunter' watchlist, you're setting up a high-signal notification system. You'll get a ping the moment a top trader buys into a token with surging on-chain momentum, allowing you to research and potentially mirror the trade in minutes.
This automated alert system closes the loop between seeing a signal and taking action.
A filter is dynamic—it’s always finding new talent. A watchlist, on the other hand, is your curated group of all-stars. Once your 'Boost Hunter' filter surfaces standout wallets, add them to a dedicated watchlist. This gives you a much more focused view of the best of the best.
Monitoring this curated list pays off in a few ways:
This entire workflow—filter, alert, and watchlist—turns the DeFi Boost Meter from an analytical tool into an active, opportunity-generating machine.
No tool is a crystal ball, and that includes the DeFi Boost Meter. It’s a powerful data-driven edge, but treating its signals like infallible guarantees is a fast way to get rekt. To build a lasting strategy, you must understand its limits and learn to filter out the market's constant noise.
Think of the meter as a tool for stacking the odds in your favor, not for eliminating risk. It's probabilistic, not predictive. Even a screaming "Extreme Bullish" signal can fizzle out due to macro news or sudden regulatory changes—factors that on-chain data alone can't always see coming.
Sometimes, on-chain activity looks amazing but is designed to mislead you. Getting a feel for these tricks is the first step to dodging them.
The main culprits to watch for are:
The article correctly lists wash trading and coordinated hype as false positive sources. What it doesn't cover is the specific on-chain mechanics of how coordinated wallet activity inflates composite scoring systems, and the verification steps that distinguish manufactured scores from genuine ones.
Score manipulation targeting composite metrics like the Boost Meter follows a predictable architecture. A coordinated operator controls multiple wallet addresses. They use these wallets to create the appearance of independent accumulation — small buys from 15 to 20 addresses over a 12 to 24 hour period rather than one large buy from a single wallet. To an algorithm counting accumulation events across distinct addresses, this pattern reads as broad smart money interest. To a human examining the wallets individually, it reveals a common funding source and suspiciously synchronized transaction timing.
Exchange netflow manipulation is simpler. Moving tokens from a wallet the operator controls on an exchange to a cold wallet they also control creates the appearance of exchange outflow and "accumulation." The token supply has not changed hands. No new buyer has committed capital. But the netflow metric records a positive signal. This exact mechanic is trivially cheap to execute on low-fee networks like Solana and Base, where a fabricated outflow event costs under $0.01 in transaction fees and can move a meaningful percentage of a low-liquidity token's circulating supply between wallets the same party controls.
Social velocity inflation through coordinated bot activity and paid influencer networks creates the fourth signal without any genuine community momentum. A Telegram group with 5,000 members can be activated to post about a token simultaneously, creating a spike in mentions that looks statistically identical to organic viral interest for the 30 to 60 minutes before the artificial nature becomes apparent through engagement quality analysis.
Three verification checks, each taking under two minutes, catch the majority of manufactured high scores before you commit capital.
Common funding source check. Take the top 5 to 10 wallet addresses contributing to the accumulation signal and trace each one back two or three hops on a block explorer. If multiple wallets received their initial funding from the same source address, or if they all funded from a major exchange within a 24 to 48 hour window, they are more likely controlled by the same operator than a group of independent smart money traders making the same discovery simultaneously. Independent smart money wallets have diverse funding histories with no shared origin.
Transaction timing distribution. Genuine independent accumulation from multiple informed traders produces transactions with irregular timing — some buy at 3 AM, some at midday, some during news events. Coordinated wallets executing a scripted accumulation show clustering within narrow time windows. If 12 of the 15 accumulation transactions feeding the signal occurred within a 90-minute window, that regularity is a coordination signature. Check transaction timestamps on the block explorer against the wallets driving the signal.
Liquidity pool depth relative to signal size. A token with $80,000 in liquidity pool depth showing "massive whale accumulation" worth $50,000 implies that roughly 60% of the available liquidity has been absorbed by the accumulation event. Real whales do not accumulate in pools they could drain in one more transaction — the price impact would work against them. When the signal size is proportionally large relative to LP depth, the accumulation is almost certainly either a small absolute number being described in percentage terms, or a coordinated buy on a deliberately thin pool designed to create maximum score impact per dollar spent.
The single most effective way to sidestep these traps is to never rely on the DeFi Boost Meter in isolation. It should be a confirmation tool that backs up your own research, not a replacement for it.
The meter’s real power shines when you use it to validate a thesis you've already built. It’s there to answer the question: "Does the on-chain data actually support what I'm seeing on the chart?"
To increase your win rate, combine the meter's readings with other critical signals. See a high Boost score? Great. Now, cross-reference it with technical chart patterns, take a hard look at the project's tokenomics, and dig into the team and their roadmap.
For a deeper dive on this, our checklist for meme token signal accuracy gives you a great framework. This layered approach is your best defense.
You've got questions, we've got answers. Let's run through some of the most common things traders ask about the DeFi Boost Meter so you can get the most out of it.
It’s practically instant. The Boost Meter is constantly plugged into the blockchain, crunching on-chain data as new transactions are confirmed. This means you’re always looking at the freshest possible picture of market sentiment.
No, and it's not designed to. Think of the Boost Meter as a microscope for individual tokens, not a telescope for the entire market. Its real power is in spotting momentum shifts for specific assets.
That said, if you suddenly see 'Bearish' readings flashing across dozens of major tokens, it's a strong signal that sentiment is souring market-wide. But for broad crash predictions, you'll want to use it alongside other macro indicators.
It works best where the action is. The meter thrives on tokens with healthy on-chain activity and decent liquidity. Why? Because more transactions from whales and smart money give its algorithm a richer dataset to analyze.
For brand-new tokens with few transactions or obscure coins, the signals can be less reliable. Stick to assets with an established trading history for the sharpest readings.
Significantly. Each signal in the Boost Meter has a different predictive window — the period during which it has forward-looking value rather than describing history already priced in. Smart money inflow decays fastest, with the most actionable window lasting 6 to 12 hours after detection. Acting on a smart money signal 24 hours after the transactions occurred risks entering a position that has already reflected those purchases in price. Whale accumulation has the longest window, typically 24 to 96 hours, because large-position building extends over longer periods. Exchange netflow is most reliable when it represents a sustained 48 to 72 hour trend rather than a single large outflow event. Social velocity decays within 2 to 6 hours. When reviewing the data behind a high Boost Meter score, check the timestamps of the transactions driving each component signal. A score built from fresh, recent activity across multiple signal types represents genuinely concurrent accumulation. A score driven by events from 2 to 3 days ago mostly reflects history rather than imminent opportunity.
Three counter-verification checks catch the majority of manufactured scores. First, trace the funding sources of the top wallets driving the accumulation signal back two or three hops on a block explorer. Independent smart money wallets have diverse, unrelated funding histories. Coordinated wallets share common funding sources or received their initial capital from the same exchange withdrawal within a narrow time window. Second, check transaction timing distribution: genuine independent accumulation produces irregular timestamps across different times of day. Coordinated scripts produce clusters of transactions within tight 60 to 90 minute windows. Third, compare the signal size against the liquidity pool depth. Real whales do not accumulate in pools they could drain in one or two more transactions — accumulation events that represent 30% or more of available LP depth are more likely coordination on a deliberately thin pool than genuine smart money conviction.
The same composite score has very different quality depending on which signals are driving it and what type of token you are analyzing. For large-cap assets, weight exchange netflow most heavily and treat social velocity as near-noise. For established mid-cap DeFi protocols, smart money inflow combined with sustained exchange outflow is the most reliable signal pair. For micro-cap and early-stage tokens, new wallet growth from diverse funding sources is the most manipulation-resistant signal and deserves the highest weight. For narrative memecoins, whale accumulation and social velocity are the relevant signals but only when both are current within 12 hours of each other — a 3-day-old whale position with today's social velocity peak usually means smart money is positioned to sell into the attention wave, not to hold through it. A high composite score driven by the wrong signals for a token's category deserves the same skepticism as a moderate score. Matching signal quality to token type is the calibration step most traders skip.
Ready to turn on-chain data into your trading edge? Discover the wallets and tokens smart money is backing right now with Wallet Finder.ai. Start your 7-day free trial and see the market differently.

A premier DeFi analytics platform empowering traders to discover and analyze profitable blockchain wallets, trades and tokens.

