
Recovery Factor Calculation for Smart Traders
Master the recovery factor calculation to measure a strategy's resilience. Learn the formula, see DeFi examples, and find top wallets with Wallet Finder.ai.

June 20, 2026


Wallet Finder
December 30, 2025
The funding rate is a core mechanism in crypto derivatives, specifically for perpetual futures contracts. At its heart, it's a system of regular payments exchanged between traders who are long (buyers) and those who are short (sellers).
This whole process has one critical job: to make sure the price of a perpetual contract stays anchored to the actual spot price of the underlying crypto. Think of it as the invisible string that keeps a high-flying derivatives balloon from floating away into its own reality.
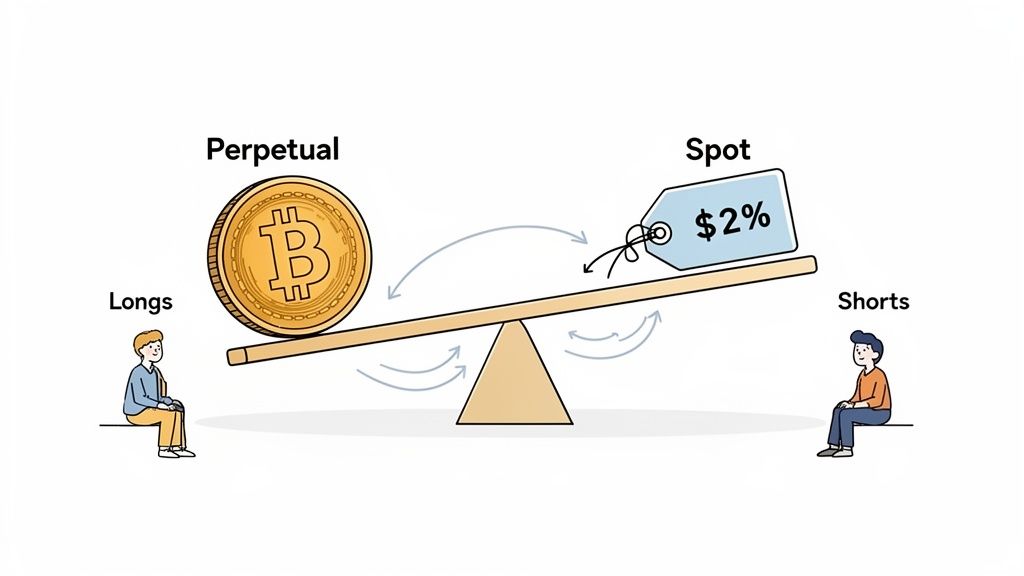
Imagine a simple seesaw. On one side, you have the price of a BTC perpetual futures contract. On the other, you have the live spot price of Bitcoin. The funding rate is what keeps this seesaw from tipping too far in either direction.
Perpetual contracts are unique because, unlike traditional futures, they don't have an expiration date. Without some kind of balancing force, the contract's price could easily drift miles away from the spot price, creating chaos. The funding rate solves this by making one side of the trade pay the other.
These payments, which usually happen every eight hours, create a financial incentive for traders to bring the contract price back in line with the spot price. This is what makes the crypto derivatives market stable and predictable enough to trade on.
Figuring out who pays is simple—it all comes down to market sentiment and which price is higher. The direction of the payment is determined by the funding rate's sign:
The core purpose of the funding rate is to create a financial incentive that maintains equilibrium between the derivatives market and the spot market, reflecting the constant push and pull of supply and demand.
Beyond just keeping prices aligned, the funding rate is an incredibly potent gauge of market sentiment. It gives you a direct, quantifiable window into whether bulls or bears are in control.
A consistently high positive funding rate often points to excessive optimism and too much leverage on the long side. On the flip side, a deeply negative rate reveals widespread fear and a heavy pile-up of short positions.
Experienced traders watch these signals like a hawk. Why? Because extreme funding rates can often signal that a market is overextended and due for a sharp correction or reversal. It's an essential tool for understanding market psychology and avoiding crowded, dangerous trades.
Here’s a quick table to break down what funding rates tell you about the market at any given moment.
This simple breakdown makes it easy to interpret funding rates as a live indicator of whether traders are feeling greedy or fearful.
To really get what a funding rate crypto signal is telling you, we need to pop the hood and see how it’s made. While the exact math can differ a bit from one exchange to another, the recipe always comes down to two main ingredients: the Interest Rate Component and the Premium Component.
Think of it like mixing a drink. The final funding rate is a blend of these two parts, carefully balanced to keep the market from getting out of whack. Let’s break down each one without getting bogged down in formulas.
The first piece of the puzzle is the Interest Rate. This part is pretty straightforward and is based on the interest rates of the two currencies in the trading pair—the base currency and the quote currency.
For a classic pair like BTC/USDT, this component is all about the difference in the cost to borrow Bitcoin versus the cost to borrow Tether. Exchanges usually just set a fixed daily interest rate for this to keep things simple.
For example, an exchange might set the daily interest rate at a flat 0.03%. This gives the funding rate a consistent, predictable foundation.
This part of the calculation makes sure there’s a baseline cost for the capital being used, just like interest in traditional finance. But it’s the second ingredient that really brings the market's personality into the mix.
The second, and usually more powerful, ingredient is the Premium. This is what turns the funding rate into a killer sentiment indicator. It simply measures the gap between the perpetual futures contract price and the asset’s real-time spot price.
When a wave of buying pressure pushes the perpetual price above the spot price, you get a positive premium. On the flip side, if heavy selling drives the perpetual price below the spot price, you get a negative premium (also called a discount).
The size of that gap is a direct reflection of the short-term tug-of-war between supply and demand in the derivatives world. A big premium screams that leveraged bulls are aggressively bidding up the price, while a big discount shows the bears are in control.
Okay, let's mix our two ingredients and see how the final funding rate comes out. Exchanges are constantly calculating a premium index (often every minute) and then averaging it out over the funding period, which is typically 8 hours.
Here’s a simplified rundown for a BTC/USDT pair:
The formula is as simple as: Funding Rate = Interest Rate + Premium
In our example: 0.01% (Interest) + 0.04% (Premium) = +0.05% (Final Funding Rate)
This +0.05% is a positive funding rate. That means traders holding long positions are going to pay a 0.05% fee on their position size to the traders holding short positions. This little payment is what nudges the perpetual price back down toward the spot price, keeping the whole system in balance.
Funding rates aren't just a simple fee mechanism; they’re a live, unfiltered window into the market's collective mind. By watching which way the rate goes and how extreme it gets, you can get a surprisingly accurate read on the balance between greed and fear among traders.
When funding rates are consistently high and positive, it’s a flashing sign that the market is overwhelmingly bullish. This means a ton of traders are piling into leveraged long positions, betting on prices to keep climbing. While this can fuel a rally for a bit, it often signals a market saturated with "dumb money" and extreme greed—a precarious, over-leveraged house of cards.
This setup is the perfect recipe for a long squeeze. The moment prices stall or dip, those highly leveraged longs can be forced to liquidate. That forced selling creates a domino effect, pushing prices down sharply and suddenly.
The trick is to see extreme funding rates as a contrarian indicator, not a trend to blindly follow. They tell you when one side of the boat is getting dangerously overcrowded, making a reversal much more likely.
This infographic breaks down the simple math behind this powerful sentiment gauge.
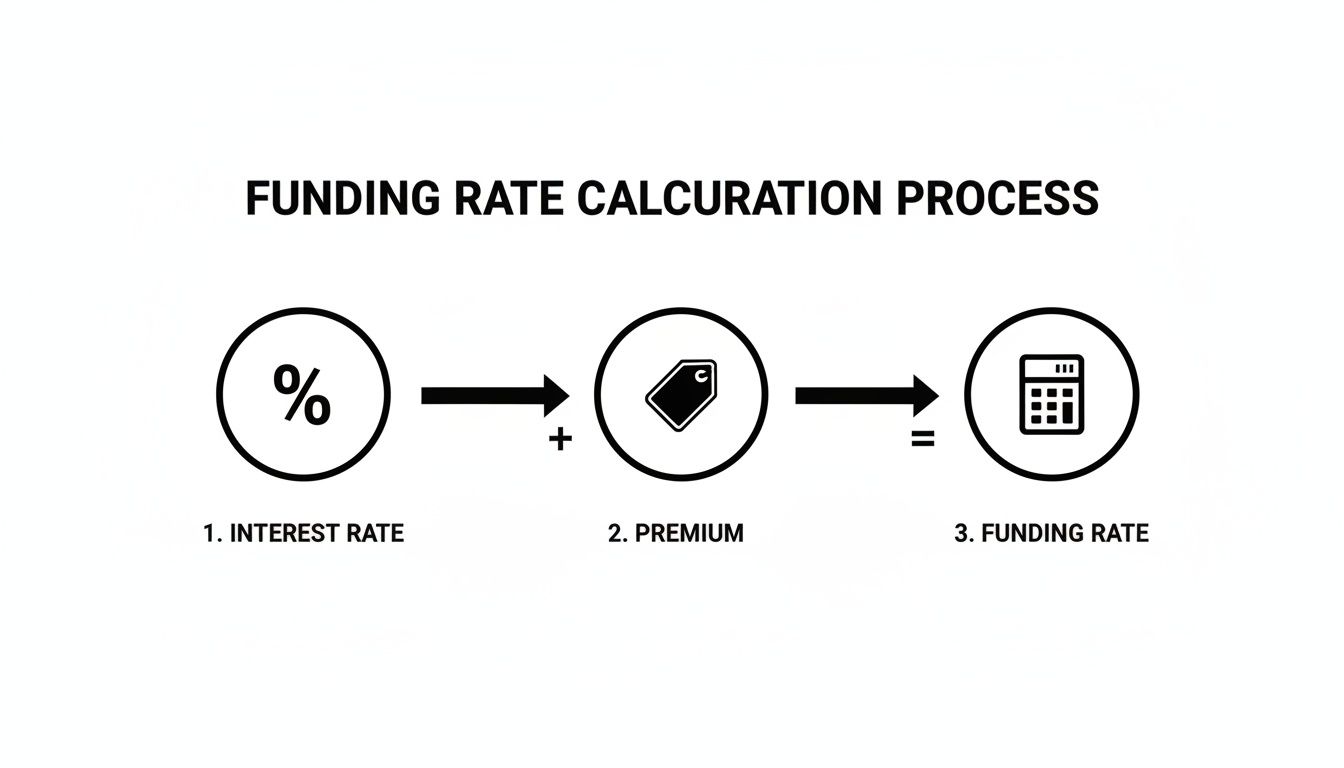
This calculation shows how the base interest rate and the market-driven premium combine to create the final funding rate, which is a direct reflection of how traders are positioned.
On the flip side, deeply negative funding rates paint a picture of widespread fear. It means the majority of traders are shorting the market, expecting prices to crash. While that bearishness might be justified in the short term, it can also signal that the market has hit a point of maximum pessimism, meaning a bottom could be just around the corner.
This is when the market becomes ripe for a short squeeze. All it takes is a small bit of good news or a slight price bounce to force short-sellers to buy back their positions to cut their losses. This sudden wave of buying pressure can trigger a rapid and violent rally as other shorts get liquidated in a chain reaction.
A quick look at the charts proves this isn't just theory. If you pull up funding rate data alongside price charts for assets like Bitcoin, you can see clear moments where extreme funding rates came right before major market turns. Big spikes in positive rates have often marked market tops, just before a nasty correction.
Likewise, deep troughs in negative rates have frequently marked local bottoms, right before a strong relief rally kicked off. These patterns show how funding rates can be an invaluable tool for spotting high-probability reversal points.
Take a look at this Coinglass screenshot. It shows the real-time funding rates across major exchanges for a variety of crypto assets.
You can see how the colors immediately tell the story: hot reds for high positive rates (greed) and cool greens for negative rates (fear).
The connection between funding rates and sentiment has become a critical piece of the puzzle for pro traders. Research shows that while rates don't directly predict future prices, they highlight a dangerous market imbalance. When rates stay pinned at an extreme for too long, it’s a clear signal that one side is way too leveraged, cranking up the odds of a major volatility spike.
Pairing this analysis with other tools gives you a much clearer view of the market. For a deeper dive, check out our guide on using a crypto sentiment checker.
Knowing the theory behind the funding rate crypto market is one thing, but actually using that knowledge to make profitable trades is a whole different ball game. This is where we connect the dots.
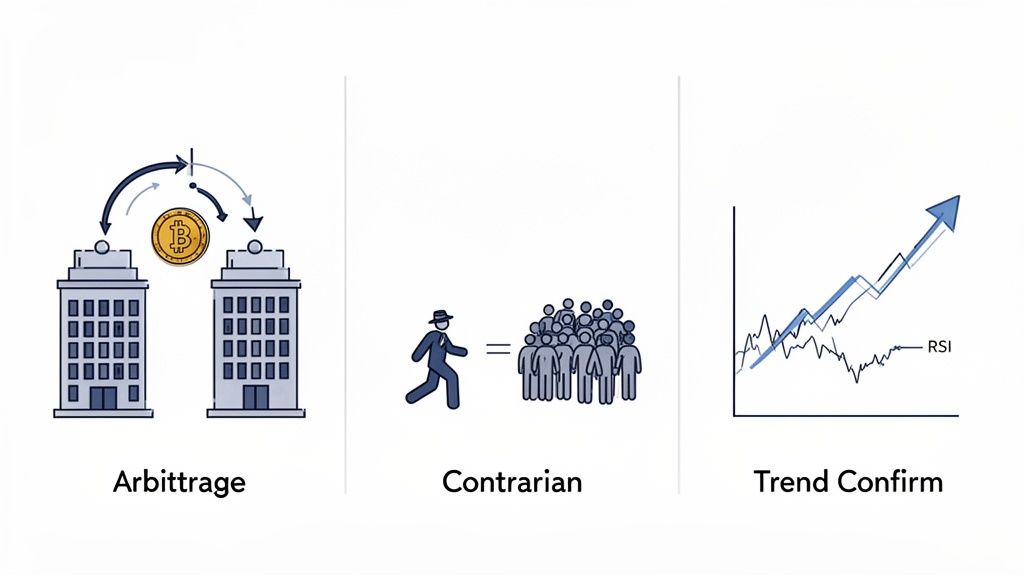
We’re going to walk through three powerful strategies that use funding rates as a core signal for making smarter trades. Think of these as practical frameworks you can adapt to your own trading style. By adding funding rate analysis to your toolkit, you can get ahead of the market instead of just reacting to price charts.
Often called a "cash-and-carry" trade, this is a favorite among traders looking for lower-risk, consistent returns by capitalizing on market inefficiencies. The objective is simple: collect the funding payments while staying market-neutral, so you aren't exposed to the asset's wild price swings.
The whole idea revolves around finding a perpetual contract where the funding rate is highly positive. This means longs are paying a nice premium to shorts every funding period. Your goal is to be on the receiving end of those payments.
Here’s an actionable checklist to execute this trade:
Crucial Risk Note: This strategy isn't completely risk-free. A sudden, massive price spike could liquidate your short position if your margin is too thin. The funding rate could also flip negative, which would turn your income stream into an expense. Always use stop-losses and keep a close eye on the rates.
This approach is all about using extreme funding rates as a signal to bet against the herd. The logic is simple: when everyone piles onto the same side of a trade, the market gets dangerously over-leveraged and becomes ripe for a sharp reversal.
If funding rates are sky-high (think +0.1% or more for a while), it’s a sign of extreme greed and an overcrowded long trade. That’s a classic setup for a "long squeeze." On the flip side, if rates are deep in the red (like below -0.1%), it signals mass fear and sets the stage for a potential "short squeeze."
Here’s a playbook for this strategy:
This strategy requires patience and tight risk management because you're fading the current sentiment. It's always best to use it alongside other technical indicators to confirm your timing is right.
Funding rates are also a fantastic tool for gauging the health and sustainability of an ongoing trend. Instead of just looking at the price, the funding rate crypto signal gives you a peek under the hood to see the conviction behind the move. A healthy trend is driven by real momentum, not just speculative froth.
Here’s a quick guide to reading the signals:
By combining funding rate data with an indicator like the Relative Strength Index (RSI), you can build a much more robust trading plan. A rising price with a neutral funding rate is a far stronger buy signal than a rising price with a dangerously high one. For traders who are just starting out, learning to layer these concepts is a great way to level up your decision-making. You can dive deeper into other foundational techniques in our guide to crypto trading strategies for beginners.
If you've ever glanced at a funding rate crypto dashboard, you might have noticed something strange. The Bitcoin funding rate on Binance might be +0.01%, but over on Bybit, it's ticking at +0.015%. On another exchange, it could be something else entirely.
This isn't a glitch in the matrix—it’s a core feature of how these markets work.
Think of each exchange as its own separate marketplace, complete with its own unique crowd of traders. The collective sentiment, leverage levels, and trading activity within that specific crowd directly shape its funding rate. This is what causes those little differences you see across the board.
For any serious trader, getting a handle on these variations is huge. It gives you a much richer picture of market sentiment and even opens the door to advanced strategies like cross-exchange arbitrage.
So, what exactly is under the hood causing these rates to diverge? It really just boils down to a few key ingredients that give each exchange its unique flavor.
Funding rates are the glue that keeps perpetual futures prices tied to spot prices, but they’re far from uniform. As the team at CoinMarketCap points out, these differences are normal because every platform has its own formula and data feeds. During big market moves, this can cause rates to spike, making it incredibly expensive to hold a leveraged position. You can see this for yourself by checking out their real-time funding rate comparisons.
The screenshot below from their dashboard is a perfect example, showing how rates for the same asset can be all over the place at the exact same time.
This snapshot captures a mix of positive and slightly negative rates across different platforms, perfectly illustrating the fragmented nature of market sentiment and liquidity.
To make this crystal clear, let's walk through a hypothetical scenario. Imagine Bitcoin is in the middle of an intense bull run. Here’s how the funding rates might stack up across a few exchanges.
This table shows hypothetical funding rate data for Bitcoin across major exchanges at the same point in time to illustrate market variance.
As you can see, the difference is huge. A trader holding a $100,000 long position on Exchange A would be paying $65 every eight hours. Meanwhile, the same trader on Exchange C would only pay $25.
This isn't just a fun fact; it's actionable intel.
For an arbitrage trader, that gap between Exchange A and Exchange C is a potential profit opportunity waiting to be seized. For a sentiment analyst, it’s a bright, flashing sign showing exactly where the most speculative "hot money" is concentrated.
To really wrap your head around funding rate crypto mechanics, let's tackle a few of the most common questions traders have. Getting these down will help you build confidence and start using this data like a pro.
On most of the big exchanges like Binance and Bybit, funding payments are made every eight hours. But don't set your watch by it.
When the market goes wild, exchanges can dial up the frequency to every four hours, or even every single hour. They do this to force the perpetual contract price back in line with the spot price. Always double-check the funding schedule on your exchange—it directly affects your P&L.
You bet they can. During a brutal bear market or right after a massive crash, it's not unusual to see funding rates stay negative for weeks or even months at a time. This is a classic sign that sellers are in complete control.
When this happens, it means the overwhelming majority of traders are short, and they're willing to pay a premium to the few remaining longs just to hold onto their positions. It’s a crystal-clear signal of widespread fear in the market.
No strategy is ever a sure thing, and funding rate arbitrage is no different. While it's generally seen as a lower-risk play, there are definitely traps you can fall into.
A sudden, violent price spike could easily get your short position liquidated if your margin is too thin. The rate could also flip negative without warning, or a flash crash could wipe out more value from your spot holdings than you're earning in funding payments.
Honestly, a "good" rate is all about what you're trying to achieve. There’s no magic number that works for everyone.
It’s better to think about it in terms of your strategy:
Ready to turn on-chain data into actionable trading signals? Wallet Finder.ai helps you discover the strategies of top-performing crypto wallets in real time. Start tracking smart money and mirroring winning trades today. Explore the platform at https://www.walletfinder.ai.

A premier DeFi analytics platform empowering traders to discover and analyze profitable blockchain wallets, trades and tokens.

