
Recovery Factor Calculation for Smart Traders
Master the recovery factor calculation to measure a strategy's resilience. Learn the formula, see DeFi examples, and find top wallets with Wallet Finder.ai.

June 20, 2026


Wallet Finder
November 26, 2025
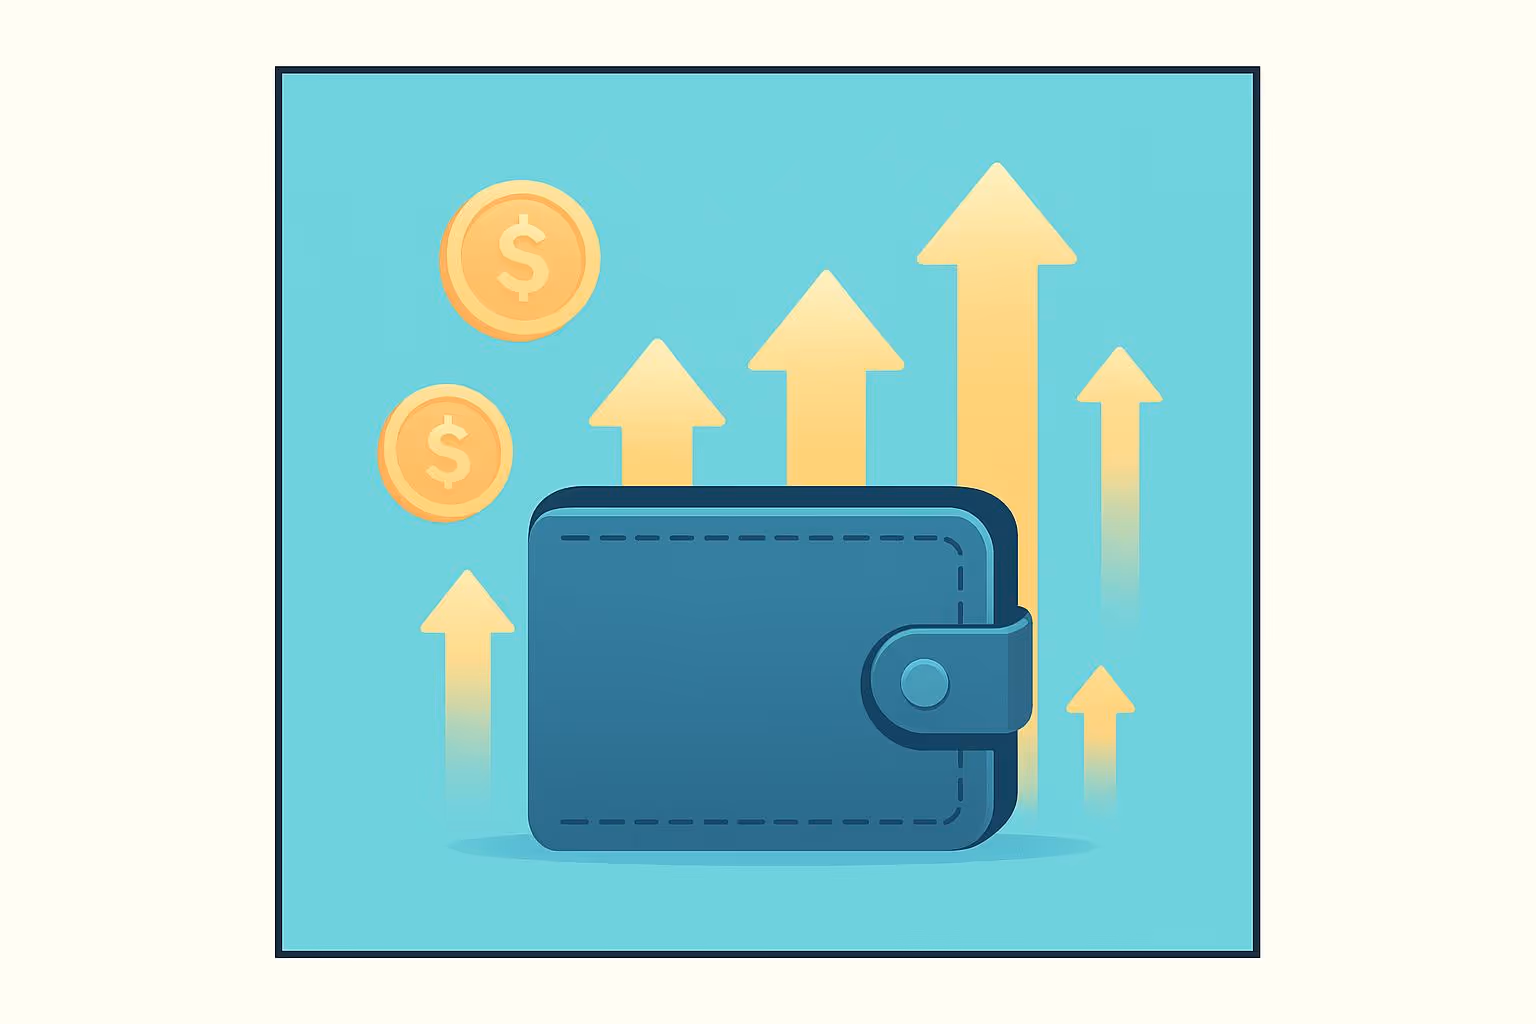
Wallet profitability is all about tracking how much you've gained or lost in crypto over time. It’s key for making smarter decisions in a market that’s always changing. By looking at past trends, you can spot patterns, manage risks, and plan better.
Here’s what you need to know:
Tools like Wallet Finder.ai make it simple to track these metrics. They provide real-time alerts, performance graphs, and ways to watch profitable wallets. By using these insights, you can refine when to buy or sell, and even manage risks better.
For example, during bull markets, most wallets show profits, which may signal it's time to sell. In bear markets, fewer wallets are profitable, which could mean buying opportunities. Watching trends like wallet activity, whale movements, and miner behavior can also give clues about market shifts.
Key takeaway: Understanding wallet profitability isn’t just about numbers - it’s about using those numbers to make better trading moves. Tools and data can help you stay ahead in the unpredictable crypto market.
Tracking specific metrics can give you a clear picture of wallet performance and help uncover market trends. These numbers lay the groundwork for more advanced analytics we'll explore later.
Realized gains and losses show the actual profits or losses you've locked in through completed trades. For instance, if you sell Bitcoin for $50,000 after buying it at $40,000, you've secured a $10,000 gain.
Meanwhile, unrealized gains and losses reflect the potential profits or losses on assets you're still holding. If that same Bitcoin climbs to $60,000 and you haven't sold it, you'd have an unrealized gain of $20,000, representing your exposure to the current market.
Together, these metrics give a complete performance picture. Realized gains highlight what you've earned or lost, while unrealized gains show what’s still at stake if market conditions change.
In addition to gains and losses, break-even points and profitability ratios provide deeper insights into wallet performance.
The break-even point is the price at which the value of your wallet equals your original investment - no profit, no loss. This is a critical point for managing risk.
Looking at break-even points across many wallets can reveal market trends. For example, if most wallets have break-even points near the same price, that price could act as a key support or resistance level.
Profitability ratios offer another layer of analysis. One popular example is the Market Value to Realized Value (MVRV) ratio, which divides the current market value by the realized value of all coins in circulation. An MVRV of 2.0 means a wallet's value has doubled, while a negative MVRV suggests losses and potential undervaluation.
These ratios help identify whether an asset is priced too high or too low, giving clues about when to sell or when the market might see widespread capitulation.
Wallet profitability distribution tracks the percentage of wallets currently in profit, at a loss, or breaking even, based on current prices. This metric provides a big-picture view of market sentiment that individual wallet analysis might miss.
For example, when a large percentage of wallets are profitable, it might indicate that profit-taking is on the horizon. On the flip side, when very few wallets are profitable, it could signal a market bottom and a potential buying opportunity.
These metrics, when combined, offer a comprehensive look at market sentiment and wallet performance.
Metric
What It Measures
Why It Matters
Realized Gains/Losses
Profits/losses from completed trades
Tracks actual performance
Unrealized Gains/Losses
Potential profits/losses if sold now
Reflects current market exposure
Break-Even Point
Price where profit/loss is zero
Helps manage risk
Profitability Ratio (MVRV)
Market value vs. realized value
Indicates overpricing or underpricing
Wallet Profitability Distribution
% of wallets in profit, loss, or break-even
Shows overall market sentiment
Modern analytics tools make it easier to visualize these metrics. Dashboards often include features like a signal line, which smooths out wallet profitability data to highlight trends and filter market noise.
Significant shifts in profitability distribution often come before major price changes, providing an early warning of market momentum.
To understand wallet profitability trends, having the right tools is essential. These tools help collect, analyze, and display blockchain data in a way that's easy to interpret. Today’s analytics platforms make it simpler for traders to access on-chain insights, offering intuitive dashboards and real-time monitoring.
On-chain analytics play a key role in tracking wallet profitability. They dive into blockchain data - like transactions and wallet balances - to give a live view of market activity. These tools pull data from public blockchains such as Ethereum, Solana, and Bitcoin, which act as open digital records anyone can audit.
The best on-chain analytics platforms focus on important metrics like active addresses, transaction volumes, supply distribution, and total value locked (TVL). By keeping an eye on exchange flows, these tools can reveal whether assets are being sold off or accumulated. They also analyze how assets are distributed among retail investors, whales, and institutions, helping traders figure out who’s influencing price shifts. For traders looking to explore opportunities across multiple networks, our Cross-Chain Wallet Discovery for Meme Token Traders guide shows how to track wallets seamlessly across chains.basics and add user-friendly features to make analytics more accessible.

Wallet Finder.ai is designed to simplify tracking wallet profitability, especially in the DeFi space. Some of its standout features include the ability to discover top-performing wallets and view detailed profit and loss stats. Users can also track historical performance using visual graphs and charts, making it easier to see trends over time.
The platform offers advanced filtering options, allowing users to narrow their analysis based on timeframes, asset types, or performance levels. This helps traders zero in on the data that matters most. Additionally, Wallet Finder.ai supports exporting data, so users can analyze it offline or integrate it with other tools. Real-time alerts notify users of key wallet activities through Telegram.
For more personalized tracking, users can link their own wallets to monitor performance and compare it to market trends. Custom watchlists make it easy to follow high-performing wallets, helping traders refine their strategies for entering and exiting positions.
These features not only streamline wallet tracking but also make it easier to interpret historical trends and take smarter actions.
Platforms like Wallet Finder.ai go beyond basic tracking by offering advanced dashboards with deeper insights. Signal lines, for example, cut through market noise to highlight profit and loss levels more clearly. Profitability meters provide quick snapshots of market sentiment, showing how many wallets are in profit versus at a loss. Dashboards also consolidate multiple data streams into one view, giving traders real-time updates on spending patterns and financial positions. Users can customize these dashboards to focus on the metrics and trading pairs that matter most.
Other features include trend strength monitoring, which helps traders catch potential market reversals early. Security is also a priority, with encryption and multi-factor authentication protecting user data and connected wallets. Plus, customer support is available through various channels to assist users in navigating complex markets.
The global digital wallet market is growing fast, with an estimated value of $8.8 trillion by 2025 and a 22% annual growth rate. Over 70% of consumers now use digital wallets for payments, generating a massive amount of data for these platforms to analyze. This data provides traders with insights into profitability trends and opportunities.
Looking at historical wallet profitability trends can provide valuable insights into market behavior. By analyzing these patterns, traders can spot early signs of shifting sentiment and adjust their strategies accordingly.
Wallet profitability trends can vary greatly depending on market conditions. During bull markets, rising prices and investor confidence often lead to a higher number of wallets showing profits. On the other hand, bear markets typically see a drop in wallet profitability as uncertainty and caution take over.
These differences help traders refine their strategies. By comparing profitability patterns in different market phases, they can better understand how sentiment shifts over time.
Interpreting trends requires more than just looking at raw numbers. Tools like 7- or 30-day moving averages can smooth out short-term fluctuations, making it easier to identify key shifts in market momentum. For instance, when the percentage of profitable wallets crosses above or below these averages, it often signals a change in direction.
Other important metrics include trading volume and active wallet addresses, which can hint at upcoming market moves. Monitoring token flows is also essential. If profitable wallets start transferring large amounts of assets to exchanges, it could indicate growing selling pressure. As Team CoinSwitch explains:
"Trend analysis predicts the stock price movement through recently observed market trend data. This type of analysis uses historical data for prediction."
Hash rate trends can also provide clues about market sentiment. A stable or rising hash rate often points to bullish conditions, while a declining rate might signal bearish trends. Tools like Wallet Finder.ai make it easier to visualize these patterns, helping traders make more informed decisions.
Combining trend analysis with stress indicators can offer a deeper understanding of market conditions. For example, a significant drop in the percentage of profitable wallets might signal increased market stress, potentially leading to panic selling or forced liquidations. Similarly, sudden activity from dormant wallets - those inactive for months - can indicate a shift in sentiment and may precede notable price movements.
Whale activity is another critical factor. Large transfers by whales can often signal major price changes. For example, heavy inflows to exchanges usually indicate selling pressure, while significant outflows suggest accumulation by long-term holders. As of June 17, 2025, just four addresses held over 100,000 BTC combined - worth approximately $66 billion - highlighting the influence of concentrated whale activity on the market.
Miner behavior also plays a role. When miners sell more crypto than usual, it can be a bearish signal, often reflecting operational pressures or concerns about the network's health. A combination of indicators - like increased whale transfers to exchanges, higher miner selling, and reactivated dormant wallets - can point to significant price shifts. Conversely, trends like rising exchange outflows paired with whale accumulation may signal opportunities for growth.
Recent events illustrate these patterns. In January 2025, U.S. Bitcoin ETFs saw near-record inflows of about $4.5 billion, aligning with improved wallet profitability metrics. Similarly, MicroStrategy's first-quarter purchase of roughly 11,000 BTC (around $1.1 billion) highlighted institutional interest during a time when retail wallet profitability was starting to recover.
Profitability insights, drawn from historical data, can be turned into practical trading strategies. Wallet profitability data becomes especially useful when traders know how to apply it to their decisions. These insights can help refine entry and exit points, improve risk management, and encourage disciplined trading.
Wallet profitability data, when paired with Multiple Time Frame Analysis (MTFA), helps traders fine-tune their entry and exit points. MTFA involves studying price trends across different time frames to make smarter decisions. Start by analyzing higher time frames to identify the overall market trend. If wallet profitability is stronger on higher time frames than on lower ones, it could signal a potential trend reversal. Use medium time frames to spot support and resistance levels, and lower time frames to pinpoint precise entry and exit opportunities.
Aligning trends across time frames is crucial. For instance, if wallet profitability percentages are climbing steadily across multiple time frames, it strengthens a bullish signal. On the flip side, if short-term wallet profitability drops while long-term trends remain positive, it might be better to hold off until the trends align more closely.
Volume analysis can also confirm shifts in trends. For example, if wallets start transferring larger amounts to exchanges during a rally, it might indicate growing selling pressure. Additionally, keeping an eye on major market events can help you anticipate disruptions in profitability trends.
Once you’ve identified the best entry and exit points, focus on risk management to ensure long-term success.
Smart risk management protects your capital by minimizing losses and avoiding unnecessary risks. Wallet profitability data acts as an early warning system, helping you make informed decisions. Understanding the balance between risk and reward is key, and wallet trends provide valuable insights into this relationship.
For example, a sudden drop in the percentage of profitable wallets could signal the need to reduce your position size. Using the 1% or 2% rule - risking only 1% or 2% of your portfolio on any single trade - can help you weather volatile market conditions.
Wallet data can also help you stay disciplined, reducing the urge to chase trends or make impulsive decisions. If profitable wallet percentages approach levels historically linked to market corrections, such as 75%, it may be a good time to secure your gains rather than increasing exposure. Use wallet profitability data to set realistic trading goals and guide your take-profit levels. Instead of putting all your funds into one trade, spread your investments across several positions to lower your overall risk.
During market downturns, consider holding a portion of your portfolio in stablecoins. If wallet profitability percentages drop below historical support levels, having liquid capital ready can allow you to seize new opportunities when they arise.
To act on wallet insights quickly, leverage real-time alerts and watchlists. These tools ensure you don’t miss important changes in wallet profitability trends. For instance, Wallet Finder.ai offers an alert system that sends notifications via Telegram whenever significant shifts in wallet activity occur.
Custom watchlists let you track specific wallets that have shown consistent profitability. Meanwhile, threshold-based alerts notify you when profitable wallet percentages rise or fall significantly, helping you spot potential buying or selling opportunities. Focus on wallets with strong win streaks and consistent performance, as these can provide early signals of market shifts.
You can also set volume-based alerts to track major wallet movements. For example, configure alerts to notify you when wallets on your watchlist execute trades above a certain dollar amount. This allows you to adjust your positions before large trades impact the market.
Wallet Finder.ai’s advanced filters let you create sector-specific watchlists. For example, DeFi wallets might behave differently from NFT-focused wallets during market stress, so separate alerts can help you notice sector rotation trends.
The platform’s data export features make it easy to analyze historical alert patterns. By reviewing which alerts led to successful trades, you can fine-tune your criteria over time, improving the effectiveness of your alert system.
The trick to setting up a good alert system is finding the right balance - providing timely, actionable information without overwhelming yourself. Start with broad thresholds and adjust them as you learn which signals work best for your trading style. This way, you’ll stay informed without falling victim to alert fatigue.
Understanding historical wallet profitability trends is a powerful tool in today’s fast-moving crypto market. With the global cryptocurrency market projected to surpass $3 trillion by 2025, traders who excel in wallet analytics can gain a major advantage.
As discussed earlier, keeping an eye on realized and unrealized gains, along with token transfers, offers valuable insights into market sentiment and network activity. Andreas M. Antonopoulos summed it up perfectly:
"The market doesn't go up forever. It has to come down eventually."
These lessons provide a solid foundation for crafting effective trading strategies.
Wallet Finder.ai is a game-changer for traders, offering real-time, cross-chain analytics. It helps identify top-performing wallets and tokens while assessing token risks through automated smart-contract evaluations.
To stay ahead, dive into market cycles using technical tools like RSI, MACD, and Bollinger Bands. Keep in mind that Bitcoin alone has seen price swings of over 30% in just a single month.
Set up watchlists and Telegram alerts on Wallet Finder.ai to monitor consistently successful wallets. Use advanced sorting and filtering features to zero in on metrics that align with your trading goals.
The crypto world is constantly shifting, with growing institutional involvement and clearer regulations helping to reduce uncertainty. Download detailed analytics reports for offline exploration, and regularly analyze alert patterns tied to profitable trades.
Stay adaptable by combining wallet profitability insights with traditional analysis to fine-tune your entry and exit strategies. By keeping up with regulatory, technological, and market changes, you’ll be better equipped to navigate the ever-evolving crypto space.
The strategies and tools outlined here lay a strong groundwork, but success in the crypto market requires persistence, regular learning, and consistent application.
To make smarter trading choices in both rising and falling markets, keep an eye on key wallet profitability metrics like profit margins, trading volume, and activity trends. These metrics offer insights into market mood and can help spot potential opportunities.
In a bull market, wallets showing steady profit growth and high activity often reflect strong confidence and may signal good moments to enter the market. On the flip side, during a bear market, watch for wallets with shrinking profit margins or reduced activity to avoid unnecessary losses. Also, spotting wallets that are quietly accumulating assets during downturns could point to future profit opportunities.
By blending wallet profitability insights with a broader market view, you’ll be better equipped to decide whether to buy, hold, or sell, adjusting your strategy to fit the market’s current state.
When you sell an investment for more than what you originally paid, that's called a realized gain. These gains are subject to taxes because the profit is officially locked in. On the other hand, unrealized gains refer to the increase in value of an investment you still own. Since you haven’t sold it yet, these gains aren’t taxed.
Grasping this difference is important for shaping your investment approach. Selling to realize gains can secure profits but comes with potential tax obligations. Meanwhile, holding onto unrealized gains keeps you exposed to market ups and downs, as values can change. Finding the right time to realize gains can help you manage taxes effectively and limit market risks.
Wallet Finder.ai makes understanding wallet profitability a breeze by giving you real-time insights into how wallets are performing. It tracks key metrics like profit and loss (PnL), entry and exit points, and trading strategies, helping you get a clearer picture of market trends.
The platform also offers tools to filter top-performing wallets, examine trading patterns, and export insights you can act on. By keeping an eye on wallet activity and spotting profitable trends, Wallet Finder.ai helps traders fine-tune their strategies and stay competitive in the market.
{"@context":"https://schema.org","@type":"FAQPage","mainEntity":[{"@type":"Question","name":"How can I use wallet profitability metrics to make smarter trading decisions in bull and bear markets?","acceptedAnswer":{"@type":"Answer","text":"<p>To make smarter trading choices in both rising and falling markets, keep an eye on <strong>key wallet profitability metrics</strong> like profit margins, trading volume, and activity trends. These metrics offer insights into market mood and can help spot potential opportunities.</p> <p>In a bull market, wallets showing steady profit growth and high activity often reflect strong confidence and may signal good moments to enter the market. On the flip side, during a bear market, watch for wallets with shrinking profit margins or reduced activity to avoid unnecessary losses. Also, spotting wallets that are quietly accumulating assets during downturns could point to future profit opportunities.</p> <p>By blending wallet profitability insights with a broader market view, you’ll be better equipped to decide whether to buy, hold, or sell, adjusting your strategy to fit the market’s current state.</p>"}},{"@type":"Question","name":"What’s the difference between realized and unrealized gains, and how do they affect your investment strategy?","acceptedAnswer":{"@type":"Answer","text":"<p>When you sell an investment for more than what you originally paid, that's called a <strong>realized gain</strong>. These gains are subject to taxes because the profit is officially locked in. On the other hand, <strong>unrealized gains</strong> refer to the increase in value of an investment you still own. Since you haven’t sold it yet, these gains aren’t taxed.</p> <p>Grasping this difference is important for shaping your investment approach. Selling to realize gains can secure profits but comes with potential tax obligations. Meanwhile, holding onto unrealized gains keeps you exposed to market ups and downs, as values can change. Finding the right time to realize gains can help you manage taxes effectively and limit market risks.</p>"}},{"@type":"Question","name":"How can Wallet Finder.ai help track and analyze wallet profitability trends for smarter trading decisions?","acceptedAnswer":{"@type":"Answer","text":"<h2 id=\"what-is-wallet-finderai\" tabindex=\"-1\" class=\"sb h2-sbb-cls\">What Is Wallet Finder.ai?</h2> <p>Wallet Finder.ai makes understanding wallet profitability a breeze by giving you real-time insights into how wallets are performing. It tracks <strong>key metrics</strong> like profit and loss (PnL), entry and exit points, and trading strategies, helping you get a clearer picture of market trends.</p> <p>The platform also offers tools to filter top-performing wallets, examine trading patterns, and export insights you can act on. By keeping an eye on wallet activity and spotting profitable trends, Wallet Finder.ai helps traders fine-tune their strategies and stay competitive in the market.</p>"}}]}

A premier DeFi analytics platform empowering traders to discover and analyze profitable blockchain wallets, trades and tokens.

