
Recovery Factor Calculation for Smart Traders
Master the recovery factor calculation to measure a strategy's resilience. Learn the formula, see DeFi examples, and find top wallets with Wallet Finder.ai.

June 20, 2026


Wallet Finder
March 10, 2026

Trying to analyze crypto without a plan is like sailing without a map—you get tossed around by the waves of hype and FUD. Professional investors don't guess; they use a repeatable framework to make informed decisions.
This guide isn't about a secret formula. It’s about building a consistent process to evaluate an asset, manage risk, and align your trades with your financial goals. Whether you're a long-term HODLer or a short-term trader, your objectives shape your entire approach.
This simple workflow gives you a bird's-eye view of how to structure your analysis, from setting clear goals to executing a trade.
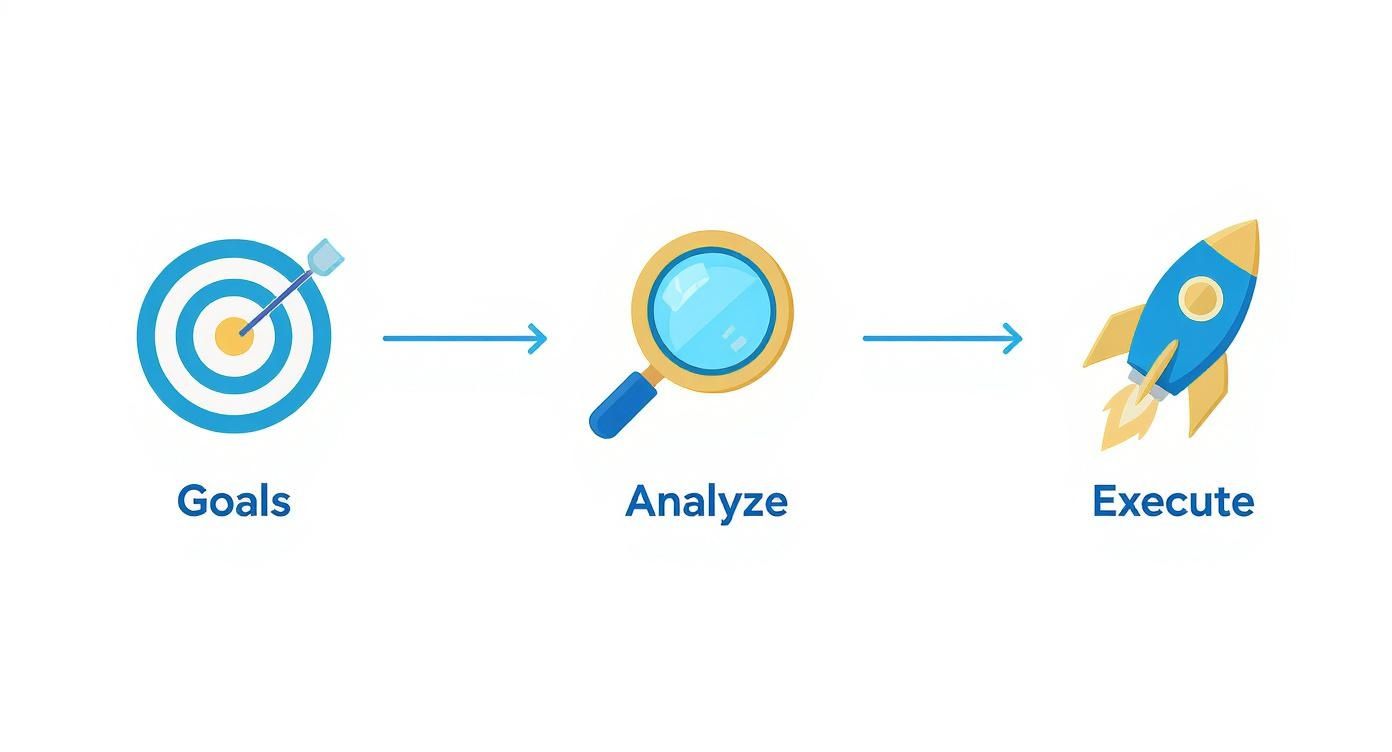
The key takeaway? Analysis is a deliberate process, not a shot in the dark. It starts with your goals and leads to confident, well-reasoned execution.
Any solid framework is built on three distinct but complementary methods. Think of them as different lenses that, when used together, give you a complete picture of any crypto asset.
No single analysis type tells the whole story. Fundamental analysis helps you find what to buy, on-chain analysis shows what smart money is actually doing, and technical analysis helps you decide when to act.
This synergy is where the magic happens. Imagine you find a project with solid fundamentals—a great team and real-world utility. Then, you look on-chain and see a huge spike in whale wallets scooping up tokens. To top it off, the technical charts are flashing a potential breakout. That’s a powerful, multi-layered confirmation for your thesis.
To make these pillars work for you, you need to know their specific strengths and when to pull each one out of your toolbox.
The three pillars of crypto analysis each answer a different question, and knowing which one to reach for first depends entirely on what you are trying to find out.
Fundamental analysis focuses on the intrinsic value and long-term potential of a project. It asks whether the project is solving a genuine problem, who is building it, and whether the team has the track record and resources to execute. This is the lens best suited to long-term investing, where the goal is to identify assets with durable value before the broader market prices that value in.
On-chain analysis shifts attention from the project itself to the live activity of the blockchain network. It asks whether real users are joining the network, whether transaction volume is growing, and whether large holders are accumulating or distributing. Because this data comes directly from the blockchain rather than from company disclosures or price charts, it provides an independent, manipulation-resistant read on market sentiment and network health at any given moment.
Technical analysis works with historical price action and market psychology. It asks where the key support and resistance levels sit, whether an asset is overbought or oversold, and whether the current price structure suggests continuation or reversal. It is most useful for short-term trading, where the goal is not to assess what an asset is worth but to identify the most favorable moment to enter or exit a position you have already decided to take.
Each method provides a different piece of the puzzle, and the most successful analysts learn to weave them together.
The broader market context always matters. For instance, the global crypto market was recently valued at around USD 5.7 billion and is projected to hit USD 11.7 billion by 2030, largely thanks to growing institutional interest and DeFi innovation. Knowing this macro trend helps frame your analysis of individual assets. This growth is exactly why having the right DeFi analytics tools for crypto traders is more critical than ever.
A killer narrative can make a token's price go vertical, but only solid fundamentals can keep it there. To properly analyze any crypto asset, you must learn to see past the hype and dig into what makes the project tick. This means thinking like a venture capitalist sizing up a startup, not just a trader staring at a chart.
Think of this section as your battle-tested due diligence checklist. It’s a systematic way to figure out if a project has the legs to be a long-term winner. We'll break down exactly what to look for, from the people writing the code to the token that fuels the ecosystem.

The first question you should ask is: who is actually building this? A project lives or dies by the team's experience, integrity, and ability to execute.
While anonymous founders are part of crypto lore—Satoshi Nakamoto is the ultimate example—a public (doxxed) team adds a serious layer of accountability. Start digging for the founders and key developers on LinkedIn and Twitter. Do they have a history of building successful products in crypto or traditional tech?
Once you know who they are, you need to understand their vision. A project's whitepaper should spell out, in no uncertain terms, the exact problem they're solving. A mission statement that's vague, overly ambitious, and lacks a clear execution plan is a massive red flag.
Tokenomics—the economic engine of a token—is arguably the most critical piece of your fundamental analysis. It governs supply, demand, and how value ultimately accrues to holders. Get this part wrong, and even a fantastic project can be a terrible investment.
Here’s a checklist of what to put under the microscope:
A project's tokenomics is its economic blueprint. If that blueprint funnels value mostly to insiders and early VCs, retail investors are often left holding the bag.
A brilliant idea is worthless if there’s no market for it. Does this project solve a painful, genuine problem for a specific group of people? Look for hard evidence of adoption and a clear edge over the competition.
Is the project offering something cheaper, faster, or more secure than what's already out there? For example, a new Layer-2 for Ethereum needs a clear advantage over giants like Arbitrum or Optimism to gain traction.
Next, pull up the project’s roadmap. A good roadmap isn't a fantasy list of buzzwords; it's a strategic plan with concrete, achievable milestones.
What a Solid Roadmap Looks Like:
Finally, take the pulse of the community and developer activity. A healthy project has an active Discord and Twitter with real discussions, not just "wen moon?" posts. Check the project's GitHub repository. Frequent updates mean development is alive and well. This 360-degree view is how you truly analyze crypto for its long-term potential.
If fundamental analysis tells you what to buy, on-chain analysis tells you what the market is actually doing with it. This is crypto's secret weapon. A blockchain is a public, open book where every single transaction is recorded. Learning how to read this book gives you an incredible edge.
By digging into the flow of funds, network activity, and wallet behavior, you can get a real feel for market sentiment and spot trends before they show up in the price.
It’s not just about counting users; you have to follow the money. Two of the most powerful indicators for this are transaction volume and exchange flows.
Transaction Volume is the total value of assets transferred on the network. A big spike in volume during a price run-up confirms the trend's strength. It also reveals real-world adoption patterns. For example, on-chain data shows massive crypto activity growth globally. In the 12 months ending last June, the Asia Pacific (APAC) region saw a 69% increase in on-chain value received, with total transaction volume jumping from $1.4 trillion to $2.36 trillion. This data, highlighted by Chainalysis, shows where global adoption is heating up.
The NVT (Network Value to Transactions) Ratio is another killer tool. Calculated by dividing the market cap by daily transaction volume, it’s crypto’s version of the Price-to-Earnings (P/E) ratio.
Some of the most powerful signals come from watching whales (large holders) and cryptocurrency exchanges. What they do often telegraphs major market moves.
When you see a large, sustained flow of a token out of exchange wallets, it's usually bullish. It means investors are moving assets to cold storage for the long haul, shrinking the available supply. Conversely, a huge inflow to exchanges can be bearish, suggesting holders are preparing to sell. Mastering this is a huge part of building a solid strategy; you can go deeper with our guide on on-chain analysis.
Tools like Glassnode and Nansen are essential for this, turning complex data into clear charts. Here’s a Glassnode chart showing the balance of Bitcoin on exchanges over time.
That steady downward slope clearly shows investors are consistently pulling Bitcoin off exchanges, which historically points to a bullish, long-term holding mindset.
Watching whale activity is like getting a peek at the "smart money's" playbook. A sudden spike in accumulation by the largest wallets can signal that well-informed, deep-pocketed investors are building a position in anticipation of a future price increase.
When you start combining these on-chain insights with your fundamental research, you stop guessing and start making data-driven decisions.
Individual project analysis and on-chain data tell you a great deal about a specific asset, but they are only half the picture. Every crypto asset trades inside a macro environment shaped by global liquidity conditions, regulatory developments, and the behavior of large capital allocators such as institutions and sovereign funds. Ignoring this layer is like analyzing a boat's engine in detail while paying no attention to the current and the weather. The environment the asset operates in will determine its trajectory as much as its internal characteristics.
This section gives you a practical framework for reading the macro signals that inform every crypto analysis and explains how to integrate them with the project-level and on-chain work you have already done.
The most powerful macro driver of crypto markets over the past decade has been the availability and cost of global capital. When central banks in major economies are operating in expansionary mode, keeping interest rates low and expanding money supply, risk assets across all markets tend to benefit as investors search for higher returns. Crypto, as one of the highest-risk, highest-potential-return asset classes, tends to benefit disproportionately from these conditions because the marginal capital flowing into risk assets finds its way into crypto in significant volume.
The inverse is equally powerful. When central banks tighten monetary policy, raising rates and reducing liquidity, the cost of holding speculative assets rises and the capital that was flowing into crypto reverses toward lower-risk alternatives. This dynamic has played out across every major crypto cycle with enough consistency that monitoring global M2 money supply trends, the Federal Reserve's rate decisions, and the US Dollar Index has become a standard practice for sophisticated crypto analysts.
The practical implication for your analysis is this: a fundamentally strong project with excellent on-chain metrics will still face significant headwinds if it is launching or running during a period of contracting global liquidity. Timing your position sizing and entry points with an awareness of the macro cycle does not require you to become a macroeconomist. It requires you to ask one question before every significant capital allocation: is the broader environment currently rewarding or punishing risk assets, and does my planned position size reflect that context?
Useful proxies to monitor are the US 10-year Treasury yield, which moves inversely to risk appetite when it rises sharply, and the total stablecoin market cap, which acts as a measure of dry powder sitting on the sidelines of crypto markets. A growing stablecoin market cap suggests capital is accumulating within the crypto ecosystem and waiting for deployment, which is a bullish macro signal. A shrinking stablecoin market cap can indicate that capital is either being deployed into assets or exiting the ecosystem entirely, and those two interpretations require different responses.
The second layer of macro analysis is the behavior of institutional capital. Institutional investors including pension funds, hedge funds, and publicly traded companies have become significant market participants in crypto over the past several years, and their entry and exit patterns move prices at a scale that retail participants simply cannot replicate. Learning to read their signals gives you a lead indicator of capital flows that often precede significant price moves.
The most visible institutional signal is ETF flow data for Bitcoin and Ethereum products. Net inflows into spot ETFs represent new institutional capital entering the market. Net outflows represent institutional de-risking. Sustained net inflows over weeks or months, particularly when they are growing in magnitude, have historically preceded or accompanied significant upside moves in Bitcoin and correlated altcoins. This data is publicly available on a daily basis and takes only minutes to check as part of a weekly analysis routine.
Regulatory developments represent the second major institutional catalyst. A jurisdiction introducing clear, favorable regulatory frameworks for crypto typically triggers institutional inflows from participants who previously could not touch the asset class for compliance reasons. Conversely, enforcement actions, exchange failures, or hostile regulatory moves tend to trigger institutional outflows and suppress retail participation simultaneously. The impact of regulatory news is often front-loaded and short-duration, with the market pricing in the information rapidly, but the structural effect of a favorable regulatory environment on long-term capital flows can persist for months or years.
The key habit to build is maintaining a simple weekly awareness of three things: ETF flow direction, any major regulatory announcements, and the current Federal Reserve posture. None of these require deep expertise to monitor. What they require is the discipline to check them before making significant portfolio decisions, so that your asset-level and on-chain analysis is always being interpreted within the correct macro context rather than in isolation.
One of the most practically useful skills in macro crypto analysis is understanding when assets are moving together and when divergences are appearing. During risk-off periods, crypto assets tend to correlate highly with each other and with other risk assets like equities. Most tokens move down together. Individual project quality matters very little in these conditions because the selling pressure is indiscriminate.
During the middle and later stages of bull markets, correlation breaks down and individual asset performance diverges significantly based on narrative strength, on-chain fundamentals, and sector rotation. This is the environment where the analytical work you have done on individual projects pays off, because assets with genuinely superior fundamentals and accelerating on-chain metrics begin to outperform the field in ways that cannot be explained by market beta alone.
Recognizing which environment you are in determines how you should weight the different layers of your analysis. In high-correlation, risk-off conditions, macro analysis should dominate your positioning decisions because project-level quality is temporarily irrelevant to price. In low-correlation, late-bull conditions, on-chain and fundamental analysis should dominate because the market is rewarding quality and punishing weakness within the asset class rather than treating everything as a single correlated block.
Once you’ve done your homework on fundamentals and confirmed network health with on-chain data, it's time to pull up the price chart. This is where technical analysis (TA) comes in, helping you answer the critical question: when is the best time to enter or exit a position?
Think of TA as reading the market's collective psychology through its fingerprints—price action, volume, and statistical indicators. While hundreds of complex tools exist, a handful of core concepts will give you the most leverage.
This diagram shows how different data streams, like on-chain metrics, can be pulled together to create actionable trading signals. Layering these signals with classic chart analysis builds a much more robust trading thesis.
The absolute bedrock of TA is support and resistance. These are horizontal price zones where buying or selling pressure has historically been strong enough to halt or reverse a trend.
One of the most powerful patterns is when a price decisively breaks through resistance. That old ceiling often flips to become the new floor. Spotting these zones on a chart gives you clear, logical areas to place buy orders, set stop-losses, and map out profit targets.
After mapping out key levels, indicators help you read the room. They act like a dashboard, giving you a sense of the trend's strength and direction.
Technical indicators don't predict the future; they measure the present. They are most powerful when used to confirm what you already see in the price action, not as standalone buy or sell signals.
Instead of plastering your chart with dozens of indicators, focus on a few that measure different things. A solid starting trio would be one for trend, one for momentum, and one for volume.
These three indicators measure different dimensions of market behavior, and using them together gives you a far more complete read on a price move than any one of them can provide alone.
Moving averages smooth out the noise of day-to-day price fluctuations by calculating the average closing price over a defined number of periods. A shorter-period moving average, such as the 20-day, responds quickly to recent price changes and reflects current momentum. A longer-period moving average, such as the 50-day or 200-day, moves slowly and represents the broader directional trend. The relationship between the two is where the signal lives. When a short-term moving average crosses above a long-term one, it indicates that recent price action has strengthened relative to the established trend, a pattern known as a golden cross that traders widely interpret as a bullish signal. The opposite crossing, where the short-term average drops below the long-term one, is called a death cross and signals the reverse. Moving averages do not predict reversals; they confirm that a directional shift has already begun, which makes them most useful as trend filters rather than entry triggers.
The Relative Strength Index measures not the direction of price movement but the speed and intensity of recent changes. It oscillates between zero and one hundred, with readings above seventy conventionally interpreted as overbought territory, meaning the asset has risen so quickly that a pause or pullback is statistically more likely than further immediate gains. Readings below thirty suggest oversold conditions, where selling has been intense enough that a relief bounce becomes increasingly probable. The most important nuance to internalize about RSI is that overbought does not mean sell and oversold does not mean buy. In strong trending markets an asset can remain overbought for extended periods as momentum sustains the move. RSI is most reliable as a warning flag when it diverges from price, such as when price makes a new high but RSI makes a lower high, which indicates that the upward momentum is fading even as the price continues to climb.
Volume is the most honest of the three indicators because it measures actual participation rather than derived statistics. Every bar on a volume chart represents the total amount of an asset that genuinely changed hands during that period. A price breakout above a key resistance level accompanied by a significant surge in volume is a strong confirmation that the move has real conviction behind it, because it means many participants acted on the breakout simultaneously. The same breakout on thin, declining volume is a warning that the move may be a false start driven by a small number of transactions rather than broad market commitment. In practice, volume is most useful as a confirmation tool: look to it after you have identified a price move or pattern, and use it to assess whether the market is genuinely participating in what the chart appears to be showing.
These indicators become truly powerful when used together. For example, if a token's price is bumping up against a major resistance level while the RSI is screaming over 70, that adds serious weight to the idea that a pullback is on the horizon.
This kind of multi-layered analysis is crucial for timing your trades, especially when you consider the boom-and-bust cycles inherent to this market. To get a better handle on this, it’s worth learning how to analyze cyclical crypto market patterns.
It's also important to keep an eye on the bigger picture of market liquidity. The explosive growth in stablecoin supply, which recently topped $300 billion, is a huge indicator of the capital waiting on the sidelines. With the total crypto market cap crossing the $4 trillion threshold, understanding these macro flows is more important than ever.
Gathering data is only half the battle. The real skill in learning how to analyze crypto is weaving all those threads together into a repeatable process that not only spots opportunities but, more importantly, protects your capital.
This is where you graduate from being a researcher to a strategist. A disciplined process turns chaotic market signals into a clear plan. It means building a personal checklist, writing down your reasoning for every trade, and having a rock-solid risk management framework in place before you click "buy."

For every asset you consider, you need an investment thesis. This can be a simple document—even just a few paragraphs—that lays out exactly why you believe this asset is a good investment at its current price. This simple act forces you to clarify your thinking and serves as an anchor when emotions run high.
Your thesis should pull together key findings from your analysis:
To make this consistent, create a standardized research checklist. It’s your safeguard against skipping crucial steps when you're hyped about a new token. It holds every potential investment to the same high standard.
No amount of brilliant analysis will save you from sloppy risk management. In a market where assets can drop 50% or more in a few days, managing your downside is the only way to stay in the game long enough to win.
Actionable Risk Management Rules:
True portfolio diversification involves a mix of assets across different narratives—such as Layer-1s, DeFi, gaming, and real-world assets (RWAs). This approach helps insulate your portfolio from a sector-specific downturn.
Finally, the biggest obstacle to your success is often psychological. The pressures of FOMO (fear of missing out) and FUD (fear, uncertainty, and doubt) can make even the most disciplined analyst abandon their strategy.
When you see a coin pumping and feel the urge to chase it, stop. Go back to your checklist. Has anything fundamentally changed, or are you just reacting to a green candle?
Likewise, when the market is crashing and FUD is thick, revisit your thesis. If the reasons you invested are still valid, that dip might actually be a buying opportunity. Having a written plan is your best defense against making emotional, irrational decisions.
The gap between knowing how to analyze crypto and actually doing it consistently is almost always a workflow problem rather than a knowledge problem. Most traders accumulate the analytical frameworks they need but apply them episodically, running thorough research when a new opportunity excites them and skipping it entirely when market conditions are quieter or less emotionally engaging. The result is an inconsistent standard of due diligence that tends to produce the worst outcomes precisely when excitement is highest and rigor is most needed.
A repeatable analysis workflow solves this by reducing the quality of your research to a process rather than an intention. This section gives you a practical three-layer workflow that covers macro context, on-chain signals, and project-level fundamentals in a way that takes less than an hour per week to maintain once it is set up.
The macro scan is not a deep-dive exercise. It is a fifteen-minute check of three indicators that tells you whether the environment is currently favorable, neutral, or hostile to risk assets. Run this at the start of each week, and it will color every other analytical decision you make until the next scan.
The three checks are: first, the direction of the US 10-year Treasury yield over the past two weeks and whether it is accelerating, stable, or reversing. A sharp, sustained rise in yields tightens the risk environment for crypto. A flattening or decline suggests improving conditions. Second, the net flow direction of Bitcoin and Ethereum spot ETFs over the trailing two weeks. Consistent net inflows are constructive. Consistent net outflows are a warning. Third, the total stablecoin market cap trend over the past thirty days. Growth suggests accumulation and dry powder buildup. Contraction suggests capital is either deploying or exiting.
Record these three observations in a simple weekly log with a one-line summary of the overall macro stance: favorable, neutral, or cautious. This summary becomes the baseline for all position sizing decisions that week. In a favorable macro environment, you operate at your full normal position sizing. In a cautious environment, you reduce sizing by a defined percentage, such as thirty to fifty percent, regardless of how attractive any individual opportunity looks at the project level.
The on-chain review covers the assets on your active watchlist and takes about twenty minutes once you have a standard set of tools set up. For each asset you are currently holding or actively considering, check four metrics: active address trend over the trailing thirty days, exchange netflow direction over the trailing seven days, the behavior of the largest wallet cohort in that asset over the trailing fourteen days, and any significant changes in the asset's holder distribution.
You are not making trading decisions from this review in isolation. You are updating your read on the health of each position relative to the last time you checked. A position you have held for three weeks where active addresses are climbing, exchange outflows are persistent, and large wallets are accumulating has strengthened since your entry. A position where all three metrics have reversed warrants a closer look at whether the thesis is still intact.
The most important output of this review is a simple updated status for each watchlist asset: thesis intact, thesis weakening, or thesis invalidated. If any asset moves to thesis invalidated based on on-chain data, that is an instruction to revisit the position before the next week passes, not a mandatory sell signal, but a prompt to reassess with fresh eyes.
Unlike the macro scan and on-chain review, the project-level fundamental analysis is not a regularly scheduled activity. It is triggered by specific events: a new asset entering your watchlist for the first time, a major development in a project you already hold, or an on-chain signal that requires you to reassess the fundamental thesis behind a position.
When a deep dive is triggered, work through a standard checklist in a fixed order. Start with the team and any recent changes in key personnel or partnerships. Proceed to tokenomics, specifically checking whether any significant unlock events are approaching in the next sixty to ninety days that could create predictable sell pressure. Review the roadmap for any missed milestones or delays that were not communicated proactively. Check developer activity on GitHub for any changes in commit frequency that might indicate slowing development. Finally, review the competitive landscape to assess whether any new entrants or protocol upgrades in adjacent projects have weakened the asset's relative value proposition.
Write a brief thesis statement for each project you research, no more than three sentences summarizing why you own or are considering owning it, what on-chain signal would tell you the thesis is working, and what development would tell you it has broken down. Keeping these statements updated is the single most effective practice for maintaining the analytical discipline that separates investors who learn from their positions from those who simply react to price.
Even with a great framework, you're always going to have questions. The market moves, things get choppy, and new situations pop up. Learning how to analyze crypto is a continuous process of refinement.
Let's tackle some of the most common questions from new and experienced traders.
This is the classic debate, but it's the wrong question. Fundamental, on-chain, and technical analysis aren't competitors—they're different lenses to view the same asset, and they work best together.
Relying on just one is like trying to navigate with only a map but no compass. You need the complete toolkit to get the full picture.
Jumping into a brand new token with no price history feels like flying blind. This is where your fundamental analysis skills must do all the heavy lifting.
With a new launch, be laser-focused on a few key things:
Even with limited on-chain data, you can still spot red flags. Check the initial wallet distribution. If a handful of wallets hold almost the entire supply, that's a major warning sign.
The single biggest mistake I see beginners make is chasing hype on X or Telegram without doing a lick of their own research. That’s just pure FOMO, and it’s a guaranteed way to get wrecked. Ignoring risk management and fixating on one metric are close seconds.
At the end of the day, every move you make should be backed by your own analysis, not just some influencer's latest call.
Analyzing crypto during a market downturn requires shifting the weight you assign to different layers of your framework. In a falling market, price action and short-term technical signals become significantly less reliable because selling pressure is often indiscriminate and driven by macro factors or forced liquidations rather than any project-specific deterioration. Technical levels that held during a bull run frequently fail to provide meaningful support during a sustained risk-off period.
What becomes more valuable during downturns is the on-chain and fundamental layer. The investors who identify the best entry points during bear markets are typically those who use the falling price environment to do the fundamental work they did not have time for when prices were rising. A project whose on-chain metrics, specifically active addresses, developer activity, and holder distribution, are holding steady or improving during a price decline is demonstrating that the underlying network has genuine utility that is independent of speculative price action. That resilience is exactly the signal you want to see before building a position at lower prices.
The practical approach during a downturn is to reduce your analysis focus from price charts to on-chain health metrics and fundamental quality, and to extend your investment horizon. The question you are trying to answer changes from "where will this price go in the next two weeks" to "does this project have the fundamentals to be significantly more valuable in twelve to eighteen months than it is today." That shift in time horizon combined with rigorous fundamental work is the analytical posture that has historically produced the best entries for the subsequent recovery cycle.
The most consistent analytical mistakes in crypto fall into a small number of recurring categories that are worth naming explicitly so you can build habits to prevent them.
The first is confirmation bias in research: beginning with a conclusion that a token is going to increase in value, usually because of social media hype or a friend's recommendation, and then selectively reading the available information to support that conclusion rather than genuinely testing it. The cure for this is to actively seek out the strongest case against every position you are considering before you finalize any decision. If you cannot articulate a compelling bear case for an asset, you have not done enough research.
The second is ignoring tokenomics in favor of narrative. A project can have a genuinely compelling technology, a strong team, and a real market opportunity, and still be a poor investment if the token supply structure heavily favors early investors and the team at the expense of market participants. Upcoming unlock events, inflationary emission schedules, and concentrated whale ownership are quantifiable risks that are fully visible in the data and frequently ignored because the narrative is exciting.
The third is treating on-chain data as a confirmation tool rather than an independent input. Many traders run on-chain checks after they have already formed a view from price action, which means they are looking for data that validates what they already believe rather than genuinely interrogating the on-chain health of the asset. Running your on-chain review before looking at the price chart, not after, is a simple habit change that reduces confirmation bias and produces more honest assessments.
Knowing when to exit a losing position is the practical question that most analytical frameworks do not answer clearly enough. The answer is not a price level. It is a thesis test. Before you enter any position, write down the two or three specific conditions that would tell you your original thesis was incorrect. These should be observable, objective data points, not price levels, because price alone does not tell you whether the underlying reasoning was wrong or whether the market is temporarily mispricing an asset you still believe in.
Examples of thesis-invalidating conditions might include: a key team member departing for a competing project, active addresses falling below a defined threshold for three consecutive weeks, a major protocol exploit that damages user trust, or a competitor shipping a feature that eliminates the asset's primary competitive advantage. These are conditions where the reasoning behind the investment has materially weakened, not just conditions where the price has fallen.
When one of these conditions occurs, exit the position promptly and without waiting for a price recovery to break even. The distinction between "the market is wrong about this asset temporarily" and "the thesis I built my position on is no longer valid" is one of the most important judgments in active investing, and it is only possible to make it clearly if you defined the thesis and its invalidation conditions in writing before you entered the position. This pre-commitment to specific exit conditions is what transforms analytical skill into actual portfolio discipline.
Ready to turn on-chain data into your competitive advantage? Wallet Finder.ai helps you discover and track the most profitable wallets in DeFi, giving you real-time alerts on their trades. Stop guessing and start mirroring the strategies of top performers. Start your 7-day free trial today.

A premier DeFi analytics platform empowering traders to discover and analyze profitable blockchain wallets, trades and tokens.

