
Recovery Factor Calculation for Smart Traders
Master the recovery factor calculation to measure a strategy's resilience. Learn the formula, see DeFi examples, and find top wallets with Wallet Finder.ai.

June 20, 2026


Wallet Finder
November 14, 2025
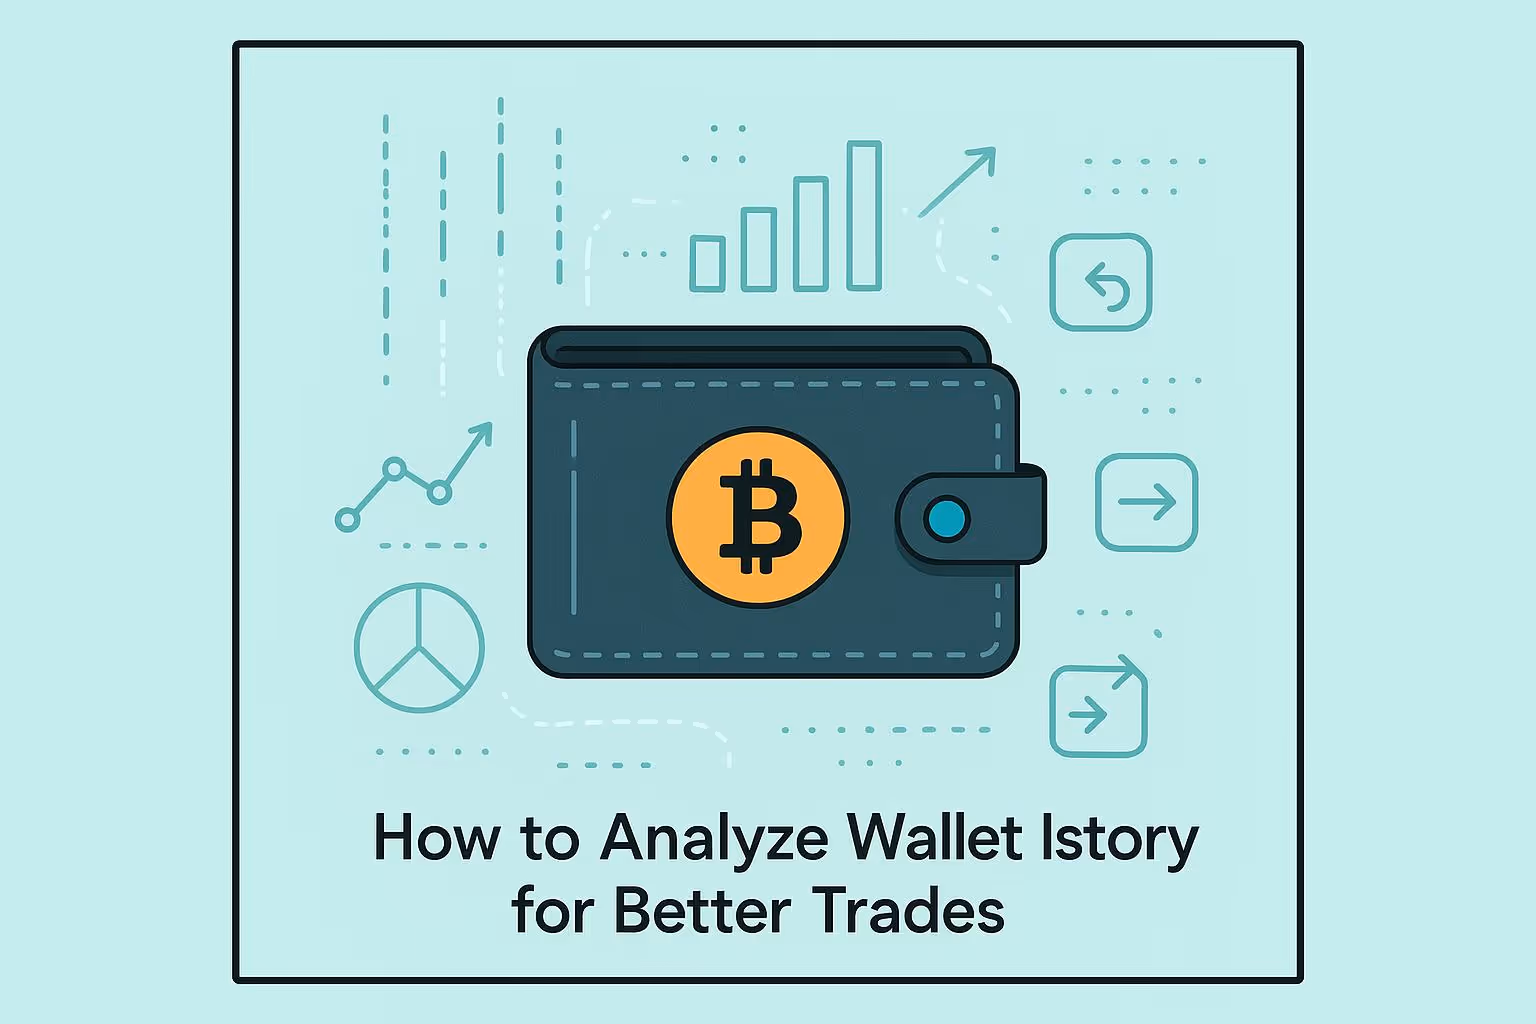
Analyzing wallet history can help you make smarter crypto trades. By studying transaction patterns, you can find better entry and exit points, manage risks, and learn from successful wallets. Every wallet's transaction history is public and full of useful insights - like when to buy or sell, what tokens to focus on, and how to handle market changes.
Here’s a quick breakdown:
To uncover profitable trading patterns, it's essential to collect and organize wallet data effectively. Blockchain data covers thousands of transactions across different timeframes and token types, so knowing where to find reliable sources and how to structure the information is crucial for meaningful analysis.
Start by using blockchain explorers like Etherscan for Ethereum wallets or BscScan for Binance Smart Chain addresses. Simply input the wallet address to access its complete transaction history. However, these explorers often display raw data, which can be tough to interpret without additional tools or context.
For a more streamlined approach, platforms like Wallet Finder.ai automatically gather data from Ethereum, Polygon, Arbitrum, and more. Not only does it aggregate transaction histories, but it also enriches them with profit/loss calculations, token prices, and performance metrics. Plus, its real-time tracking tools let you monitor profitable wallets as they execute new trades.
When selecting wallets for analysis, focus on addresses with consistent activity over 3–6 months. Wallets with only sporadic activity or a handful of transactions won’t offer enough data to spot reliable patterns. Ideally, look for wallets that have completed at least 50–100 trades under varying market conditions. Insights from Timing Liquidity Pool Entries: Data-Driven Tips can further help you identify optimal entry points and improve decision-making based on real trading data.
Once you’ve gathered transaction data, the next step is to filter and categorize it to align with your trading goals. Start by organizing transactions by date ranges to identify strategies used during bull versus bear markets.
You can also group transactions by asset type to pinpoint which tokens or sectors a wallet focuses on. For instance, you might find that a successful wallet primarily trades DeFi tokens during specific market cycles or invests heavily in layer-1 blockchain tokens before major upgrades. This categorization helps highlight a wallet’s strengths and areas of expertise.
Filtering transaction sizes is another key step. Separating small trades from large ones can provide clearer insights into strategy. Small trades often test ideas, while larger trades reflect high-confidence moves.
Platforms like Wallet Finder.ai simplify this process with built-in filters. You can sort transactions by date ranges (e.g., 01/15/2024 to 03/15/2024), set minimum transaction values (e.g., $5,000.00), or focus on specific token categories. The platform even calculates win rates and average returns, helping you identify when a wallet performs best.
Once your data is well-organized, you’re ready to export it for further analysis.
Exporting wallet data allows for custom reports and deeper analysis. While most blockchain explorers let you download transaction histories as CSV files, these often lack the detailed context needed for trading insights.
Wallet Finder.ai's export feature enhances this process by including key data points like entry and exit prices, holding periods, profit/loss in USD, and token performance compared to major cryptocurrencies. This additional context makes it easier to see which trades had the biggest impact on a wallet’s overall performance.
Exports are formatted in standard US styles (e.g., MM/DD/YYYY for dates, $1,234.56 for currency), ensuring compatibility with tools like Excel and Google Sheets. From there, you can create pivot tables to analyze monthly performance, calculate average holding periods for profitable trades, or identify the tokens that delivered the highest returns.
For more in-depth analysis, try exporting data from multiple wallets at once. This lets you compare strategies across several high-performing traders and spot patterns that consistently work across different market conditions. Many traders find that strategies repeated across 5–10 successful wallets tend to be the most reliable, rather than relying on unique approaches from a single address.
Once your wallet data is sorted, visual charts can transform those raw numbers into meaningful insights. Numbers alone don't tell the full story, but charts make it easy to see when wallets are buying, selling, or holding.
Different types of charts can help you analyze wallet activity in unique ways:
Visual charts can uncover patterns you might otherwise miss. For example, some wallets tied to DeFi projects show a habit of adding positions early in the year and rebalancing later. This could point to intentional portfolio strategies.
Volume spikes are another clue. When transaction sizes suddenly exceed the norm, it often signals major market shifts. By comparing data from multiple wallets, you might notice correlations - like several wallets buying the same token at the same time, hinting at a shared opportunity.
Charts also make it easier to see how wallets adjust during market swings, giving you a better understanding of risk management strategies. All these insights are key to finding the best entry and exit points for trades.

Wallet Finder.ai simplifies the process with its Comprehensive Analytics Dashboard, which turns complex wallet data into easy-to-read charts. You don’t need to manually crunch numbers or rely on outside tools - the platform does it for you.
"Easily visualize historical wallet performance through dynamic charts, clearly displaying investment returns and profitability metrics." - Wallet Finder.ai
One standout feature is Custom Graphs, which lets you create personalized visuals from any dataset right within the platform. You can tweak filters and timeframes instantly, making analysis quick and flexible. This feature is part of the Premium subscription plan.
The Wallet Overview feature takes things further by comparing total investments to actual returns. These detailed charts help you calculate ROI and pinpoint the most profitable periods.
For wallets with hundreds of transactions across multiple blockchains, Wallet Finder.ai groups related trades and highlights key moves automatically. Plus, you can export these visuals as PNG files for presentations or in CSV/Excel formats for deeper dives into the data.
"Visualize complex data trends with customizable charts and export insights into formats like CSV, Excel, or PNG for further analysis or reporting." - taalk.com
With these built-in tools, there's no need for separate charting software. You can focus entirely on analyzing trends and uncovering actionable trading insights.
Once your charts are ready, the next step is to spot trading patterns that lead to profits. By analyzing historical wallet data, you can uncover behaviors that set successful traders apart. This insight serves as a guide to improve your trading decisions.
Timing is everything in trading. By tracking when successful wallets make their moves, you can identify clear entry and exit signals. For example, large stablecoin movements, like significant inflows of USDC or USDT, often hint at upcoming market shifts. When followed by strategic purchases, it usually signals accumulation is underway.
Whale activity - or large transfers between wallets and exchanges - can also reveal critical entry points. These movements often indicate institutional traders positioning themselves ahead of price swings. For instance, when multiple high-performing wallets shift funds to exchanges at the same time, it often precedes selling pressure, signaling a potential exit point.
Here’s a real-world example: an analysis of $2 million worth of 1INCH token transactions predicted a 25% price increase the next day, resulting in a profit of $6,250 within 24 hours.
Metrics like realized and unrealized PNL (profit and loss) help identify the best times to take profits or hold your position. If wallets with high win rates begin to realize profits on specific tokens, it often signals a good time to exit. On the other hand, if these wallets show unrealized gains but continue holding, it could mean they expect further price increases.
The percentage of wallets in profit versus loss is another useful indicator. A high percentage of wallets in profit might mean the market is overextended, while widespread losses could point to a buying opportunity during a market downturn.
From here, it’s important to dive deeper into how token selection and trade timing can refine these strategies.
The types of tokens traders choose can be just as revealing as their timing. For instance, when multiple high-performing wallets start accumulating the same token in growing sectors like DeFi or layer-2 solutions, it’s worth looking into the fundamentals behind their choices.
Holding periods also offer valuable clues. Wallets that profit from quick trades (less than a week) use different strategies than those holding longer-term positions. By understanding these patterns, you can align your trading style with proven methods.
Trading activity patterns over time can reveal seasonal trends or behaviors tied to market cycles. For example, some wallets increase activity during specific months or under certain conditions, showing they follow systematic strategies. Institutional wallets, for instance, often ramp up DeFi investments early in the year and rebalance later, indicating planned portfolio management.
Another helpful tool is analyzing average buy and sell prices of successful wallets. If a wallet with a win rate of 76.49% consistently buys a token within specific price ranges, those levels can act as benchmarks for your trades.
These insights set the stage for smarter analytics tools to help you go even further.
Wallet Finder.ai takes the guesswork out of pattern recognition by offering advanced tools to refine your trading strategies. Its Discover Trades feature automatically identifies profitable strategies, including the best entry and exit points, as well as position sizing techniques.
The platform’s profitability filtering system is a game-changer. It allows you to focus on wallets that meet specific criteria like win rates, profit margins, and consistency. Instead of manually analyzing hundreds of transactions, you can zero in on wallets that align with your risk tolerance and trading style - cutting analysis time by 70%.
Real-time alerts via Telegram keep you informed when tracked wallets make notable moves. For instance, if you’re monitoring a wallet known for consistent profits in DeFi tokens, you’ll get instant updates when they enter new positions or make large transfers. This gives you the chance to act quickly on emerging opportunities.
The custom watchlists feature lets you organize high-performing wallets by strategy, sector, or trading frequency. You can create separate lists for swing traders, DeFi specialists, or NFT collectors, making it easier to spot trends and opportunities in specific areas.
For deeper analysis, the platform offers data export capabilities. You can download transaction histories, profitability metrics, and trading patterns to analyze offline using tools like Excel or Python. This allows you to build your own models or test strategies based on proven wallet behaviors.
Finally, the Comprehensive Analytics Dashboard pulls everything together in one place. It displays key metrics like win rates, average holding times, and profit distributions, giving you a clear view of which trading patterns are currently the most effective. With all these tools at your fingertips, you can make more informed decisions in any market condition.
Now it's time to dive into the numbers and see how different wallets stack up. By tracking specific metrics, you can uncover strategies that work best for your goals.
Here are the most important metrics to keep an eye on:
These metrics can guide you in adjusting your trading approach as you learn more.
To make sense of all this data, comparison tables are your best friend. Create a table listing wallets in rows and key metrics in columns. This layout makes it easy to see which wallets perform well in specific areas.
A simple table might include wallet nicknames, win rates, total profit or loss, average trade size, and maximum drawdown. For example, you could compare five wallets focused on DeFi trading over the past three months and see how they stack up.
Ranking systems can also help you decide which wallets deserve your attention. Assign weights to the metrics that matter most to you. If consistent profits are your goal, focus on win rates and lower drawdowns. If you're more of a risk-taker, prioritize total returns and average profit per trade.
Time-based comparisons are another way to evaluate performance. Create separate tables for bull markets, bear markets, and flat markets. Some wallets might shine during volatile times but struggle when the market is stable, while others perform steadily in any condition.
You can also group wallets by their strategy types - like DeFi yield farming, NFT trading, or altcoin speculation. This way, you're comparing similar strategies instead of mixing apples and oranges. Each strategy has its own benchmarks for success.
Lastly, take a look at portfolio allocations. Some wallets might put 80% of their funds into just a few positions, while others spread their investments across many tokens. These patterns often reveal a lot about risk levels and overall performance.
If all this sounds like a lot to manage manually, Wallet Finder.ai has tools to make it easier. Their profitability filtering system lets you set criteria like minimum win rates, profit thresholds, or maximum drawdown limits. Instead of crunching numbers yourself, you can instantly filter thousands of wallets to find the ones that meet your needs.
Custom watchlists allow you to organize wallets into groups - like top performers, rising stars, or conservative players. This makes it easier to track how different types of wallets perform over time.
You can also use the platform's data export features to analyze performance further. Export metrics, transaction histories, or comparison data to tools like Excel for deeper insights or to integrate with your current trading systems.
With real-time performance tracking, you can keep up with market changes. Wallet Finder.ai updates rankings as conditions shift, helping you spot strategies that adapt well to different environments.
The Comprehensive Analytics Dashboard ties it all together. It uses visual charts to show trends, ranking changes, and how different metrics relate to each other. These visuals make it much easier to identify patterns or outliers that might be missed in raw data.
Digging into wallet history turns raw data into clear trading strategies. It’s a way to make smarter decisions in the ever-changing world of crypto markets.
The four-step approach offers a practical guide to understanding successful wallet strategies. Data gathering and preparation ensures your information is clean and reliable, setting the stage for meaningful analysis. Then, visual analysis with charts and graphs brings trends to life - patterns that are hard to spot in raw numbers suddenly become clear.
For example, when you map a wallet's performance over time, sudden shifts in strategy jump out. You might spot a wallet moving from quick day trades to longer-term holds just before a big market change. These shifts can offer valuable insights into timing strategies.
The real magic happens with pattern recognition. Spotting consistent behaviors - like when a wallet tends to buy or sell - reveals the logic behind profitable trades. Some wallets thrive by jumping on early momentum in new tokens, while others succeed by going against the crowd during market downturns. Recognizing these patterns can help you align strategies with your own risk tolerance and market goals.
Finally, performance metrics comparison ties it all together. A wallet that shows flashy gains might actually take on too much risk, while a steadier performer could provide more reliable growth over time. Metrics help you separate luck from skill, giving you a clearer picture of what really works.
This method takes the emotion out of trading. Instead of chasing market hype or relying on gut feelings, you’re basing decisions on solid, proven data. By combining data collection, visualization, and pattern recognition, you can turn insights into consistent, profitable strategies.
Wallet Finder.ai makes it easier to put these insights into action. Its advanced filtering system helps you quickly find wallets that match your trading style, whether you’re after consistent performers or high-risk, high-reward strategies.
The platform’s real-time tracking keeps you updated as market conditions change, so you can adjust before patterns lose their edge. Plus, custom watchlists let you keep tabs on multiple wallet strategies at once, giving you flexibility for different market scenarios.
With data export features, you can seamlessly integrate the platform’s insights into your favorite trading tools, whether you prefer Excel or automated systems. And the comprehensive analytics dashboard simplifies everything, turning complex data into clear visuals. Instead of wrestling with spreadsheets, you’ll get intuitive charts and rankings that make spotting patterns faster and easier.
Wallet Finder.ai bridges the gap between analysis and action, helping you make smarter, data-driven trading decisions.
To find wallets that could inspire profitable trading strategies, focus on those with consistent results and active trading patterns. Look for wallets that demonstrate regular profitability, a high volume of transactions, and thoughtful buying or selling habits.
Keep an eye on wallets often called 'smart money', which are typically owned by seasoned traders or institutions. These wallets can reveal useful trends and trading approaches. Key factors to analyze include recent transactions, profit-to-loss ratios, and their overall influence in the market. This information can guide you in shaping better strategies.
Tools like Wallet Finder.ai make this process easier by providing insights into wallet performance, trading behaviors, and market trends. They help you quickly zero in on wallets with high potential.
To pinpoint the best times to enter or exit a trade in crypto, it's smart to pay attention to key signals like trend direction, momentum, and support and resistance levels. Tools like Moving Averages, the Relative Strength Index (RSI), and Bollinger Bands are great for spotting potential opportunities in the market.
Another helpful tip is to look into historical wallet activity. This can show patterns, like repeated buying or selling at certain price points. By combining these patterns with broader market analysis, you can get a better sense of when to make well-informed trading moves.
Wallet Finder.ai simplifies wallet history analysis by providing tools that dive deeper than basic transaction tracking. It doesn’t just show where funds are moving - it uses clustering algorithms and real-time performance tracking to reveal connections between wallets and uncover trading patterns.
With this platform, users can spot profitable strategies by examining historical data, keeping tabs on wallet performance, and getting alerts about important market trends. This efficient system helps traders make smarter, data-backed decisions without the hassle.
{"@context":"https://schema.org","@type":"FAQPage","mainEntity":[{"@type":"Question","name":"How can I find wallets to analyze for profitable trading strategies?","acceptedAnswer":{"@type":"Answer","text":"<p>To find wallets that could inspire profitable trading strategies, focus on those with consistent results and active trading patterns. Look for wallets that demonstrate <strong>regular profitability</strong>, a high volume of transactions, and thoughtful buying or selling habits.</p> <p>Keep an eye on wallets often called <strong>'smart money'</strong>, which are typically owned by seasoned traders or institutions. These wallets can reveal useful trends and trading approaches. Key factors to analyze include recent transactions, profit-to-loss ratios, and their overall influence in the market. This information can guide you in shaping better strategies.</p> <p>Tools like Wallet Finder.ai make this process easier by providing insights into wallet performance, trading behaviors, and market trends. They help you quickly zero in on wallets with high potential.</p>"}},{"@type":"Question","name":"What should I look for in wallet history to spot the best times to buy or sell crypto?","acceptedAnswer":{"@type":"Answer","text":"<p>To pinpoint the best times to enter or exit a trade in crypto, it's smart to pay attention to key signals like <strong>trend direction</strong>, <strong>momentum</strong>, and <strong>support and resistance levels</strong>. Tools like Moving Averages, the Relative Strength Index (RSI), and Bollinger Bands are great for spotting potential opportunities in the market.</p> <p>Another helpful tip is to look into historical wallet activity. This can show patterns, like repeated buying or selling at certain price points. By combining these patterns with broader market analysis, you can get a better sense of when to make well-informed trading moves.</p>"}},{"@type":"Question","name":"How does Wallet Finder.ai simplify wallet history analysis compared to standard blockchain explorers?","acceptedAnswer":{"@type":"Answer","text":"<p>Wallet Finder.ai simplifies <a href=\"https://www.walletfinder.ai/blog-01\">wallet history analysis</a> by providing tools that dive deeper than basic transaction tracking. It doesn’t just show where funds are moving - it uses <strong>clustering algorithms</strong> and <strong>real-time performance tracking</strong> to reveal connections between wallets and uncover trading patterns.</p> <p>With this platform, users can spot profitable strategies by examining historical data, keeping tabs on wallet performance, and getting alerts about important market trends. This efficient system helps traders make smarter, data-backed decisions without the hassle.</p>"}}]}

A premier DeFi analytics platform empowering traders to discover and analyze profitable blockchain wallets, trades and tokens.

