
Recovery Factor Calculation for Smart Traders
Master the recovery factor calculation to measure a strategy's resilience. Learn the formula, see DeFi examples, and find top wallets with Wallet Finder.ai.

June 20, 2026


Wallet Finder
November 20, 2025

DeFi generates tons of complex blockchain data. Transaction visualization tools make this data easier to understand by turning it into clear visuals like charts and dashboards. These tools help traders:
For example, Wallet Finder.ai simplifies wallet performance tracking and sends instant alerts for important trades. With DeFi growing rapidly, tools like these are essential for navigating the market and staying ahead.
Transaction visualization offers three major benefits for DeFi users: improved transparency, smarter decision-making, and stronger risk management. These benefits reshape how traders, investors, and everyday users engage with decentralized finance protocols, making complex systems easier to navigate and understand.
DeFi’s open nature is only valuable if users can clearly interpret the transactions. Visualization tools simplify complex blockchain data, turning it into easy-to-follow visual stories.
Joshua Odmark, CIO and Founder of Local Data Exchange, explains why this transparency matters:
"DeFi's open-source nature lets anyone audit the code and transaction flow."
With visualization tools, users can trace funds and map wallet interactions without combing through raw blockchain hashes. Instead, visual maps show exactly where funds are going and why.
Ahmed Yousuf, Financial Author and SEO Expert Manager at CoinTime, highlights the role of blockchain technology in this process:
"DeFi platforms leverage blockchain technology to create an open, immutable ledger that ensures every transaction is publicly verifiable, traceable, and tamper-proof."
These tools provide real-time visuals of payment flows, making even the most intricate transactions clear and accessible. This transparency not only simplifies complex processes but also sets the stage for better decision-making.
In the fast-paced world of DeFi, traders need to quickly process large amounts of data. Visualization tools transform raw blockchain data into clear trends, risk assessments, and emerging opportunities.
Strategic dashboards display key market metrics like liquidity levels, total value locked (TVL), price changes, transaction volumes, and yield opportunities - all in one place. Instead of juggling spreadsheets or analyzing raw data, traders can access everything they need through a single interface.
Beyond basic charts, advanced visualizations powered by machine learning can predict token demand, price surges, liquidity issues, and shifts in market sentiment. These insights enable traders to anticipate market movements and act proactively rather than reactively. Exploring Low Liquidity in Meme Tokens: Case Studies helps illustrate how these predictive models work in real-world scenarios and why timing is critical when entering or exiting such pools.
For example, visual tools can uncover hidden relationships in data, such as correlations between DeFi protocols or the impact of large wallet movements (“whales”) on smaller tokens. These insights turn raw data into actionable strategies.
Real-time monitoring through visual analytics also allows traders and businesses to respond quickly to market changes or regulatory updates. This speed can make the difference between seizing a profitable opportunity and missing it.
DeFi’s decentralized setup comes with unique security challenges, but transaction visualization provides users with tools to spot and address risks early.
Pattern detection through visual analytics can uncover suspicious activities, track market trends, and monitor liquidity pools. By analyzing transaction flows, wallet behaviors, and token movements, these tools can identify irregularities. Machine learning algorithms enhance this process by detecting anomalies that might signal fraud before significant damage occurs.
Past incidents, such as smart contract exploits, highlight the importance of real-time anomaly detection. Visual monitoring tools can flag unusual trading volumes, sudden price spikes, or suspicious activity from large holders. These early warnings allow for protective measures, like activating circuit breakers to halt trading temporarily during questionable events.
Dev3lop emphasizes the business value of these tools:
"By effectively mapping distributed ledger transactions, businesses can gain unprecedented transparency into their operations and enjoy richer analytic insights - turning cryptic ledger entries into vibrant opportunities for innovation."
Risk management also includes monitoring governance token distributions to prevent any single entity from gaining excessive control. Time delays for proposal execution give communities a chance to review and block potentially harmful actions.
The Financial Action Task Force (FATF) highlights the importance of advanced monitoring tools:
"A responsible use of new technologies, including digital identity and cutting-edge transaction monitoring and analysis solutions (including collaborative analytics) can assist effective, risk-based implementation of the FATF Standards by the public and private sectors, as well as promote financial inclusion."
These tools don’t just reveal risks - they also guide users toward safer practices, such as enabling two-factor authentication, using hardware wallets for private key storage, and verifying website links before clicking. By combining visualization with proactive steps, users can strengthen their security and confidence in DeFi.
Visualization tools transform raw blockchain data into meaningful insights by using graph-based maps and interactive dashboards. These tools make it easier for users to understand complex DeFi transactions.
Graph-based blockchain activity maps use a combination of nodes and edges to visually represent transaction flows across DeFi protocols. Nodes symbolize wallet addresses, smart contracts, or entities, while edges show the transactions connecting them. This method transforms raw blockchain data into visual stories, uncovering patterns and relationships that might otherwise go unnoticed.
Take Bitcoin, for example. Its network handles around seven transactions per second, adding up to about 500,000 transactions daily. Without visual tools, analyzing this sheer volume of data would be overwhelming, as discussed in our post Analyzing Liquidity Flows for Cross-Chain Arbitrage.
Color-coding enhances these graphs by adding a quick way to interpret transaction amounts. For instance:
This system helps users quickly identify significant fund movements or market-shifting events.
Graph-based maps are incredibly effective at revealing transaction patterns that raw data or spreadsheets just can't show. They can spotlight key players in the DeFi space, like whale wallets, and detect unusual activity that might indicate opportunities for arbitrage or potential security risks. These maps also allow users to trace the full journey of funds as they move through multiple protocols, offering a complete picture from deposit to destination.
Graph queries take things a step further by letting users explore deeper connections between blockchain elements - transactions, wallets, and smart contracts - all within one interface. This lets users analyze not just isolated transactions but entire ecosystems of activity.
To complement these maps, interactive dashboards provide even more dynamic ways to explore blockchain data.
Interactive dashboards turn static blockchain data into tools that users can explore and manipulate in real time. Unlike traditional reports, these dashboards allow users to zoom in on specific details, apply filters, and customize their views to align with their trading strategies.
Modern DeFi dashboards often feature tools like line charts, bar graphs, and heatmaps to present complex data in a way that's easier to understand. With the DeFi market valued at $13.61 billion in 2022 and projected to grow at a 46% annual rate through 2030, having accessible tools is becoming increasingly important for staying competitive.
Real-time processing is where these dashboards shine. They allow users to spot trends, price changes, or anomalies as they happen - avoiding delays that could cost them valuable opportunities.
This kind of live data visualization isn’t just helpful in DeFi. Industries using platforms like Tableau or Power BI have reported 30% productivity boosts within the first quarter of implementation. Live analytics solutions have also been shown to improve decision-making by up to 70%.
Dashboards also offer customizable elements like filters, buttons, and widgets, so users can tailor their interface to suit their needs. For example:
Security features are built into these dashboards too. Real-time transaction updates and clear error messages help users avoid costly mistakes. Some platforms even include gamified elements like leaderboards or achievement streaks to encourage regular use and boost engagement.
Together, these tools provide traders with both detailed and big-picture insights, making them essential for navigating the fast-paced world of DeFi.
Transaction visualization tools have reshaped how we interpret DeFi data, but they come with their own set of challenges. These hurdles not only limit their current capabilities but also open up avenues for new advancements in blockchain analytics.
Blockchain networks generate an overwhelming amount of data. For instance, Ethereum processes over 10 million transactions daily during peak times, requiring more than 21,000 GB for full node synchronization as of March 2025. Meanwhile, Solana's ledger had surpassed 150 TB by early 2024. This data surge highlights what’s known as the blockchain scalability trilemma: the difficulty in balancing decentralization, security, and scalability.
To put this into perspective, Bitcoin handles about 7 transactions per second (TPS) and Ethereum manages around 30 TPS, while Visa processes thousands of TPS. The gap underscores the scale of the problem.
"Scaling blockchain-based data storage systems is a multifaceted challenge that includes not only technical and architectural considerations but also legal and environmental ones."
Cross-chain applications, which operate across multiple blockchains, add another layer of complexity. These require synchronized indexing of data from different protocols, making real-time analysis a tough nut to crack. Unlike traditional databases that can clean, compress, or archive data, blockchain’s immutable nature makes such optimizations nearly impossible without undermining its core principles.
Extracting, transforming, and loading (ETL) blockchain data into structured formats also introduces delays and potential failures. When scalability bottlenecks arise, users face slower transactions, higher fees, and network congestion, all of which hinder real-time visualization.
Still, solutions are emerging. Techniques like parallel query execution and distributed SQL engines such as ClickHouse and Trino are helping improve scalability. Some platforms are adopting sampling methods to process smaller portions of data, significantly cutting down processing times while maintaining accuracy. Overcoming these hurdles is key to ensuring visualization tools remain efficient and reliable.
Maintaining accurate data in decentralized systems poses unique challenges. Blockchain data can suffer from duplication, flawed smart contracts, and incomplete transaction records. The anonymity of wallets further complicates accurate analytics.
Once blockchain data is transferred to a database for querying, it becomes vulnerable to traditional database risks. This creates a critical gap where immutable blockchain data can be corrupted during the visualization process.
"Organizations should be focused on implementing a data validation framework, starting with establishing a reconciliation process that cross-verifies data obtained from each respective blockchain and third-party vendors against internal transaction logs and ledger entries." - Bennett Moore, Blockchain and Digital Asset Innovation Leader, RSM US LLP
To address these challenges, robust validation frameworks are essential. Regular reconciliations can pinpoint and correct discrepancies, ensuring accurate data for financial reporting and trading decisions. A strong vendor management system is also crucial for verifying data acquisition, indexing, and error-handling processes.
Cross-validation with multiple sources has become a standard practice. Independent verification ensures that on-chain assets are accurately reflected, especially when third-party vendors lack SOC reports. Role-based permissions further enhance accountability and reduce unauthorized data manipulation.
As blockchain technology evolves, staying updated on new tools and practices is vital for maintaining data accuracy and compliance in financial reporting. Addressing these reliability challenges is laying the groundwork for innovations in DeFi transaction visualization.
The challenges of scalability and accuracy are driving breakthroughs in transaction visualization. One of the most promising advancements is the integration of artificial intelligence (AI) with blockchain technology. AI is being used to automate complex tasks and provide tailored user experiences based on individual trading behaviors. In fact, AI has already been shown to reduce fraud losses by 37%, highlighting its potential for improving DeFi analytics.
The global DeFi market is expected to grow from $26.16 billion in 2024 to $52.37 billion by 2032. This growth is fueling demand for advanced visualization tools. Cross-chain interoperability protocols are enabling seamless communication between blockchains, while zero-knowledge proofs (ZKPs) are enhancing privacy by allowing users to verify transactions without exposing sensitive details. For example, Celestia launched its mainnet in 2023 as the first modular data availability network, and Polygon 2.0 introduced a modular framework with integrated ZK technology.
Real-world asset tokenization is also expanding DeFi’s reach. BlackRock’s BUIDL Fund raised over $240 million on Ethereum by tokenizing U.S. treasuries, while HSBC introduced tokenized gold trading with 24/7 real-time settlement. These developments demand visualization tools capable of handling both traditional and digital asset flows.
Other innovations, like EigenLayer’s shared security model, allow users to re-stake ETH to secure modular services, potentially leading to more efficient and secure data processing for visualization tools.
"Traditional finance isn't just adopting crypto – it's being rebuilt around it." - Roomy Khan, Analyst and Public Speaker on Ethics and Compliance Issues
Institutional adoption is also shaping the future. The EU’s EBSI program, which supports eID and academic credential verification across member states, indicates a growing need for enterprise-grade visualization tools with built-in compliance features.
These advancements point to a future where transaction visualization tools are smarter, more secure, and equipped to handle the complexities of multi-chain environments - all while meeting the speed and accuracy demands of DeFi traders.
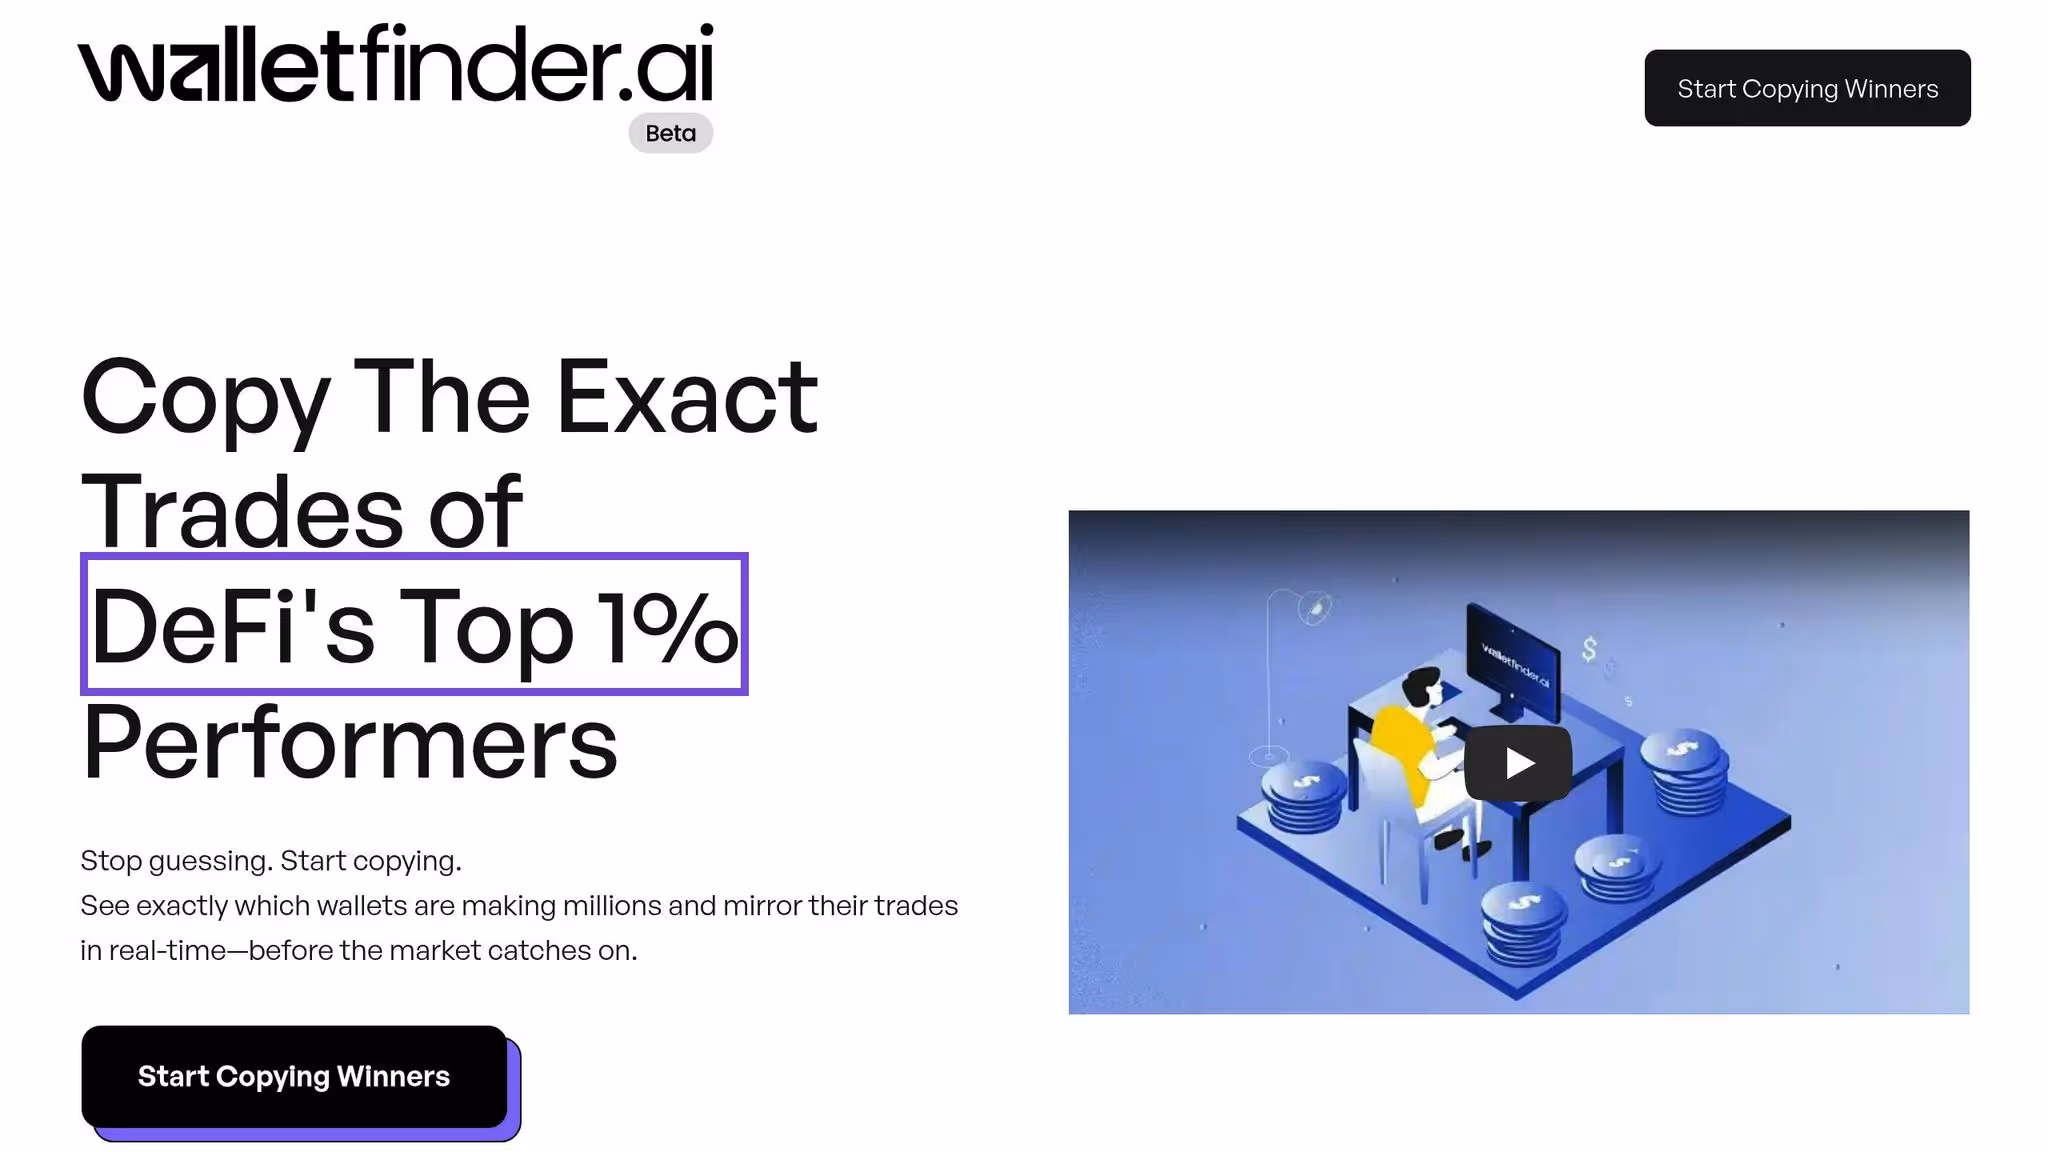
Wallet Finder.ai takes the overwhelming complexity of blockchain data and turns it into clear, actionable insights for traders. By simplifying wallet behavior, trade history, and performance analysis, the platform meets the growing need for advanced analytics tools. In 2022 alone, crypto trading saw a 39% increase, with around 425 million users by December. Wallet Finder.ai's visualization tools serve as the backbone for its powerful features, detailed below.
Wallet Finder.ai excels at presenting wallet performance data in an easy-to-understand way. Using graphs and charts, users can see profit trends, token holdings, and historical trade data. Features like sortable columns and unique metrics, such as all-time high (ATH) profits, make it simple to analyze performance. Plus, the platform updates this data in under two seconds. For those who need to dig deeper, data can be exported to Excel or CSV formats, making it easy to integrate with other tools.
The platform's alert system keeps users informed instantly. By combining rule-based and AI-driven monitoring, Wallet Finder.ai notifies traders of specific transactions, balance changes, or custom events as they happen. Enhanced filters make it easy to sort transaction data by size, type, or wallet count, turning visualization into a hands-on decision-making tool. This eliminates the need for constant manual monitoring. Additionally, Telegram alerts for wallet activity are on the way, ensuring users can stay updated on the go.
Custom watchlists give traders the ability to track high-performing wallets and get instant Telegram alerts for critical trades. Tailored dashboards provide a detailed view of historical performance and profitability metrics across multiple networks. This setup allows for quick comparisons and adaptable strategies. By combining real-time blockchain data with intuitive tools, Wallet Finder.ai makes it easier to spot top traders and identify token trends across Ethereum, Solana, Base, and other networks. This streamlined approach helps users uncover opportunities in decentralized finance.
Turning blockchain data into clear visuals makes it easier to understand and act on complex information. As DeFi grows - with Total Value Locked hitting $80.048 billion and over 21 million unique addresses trading in DeFi by September 2024 - a clear way to interpret data has become more important than ever.
Visualization tools bring clarity, allowing traders to quickly identify patterns, opportunities, and risks. With AI and machine learning increasingly integrated into analytics, spotting hidden trends and irregularities has become much simpler.
Take Wallet Finder.ai, for example. This tool uses real-time blockchain data with easy-to-use visual dashboards, helping traders track top wallets, set up instant alerts, and create custom watchlists. It’s a great example of how these tools can make strategic decision-making more efficient and reliable in the DeFi world.
The trust in these tools is evident - nine out of the ten leading crypto exchanges depend on blockchain analytics, which has played a role in freezing or recovering over $12.6 billion in illicit funds. This level of trust highlights how visualization technology not only benefits individual traders but also supports the security and growth of the entire DeFi ecosystem.
As cross-chain protocols open new trading possibilities and more blockchain networks come online, transaction visualization will remain a key tool for navigating the complexities of DeFi. Those who embrace these tools now will be better equipped to succeed as the landscape continues to evolve.
Transaction visualization tools play a key role in improving risk management within the DeFi space by providing clear, graphical representations of blockchain activity. These tools make it easier to follow fund movements, detect unusual or suspicious behavior, and pinpoint potential weak spots as they happen.
By breaking down complex transaction data into easy-to-understand visuals, users can act quickly and make smarter decisions. This reduces the chances of losses or falling victim to harmful activities, making these tools a must-have for navigating the ever-changing world of decentralized finance.
Scaling transaction visualization in DeFi isn’t without its hurdles. As blockchain activity increases, issues like network congestion, slower transaction speeds, higher fees, and limited storage capacity become more pronounced. These factors can make it tough to process and display large volumes of data in real time effectively.
On top of that, ensuring accurate and tamper-proof data adds another layer of complexity. Decentralized networks rely on real-time data integrity, but as the ecosystem grows, maintaining this becomes increasingly challenging. Problems like fragmented data sources, synchronization delays, and the sheer number of simultaneous transactions can lead to inaccuracies. Tackling these obstacles is essential for providing dependable insights in the DeFi space.
Visualization tools such as Wallet Finder.ai make blockchain data more accessible by transforming it into straightforward visuals. This helps DeFi traders and investors spot trends, study trading behaviors, and keep an eye on liquidity shifts with ease.
By breaking down complex information into simpler formats, these tools empower users to make smarter decisions, evaluate risks, and seize opportunities at the perfect moment. Features like wallet performance tracking and real-time alerts ensure traders can stay competitive in the ever-changing landscape of decentralized finance.
{"@context":"https://schema.org","@type":"FAQPage","mainEntity":[{"@type":"Question","name":"How can transaction visualization tools improve risk management in DeFi?","acceptedAnswer":{"@type":"Answer","text":"<p>Transaction visualization tools play a key role in improving risk management within the DeFi space by providing clear, graphical representations of blockchain activity. These tools make it easier to <strong>follow fund movements</strong>, <strong>detect unusual or suspicious behavior</strong>, and <strong>pinpoint potential weak spots</strong> as they happen.</p> <p>By breaking down complex transaction data into easy-to-understand visuals, users can act quickly and make smarter decisions. This reduces the chances of losses or falling victim to harmful activities, making these tools a must-have for navigating the ever-changing world of decentralized finance.</p>"}},{"@type":"Question","name":"What are the main challenges in scaling and ensuring data accuracy for transaction visualization in DeFi?","acceptedAnswer":{"@type":"Answer","text":"<h2 id=\"challenges-in-scaling-transaction-visualization-in-defi\" tabindex=\"-1\" class=\"sb h2-sbb-cls\">Challenges in Scaling Transaction Visualization in DeFi</h2> <p>Scaling transaction visualization in DeFi isn’t without its hurdles. As blockchain activity increases, issues like <strong>network congestion</strong>, <strong>slower transaction speeds</strong>, <strong>higher fees</strong>, and <strong>limited storage capacity</strong> become more pronounced. These factors can make it tough to process and display large volumes of data in real time effectively.</p> <p>On top of that, ensuring <strong>accurate and tamper-proof data</strong> adds another layer of complexity. Decentralized networks rely on real-time data integrity, but as the ecosystem grows, maintaining this becomes increasingly challenging. Problems like fragmented data sources, synchronization delays, and the sheer number of simultaneous transactions can lead to inaccuracies. Tackling these obstacles is essential for providing dependable insights in the DeFi space.</p>"}},{"@type":"Question","name":"How do visualization tools like Wallet Finder.ai help DeFi traders and investors make better decisions?","acceptedAnswer":{"@type":"Answer","text":"<p>Visualization tools such as <strong>Wallet Finder.ai</strong> make blockchain data more accessible by transforming it into straightforward visuals. This helps DeFi traders and investors spot trends, study trading behaviors, and keep an eye on liquidity shifts with ease.</p> <p>By breaking down complex information into simpler formats, these tools empower users to make smarter decisions, evaluate risks, and seize opportunities at the perfect moment. Features like wallet performance tracking and real-time alerts ensure traders can stay competitive in the ever-changing landscape of decentralized finance.</p>"}}]}

A premier DeFi analytics platform empowering traders to discover and analyze profitable blockchain wallets, trades and tokens.

