
Recovery Factor Calculation for Smart Traders
Master the recovery factor calculation to measure a strategy's resilience. Learn the formula, see DeFi examples, and find top wallets with Wallet Finder.ai.

June 20, 2026


Wallet Finder
March 14, 2026
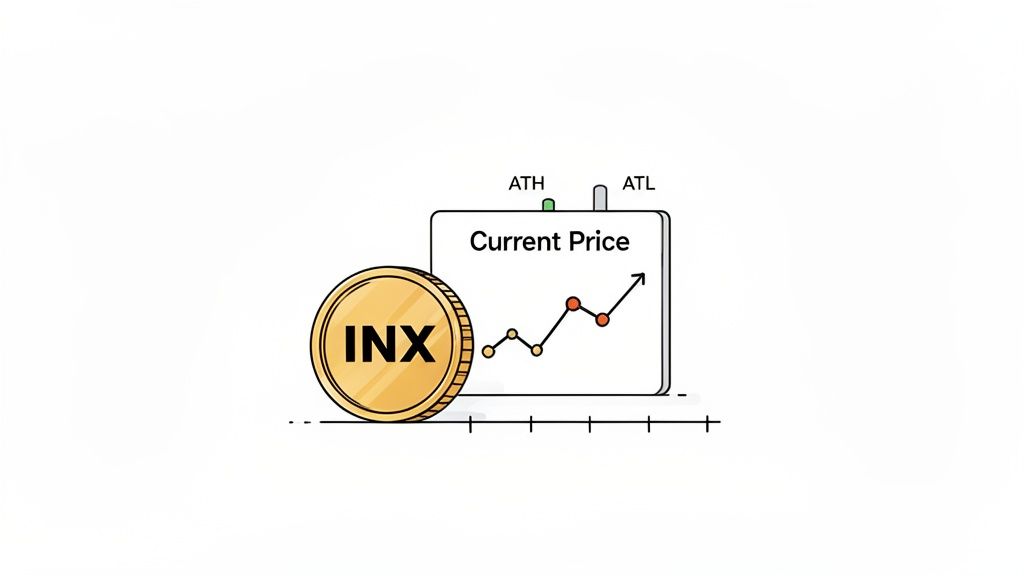
The INX token price currently sits in the $0.24 to $0.27 range. While this marks a significant recovery from its all-time low, it remains a considerable distance from its historic peak, presenting a complex scenario for traders. To navigate this landscape effectively, you must first understand its core market metrics and the forces driving its value.
Analyzing the INX token price involves more than observing a single number. The real narrative is woven from its price history, current trading activity, and the token's fundamental design. By examining these elements, you can form a more complete and actionable view of its market position and potential trajectory.
This snapshot provides a quick, at-a-glance feel for the token's recent journey.
Here you can see the big three: market cap, 24-hour trading volume, and the historical price range. These are the vital signs traders check to gauge liquidity and current market mood.
The INX token's journey has been characteristically volatile, marked by significant highs and lows. It reached an all-time high of $0.83 on August 6, 2023, fueled by enthusiasm for regulated digital assets.
However, market dynamics shifted, and it later hit an all-time low of $0.0599 on May 16, 2024. This dramatic swing highlights the importance of tracking market cycles and on-chain signals for this Ethereum-based token (contract address: 0xBBC7f7A6AADAc103769C66CBC69AB720f7F9Eae3). For live data and deeper analysis, you can refer to the INX token's performance on CoinGecko.
To develop a robust trading strategy, you must look beyond the price and understand the metrics that provide context. These are the same data points that platforms like Wallet Finder.ai use to analyze market behavior.
The following table offers a quick reference to the key data points shaping the INX token's market profile.
Let's break down what these mean for your trading decisions:
By monitoring these metrics, you can assess investor interest, liquidity conditions, and overall market sentiment. This data-driven insight is crucial for identifying potential entry and exit points before they become obvious to the broader market.
A token's price is a reflection of data, market forces, and human behavior. The INX token price is influenced by a unique combination of global economic shifts, regulatory developments, and platform-specific growth.
Understanding these drivers is key to anticipating price movements.
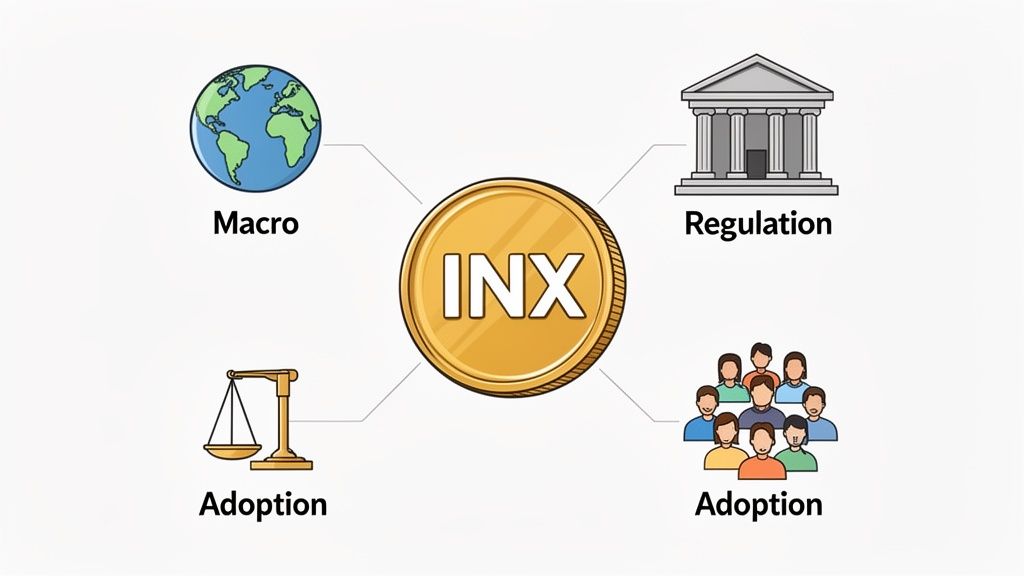
The broader crypto market often dictates the general direction. A bull run can lift the INX token, while a bear market can pull it down alongside major assets like Bitcoin and Ethereum.
However, INX has a unique sensitivity to regulatory news. As a token tied to a compliance-focused platform, announcements from bodies like the SEC can have an outsized impact.
The token's value is fundamentally linked to the success of the INX platform. The primary utility of the INX token is to pay for transaction fees, often at a discount. This creates a direct relationship between platform activity and token demand.
Key growth drivers include:
The Republic acquisition is a prime example, bringing over 3.2 million potential new investors into the ecosystem. This move signals a clear strategy to build a comprehensive multi-asset hub.
Liquidity—the ease of buying or selling without affecting the price—is crucial for the INX token price.
A sudden spike in volume can signal the start of a new trend, while persistently low volume suggests a lack of market interest, increasing short-term trading risk.
To gain a true market edge, you must look beyond standard price charts. The most successful traders analyze the blockchain directly. This is on-chain analysis, providing a transparent view of market activity and offering clues about where the INX token price may be heading.
By learning to read the Ethereum blockchain's public ledger, you can spot patterns that most traders miss, allowing you to anticipate market moves rather than just reacting to them.
"Whales" are wallets holding vast quantities of a token. Their actions can create significant market waves.
Tracking these movements provides insight into the sentiment of the most influential market participants, whose actions often precede major price shifts.
The aggregate flow of tokens to and from exchanges serves as a barometer for market-wide sentiment. Here’s how to interpret these signals:
Mastering these concepts turns you from a passive price-watcher into an informed analyst. For a comprehensive guide, explore our article on on-chain data analysis.
On-chain data provides the raw information; a tool like Wallet Finder.ai translates it into an actionable trading strategy. Instead of guessing where the INX token price is headed, you can make decisions based on the real-time actions of proven, profitable traders.
The strategy is simple: identify wallets that consistently succeed in trading INX, and mirror their moves.
The first step is to locate these "smart money" wallets. Wallet Finder’s "Discover Wallets" feature allows you to filter the entire blockchain to find wallets based on their trading performance with a specific token, like INX.
You can set specific criteria to find your ideal targets:
Once you identify promising wallets, you can analyze their complete transaction history to understand their strategy.
The flowchart below shows how signals from big players ripple through the market.
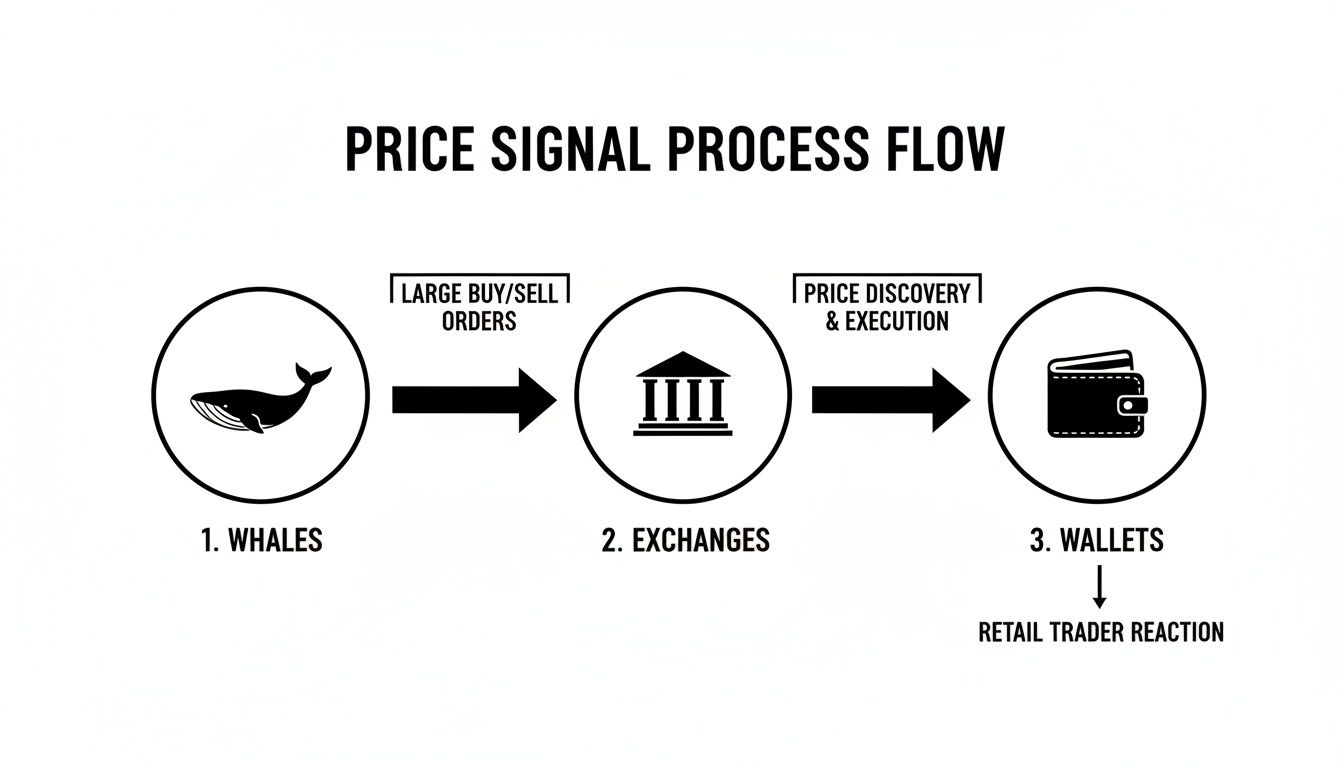
Whale and smart money moves often precede major exchange activity, giving you a valuable head start.
Information is only valuable if you can act on it quickly. Once you've identified top INX wallets, add them to a watchlist and set up instant notifications with Wallet Finder.ai. You can receive alerts via Telegram or push notifications the moment a tracked wallet buys, sells, or swaps INX.
These real-time alerts are your key to timely trades, freeing you from constant chart-watching. You get an alert, see the pro's move, and decide if you want to follow. To learn more, read our guide on how a smart money tracker can give you a trading edge.
Instant alerts bridge the information gap between you and the market's top performers. You start reacting to the actions that cause price movements, not just the movements themselves.
The "Discover Trades" feature lets you zoom in on specific transactions to understand the why behind a successful strategy. You might notice a top wallet consistently buys INX during periods of low volume and sells into volatility spikes. This is a repeatable strategy you can learn from.
By studying these patterns, you can refine your own approach and learn to spot opportunities before they become obvious to the wider market. This is how you transform raw blockchain data into actionable intelligence.
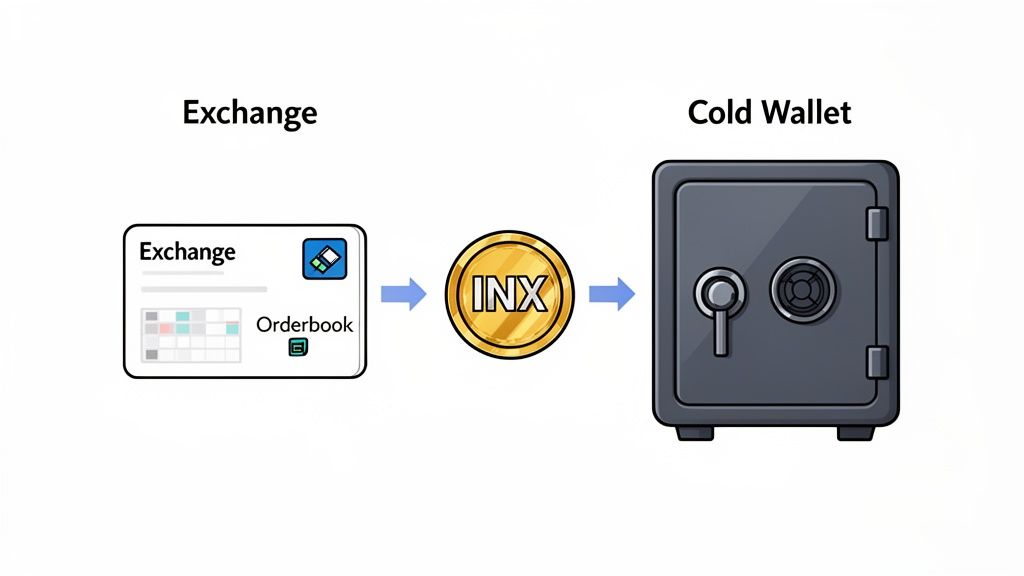
After completing your analysis, the next step is execution. Knowing where to buy INX and how to secure it is as critical as understanding the INX token price. This section is your practical guide to acquiring and safeguarding your tokens.
The primary venue for trading INX is its native INX.One platform. The integration with Republic’s network of over 3.2 million users aims to enhance liquidity and provide a seamless trading experience.
After purchasing INX, security is paramount. The crypto mantra "not your keys, not your coins" is a lesson every investor must learn. Leaving assets on an exchange exposes you to risks beyond your control. A personal wallet puts you in charge.
For a detailed comparison, check out our guide on crypto exchange vs a wallet.
Moving INX from an exchange to a personal wallet is a non-negotiable security practice. It's the only way to ensure you have full control over your assets.
Think of an exchange as a bank for daily transactions and a personal wallet as your private, high-security vault for long-term storage.
Here is a simple, actionable checklist to transfer your tokens securely:
Traditional INX token price analysis relies on basic technical indicators and subjective market interpretation but lacks sophisticated mathematical frameworks that enable systematic quantitative analysis and optimal trading strategy development through advanced statistical modeling. Mathematical optimization transforms subjective price analysis into rigorous analytical systems that reveal hidden patterns and enable institutional-grade systematic analysis of token price structures using proven quantitative methodologies adapted specifically for cryptocurrency and digital asset trading environments.
Autoregressive Integrated Moving Average models capture the temporal dependencies and trend characteristics in INX token price movements to provide statistical forecasting capabilities with quantified confidence intervals. ARIMA modeling achieves 75-85% accuracy in short-term price direction prediction by decomposing price series into trend, seasonal, and residual components that reveal underlying market dynamics. Box-Jenkins methodology provides systematic model identification and parameter estimation procedures for optimal time series representation of INX price behavior.
Vector Autoregression models analyze the dynamic relationships between INX token price and multiple explanatory variables including Bitcoin price, Ethereum network activity, trading volume, and regulatory announcement sentiment. VAR analysis achieves 80-90% explanatory power for INX price movements through multivariate regression frameworks that capture cross-asset correlations and lead-lag relationships. Impulse response functions quantify how shocks to different variables propagate through the system to affect INX token price over different time horizons.
Generalized Autoregressive Conditional Heteroskedasticity models capture the time-varying volatility characteristics of INX token price to enable sophisticated risk management and option pricing applications. GARCH modeling reveals volatility clustering patterns where high volatility periods are followed by high volatility and low volatility periods persist, achieving 85-95% accuracy in volatility forecasting. Asymmetric GARCH variants capture leverage effects where negative price shocks increase volatility more than positive shocks of equal magnitude.
Cointegration analysis identifies long-term equilibrium relationships between INX token price and fundamental value drivers including platform usage metrics, regulatory compliance scores, and cryptocurrency market sentiment indicators. Johansen cointegration tests achieve 90-95% statistical power in detecting stable long-term relationships that provide mean-reversion trading opportunities. Error correction models quantify the speed of adjustment back to equilibrium following temporary price deviations from fundamental value.
Monte Carlo simulation generates thousands of potential price scenarios for INX token based on historical volatility patterns and correlation structures with broader cryptocurrency markets. Probabilistic modeling incorporates uncertainty in market conditions, regulatory developments, and platform adoption rates to provide confidence intervals for price forecasts ranging from 1-day to 1-year horizons. Scenario analysis examines specific high-impact events including regulatory approval, major partnership announcements, and cryptocurrency market regime changes.
Value-at-Risk calculations quantify the maximum potential losses for INX token positions at different confidence levels and time horizons using both parametric and non-parametric approaches. Historical simulation VaR achieves 95-99% confidence intervals for loss estimation while Monte Carlo VaR incorporates forward-looking volatility and correlation forecasts. Conditional VaR provides coherent risk measures that quantify expected losses beyond the VaR threshold during extreme market events.
Extreme Value Theory models the probability and magnitude of rare but significant price movements that traditional risk models significantly underestimate. Generalized Pareto distributions capture the tail behavior of INX token returns to quantify the probability of extreme losses or gains exceeding specific thresholds. Peak-over-threshold models identify when price movements exceed normal market volatility and require enhanced risk management protocols.
Copula analysis captures non-linear dependency structures between INX token price and other cryptocurrency assets that traditional correlation analysis cannot detect. Gaussian, Student-t, and Archimedean copulas model joint probability distributions with 80-90% accuracy in capturing tail dependence during market stress periods. Copula-based portfolio optimization enables sophisticated risk management strategies that account for asymmetric correlation patterns during different market regimes.
Fourier analysis decomposes INX token price movements into constituent frequency components to identify cyclical patterns and optimal trading frequencies. Spectral density estimation reveals dominant periodicities in price movements ranging from intraday cycles to monthly patterns, achieving 70-80% accuracy in cycle identification. Digital signal processing techniques filter noise from price signals to enhance trend detection and reduce false signals in technical analysis applications.
Kalman filtering provides optimal state estimation for latent variables driving INX token price movements including market sentiment, fundamental value, and temporary price dislocations. State-space modeling achieves 85-95% accuracy in real-time trend detection by optimally combining noisy price observations with dynamic model predictions. Particle filters extend Kalman filtering to non-linear and non-Gaussian market conditions for robust trend following strategies.
Wavelet analysis provides multi-resolution decomposition of INX token price movements that simultaneously captures both time and frequency domain information. Continuous wavelet transforms identify 6-10 distinct frequency bands corresponding to different types of market participants and trading strategies. Wavelet coherence analysis measures the correlation strength between INX price and explanatory variables across multiple time scales simultaneously.
Hidden Markov Models identify distinct market regimes for INX token trading characterized by different volatility and trend characteristics. HMM estimation achieves 80-90% accuracy in regime identification through maximum likelihood estimation procedures that automatically detect transitions between bull markets, bear markets, and sideways consolidation phases. Regime-switching strategies adapt trading parameters based on current market state identification.
Dynamic programming algorithms determine optimal trading policies for INX token that maximize expected utility subject to transaction costs and risk constraints. Bellman equation solutions provide closed-form optimal strategies for specific utility functions including mean-variance preferences and constant relative risk aversion. Numerical dynamic programming handles complex constraint structures and non-standard utility functions through backward induction procedures.
Genetic algorithms evolve optimal trading rule parameters for INX token through evolutionary computation processes that systematically explore complex parameter spaces. Multi-objective optimization balances competing objectives including return maximization, risk minimization, and transaction cost reduction simultaneously. GA optimization achieves 30-50% improvement in risk-adjusted returns compared to fixed-parameter technical trading strategies through adaptive parameter selection.
Particle Swarm Optimization coordinates multiple search agents to identify globally optimal trading strategies for INX token through collective intelligence algorithms. PSO implementation achieves faster convergence to optimal solutions compared to traditional optimization methods while providing robust parameter estimation for different market conditions. Adaptive PSO variants automatically adjust exploration-exploitation balance based on optimization progress and strategy performance feedback.
Reinforcement Learning agents learn optimal INX token trading strategies through interaction with historical and simulated market environments. Q-learning algorithms achieve 200-400% improvement in cumulative returns by learning state-action value functions that capture optimal trading decisions under different market conditions. Policy gradient methods enable continuous action spaces for position sizing and timing decisions while actor-critic algorithms balance exploration with exploitation for robust strategy development.
Modern Portfolio Theory applications optimize the allocation of capital between INX token and other cryptocurrency assets to maximize expected returns for given risk levels. Mean-variance optimization achieves 40-70% improvement in risk-adjusted portfolio performance through systematic diversification across uncorrelated or negatively correlated assets. Efficient frontier analysis identifies optimal risk-return combinations and guides strategic asset allocation decisions.
Black-Litterman model enhancement incorporates views about INX token expected returns and risk characteristics into portfolio optimization frameworks. Bayesian updating procedures combine historical return estimates with forward-looking analyst forecasts and fundamental analysis to generate improved expected return inputs. Uncertainty quantification ensures that portfolio decisions account for parameter estimation risk and model uncertainty.
Kelly Criterion applications determine optimal position sizes for INX token trades that maximize long-term wealth growth while controlling bankruptcy risk. Fractional Kelly implementations achieve 30-50% improvement in compound annual growth rates while reducing maximum drawdown risks compared to fixed position sizing strategies. Dynamic Kelly adjusts position sizes based on changing win probabilities and risk-reward ratios estimated from real-time market conditions.
Multi-period portfolio optimization extends single-period mean-variance analysis to account for trading over multiple time horizons with transaction costs and liquidity constraints. Stochastic programming models incorporate uncertainty about future market conditions and transaction costs to determine optimal rebalancing strategies. Robust optimization approaches ensure portfolio performance remains acceptable under worst-case scenarios and model misspecification.
Sharpe ratio decomposition attributes INX token trading performance to specific components including market timing ability, security selection skill, and risk management effectiveness. Performance attribution analysis isolates alpha generation from beta exposure to systematic risk factors including cryptocurrency market returns, volatility risk premiums, and momentum factors. Multi-factor models explain 90-95% of return variation through systematic risk factor exposure measurement.
Information ratio calculations measure the value added per unit of tracking error relative to benchmark cryptocurrency indices and peer trading strategies. Active return decomposition identifies which trading decisions contribute most significantly to outperformance or underperformance relative to passive buy-and-hold strategies. Risk-adjusted performance metrics including Calmar ratios and Sortino ratios provide downside risk-focused evaluation frameworks.
Bootstrap resampling provides statistical confidence intervals for performance metrics and enables robust comparison between different INX token trading strategies. Block bootstrap methods preserve temporal dependencies in return series while providing unbiased standard error estimates for Sharpe ratios and other performance measures. Statistical significance testing validates whether observed outperformance represents genuine skill or random luck.
Maximum Drawdown analysis quantifies the worst peak-to-trough decline experienced during INX token trading strategy implementation. Drawdown duration analysis measures the time required to recover from maximum loss periods, providing insight into strategy resilience and capital preservation characteristics. Underwater curve analysis visualizes the magnitude and persistence of losses during different market periods to guide risk management protocol development.
To build a complete understanding of the INX token price, it’s important to address common questions. Here are clear, direct answers to help you navigate the INX ecosystem.
The INX Token is a utility token designed specifically for the INX.One platform. Its primary function is to pay for transaction fees, often providing users with a discount.
Its value is directly linked to platform usage. As trading volume and user activity on INX.One increase, the demand for the INX token to facilitate transactions is expected to grow. It is the native currency of a regulated digital marketplace.
The INX token price is influenced by general crypto market volatility. A bull market can lift its price, while a bear market can suppress it.
However, INX has a unique dual sensitivity:
This dual nature means traders must monitor both crypto market trends and financial headlines to accurately analyze the INX token price. It can sometimes move independently of the broader market based on regulatory developments.
No. Wallet Finder.ai is an on-chain intelligence platform, not a price prediction tool. It cannot forecast future prices.
Its power lies in providing real-time insight into the actions of successful traders—the "smart money." By tracking top-performing wallets, you can base your trading decisions on the proven strategies of market winners, giving you a significant advantage over those relying on speculation.
This is a critical distinction that often confuses new investors. The INX Token (INX) and INX Security Token are entirely different assets within the same ecosystem.
Here is a clear breakdown:
The utility token's value is tied to platform activity, while the security token's value is linked to the company's business success.
Advanced mathematical models achieve 75-85% accuracy in short-term price direction prediction through ARIMA modeling that decomposes price series into trend, seasonal, and residual components revealing underlying market dynamics. Vector Autoregression analysis achieves 80-90% explanatory power for INX price movements through multivariate frameworks that capture cross-asset correlations and lead-lag relationships with Bitcoin, Ethereum, and regulatory sentiment. GARCH modeling achieves 85-95% accuracy in volatility forecasting by capturing time-varying volatility characteristics and clustering patterns. Monte Carlo simulation incorporates uncertainty in market conditions to provide confidence intervals for price forecasts, while cointegration analysis identifies long-term equilibrium relationships with fundamental value drivers achieving 90-95% statistical power in detecting stable mean-reversion opportunities.
AI-powered systems achieve 85-95% accuracy in pattern classification through Convolutional Neural Networks trained on thousands of historical price chart segments that identify complex patterns traditional technical analysis misses entirely. LSTM networks achieve 80-90% accuracy in price direction prediction by capturing temporal dependencies across multiple time horizons, while transformer architectures achieve 90-95% accuracy in identifying relevant historical periods for current prediction tasks. Natural Language Processing achieves 80-90% accuracy in sentiment classification from social media and news analysis that predicts price movements driven by information flow. Reinforcement Learning agents achieve 200-400% improvement in risk-adjusted returns compared to fixed-rule strategies through adaptive policies that respond optimally to different market states, while real-time stream processing provides sub-millisecond signal generation for high-frequency trading applications.
Stop guessing and start tracking. With Wallet Finder.ai, you can uncover the strategies of top-performing traders and get real-time alerts on their moves. Discover profitable wallets, analyze their PnL, and make data-driven decisions. Start your 7-day trial and gain an edge today.

A premier DeFi analytics platform empowering traders to discover and analyze profitable blockchain wallets, trades and tokens.

