
Recovery Factor Calculation for Smart Traders
Master the recovery factor calculation to measure a strategy's resilience. Learn the formula, see DeFi examples, and find top wallets with Wallet Finder.ai.

June 20, 2026


Wallet Finder
January 13, 2026

Ever felt like you're winning in crypto, only to check your balance and realize you're just treading water? You're not alone. A profit calculator crypto is the tool that cuts through the noise and shows you the unvarnished truth about your gains and losses. It’s about moving past the wishful thinking and getting down to the real numbers.
This guide will show you how these calculators are the essential first step to making smarter, data-driven trading decisions.
Staring at a portfolio of green candles can feel great, but does it mean you’re actually profitable? The crypto market is a whirlwind of fluctuating prices, sneaky fees, and endless chatter. A good profit calculator crypto is your financial GPS in this storm, revealing your actual performance.
Think of it as the difference between hoping you're making money and knowing your exact numbers. We'll walk through everything from basic Profit and Loss (PnL) to your true Return on Investment (ROI), shining a light on the hidden costs that can quietly eat away at your gains.
Without precise numbers, it's dangerously easy to misjudge your success. You might see a token's price pop and assume it’s a win, but what about the trading fees? The network gas costs? The slippage on that DEX swap? These little things can quickly turn a paper profit into a real-world loss.
This is where the pros separate themselves from the amateurs. They track everything.
And now, automation is leveling the playing field. By pulling data directly from the blockchain, modern tools can show you exactly how top-performing wallets consistently crush the market. It’s no secret that elite traders on Ethereum and Solana average 5x higher ROI than the typical retail holder, often hitting 200-500% annually.
For a little perspective, a $10,000 investment in Solana at its early 2023 low, sold at its 2024 high, could have netted a $59,500 profit after fees. That's the kind of scenario these tools help you model and understand. You can dig deeper into these kinds of calculations over at Koinly.
The screenshot below from Wallet Finder.ai shows how a clean dashboard brings all these crucial metrics together.
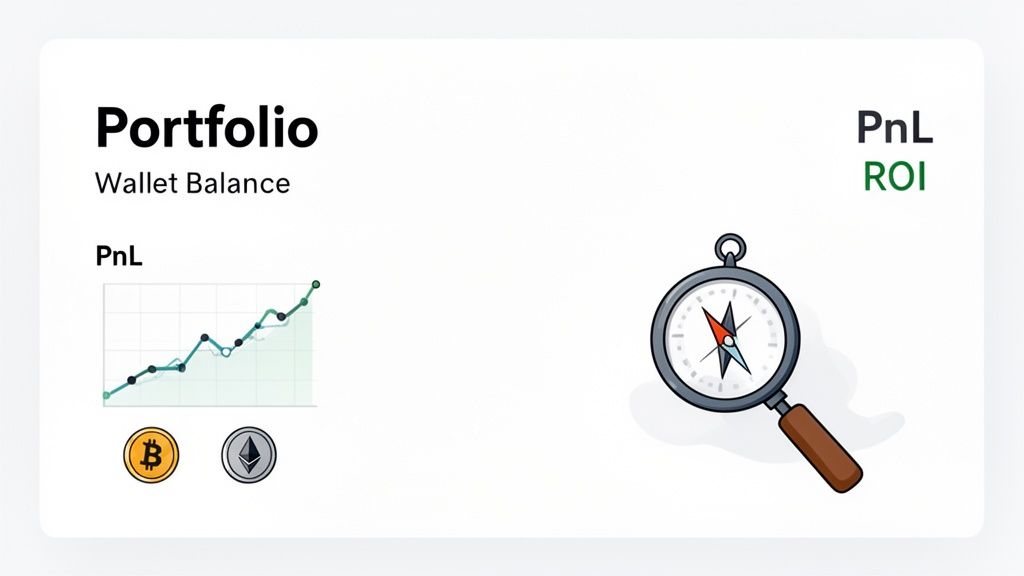
This kind of visual breakdown instantly shows your PnL, ROI, and overall balance, turning a mess of raw data into insights you can actually use.
To get the most out of any crypto profit calculator, you have to understand what’s going on under the hood. The core formulas are actually pretty simple, but really getting them is what separates traders who get lucky from those who stay profitable. Let's break down the essential math, starting with the absolute basics.
At the end of the day, trading is all about one thing: buying low and selling high. The first formula, Gross PnL (Profit and Loss), measures this in its purest form. It completely ignores all the pesky costs and just answers one question: "How much did my crypto's value change from when I bought it to when I sold it?"
The math for Gross PnL is as straightforward as it gets. You just take the total value of your sale and subtract what you paid for it.
Gross PnL = (Sell Price - Buy Price) * QuantityLet's say you bought 1 ETH at $3,000 and later sold it for $3,500. Your Gross PnL is a cool $500. That number feels great, but it’s not the whole story. Think of it as the starting line, not the finish.
While Gross PnL gives you a quick snapshot, Net PnL is the number that actually matters. This is your real, take-home profit—the cash that ends up back in your wallet after you’ve paid all the bills. Forgetting these costs is a classic rookie mistake that can make you think you're crushing it when you're barely breaking even.
Net PnL takes your gross profit and subtracts all the necessary evils like trading fees, network (gas) fees, and slippage.
Net PnL = Gross PnL - Total Costs (Fees + Slippage + Gas)Let’s go back to our ETH trade. Imagine you paid a $10 trading fee to the exchange and a $5 gas fee to the network. Your total costs add up to $15. So, your Net PnL is really $500 (Gross PnL) - $15 (Costs) = $485. That's your actual profit.
A trader's success isn't defined by their gross gains but by their ability to manage and minimize the costs that chip away at those gains. Net PnL is the ultimate scorecard.
Finally, we have Return on Investment (ROI). Net PnL tells you how much money you made, but ROI tells you how efficiently you made it. It shows your net profit as a percentage of your initial investment, which is the perfect way to compare how different trades performed.
ROI = (Net PnL / Initial Investment) * 100For our ETH trade, the initial investment was $3,000. With a Net PnL of $485, the ROI calculation is ($485 / $3,000) * 100, which comes out to 16.17%. That single number tells you exactly how hard your money worked for you on that trade.
To make these concepts even clearer, here’s a quick-reference table with all the key formulas in one place. Bookmark this—it's the foundation of all profitable trading.
With these three formulas, you have everything you need to measure the outcome of any trade. Mastering them helps you move beyond just seeing green or red and start truly understanding your performance as a trader.
All the theory and formulas are great, but nothing beats seeing them in action. Let's get practical and walk through a couple of real-world trading examples. Once you see how the numbers flow, you'll feel much more confident applying these calculations to your own crypto portfolio.
We'll kick things off with a simple trade on a centralized exchange before diving into a slightly messier (and more realistic) DeFi scenario.
Let's say you decide to buy 0.5 ETH on a big exchange. At the time of your purchase, the price is $3,000 per ETH. A few weeks go by, ETH rallies to $3,400, and you decide it's time to take some profit.
Here’s how to break down the math using the formulas we've covered:
Calculate Your Initial Investment: This is just the total cash you put down to get the crypto.
Calculate Gross Proceeds: This is what you get back from the sale before the exchange takes its cut.
Figure Out the Gross PnL: Super simple—just subtract your initial cost from what you got back.
Factor in Fees for Net PnL: Centralized exchanges always have trading fees. Let's assume a pretty standard 0.1% fee on both your buy and sell orders.
Find Your ROI: Now for the big one—how well did your money actually perform?
This visual flow really clarifies the journey from a basic gross profit figure to your final, real-world ROI.
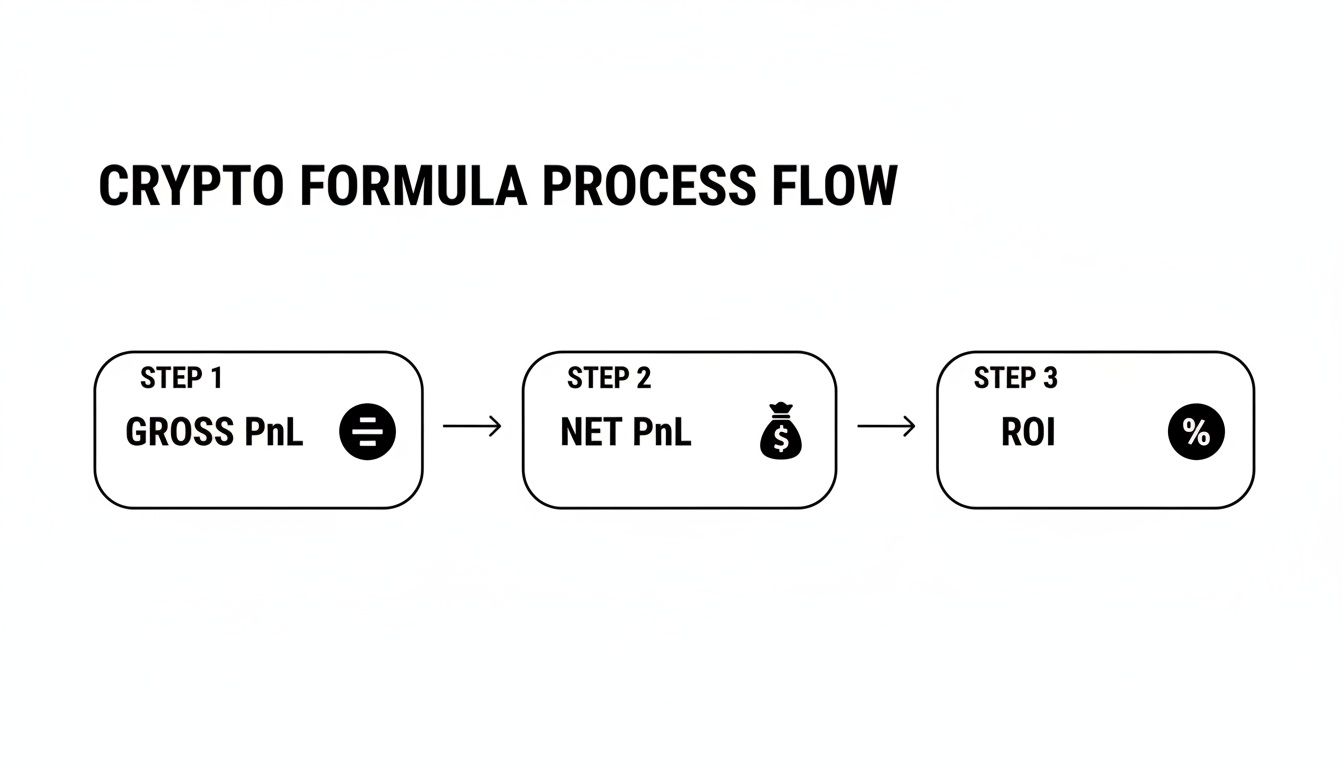
As you can see, Net PnL is that critical middle step. It’s where you convert a simple price change into a true measure of profit before you can fairly judge your investment's efficiency.
Trading on a decentralized exchange (DEX) throws a few more curveballs into the mix, namely gas fees and slippage. Let's imagine you ape into a new token, buying 1,000,000 MEME at $0.0005 each on a popular DEX running on Ethereum.
Initial Investment & Gas: Your tokens cost $500 (1,000,000 * $0.0005). But you also had to pay a $25 gas fee to get the transaction through.
Sale & Slippage: The token pumps! The price doubles to $0.001, and you hit the sell button. Your position is now worth $1,000 on paper. But due to low liquidity on the DEX, you get hit with 2% slippage, meaning you only receive $980. The gas fee to sell costs you another $30.
Final Net PnL & ROI:
This example makes it crystal clear how things like gas and slippage can take a serious bite out of your final profit. That's why having a solid profit calculator for crypto is absolutely essential for anyone serious about trading in DeFi.
Seeing a big green PnL number next to your trade feels great, but it’s often just the tip of the iceberg. True profitability only comes to light after you subtract all the little costs that quietly eat away at your returns.
Ignoring these expenses is like trying to drive with the handbrake on. Your gross profit is a nice starting point, but your net profit tells the real story. Here's a checklist of common costs to track for every trade:
Every single time you buy or sell on a centralized exchange, you're paying a fee. They often look tiny—fractions of a percent—but if you're an active trader, they stack up faster than you can imagine. Most exchanges run on a maker-taker fee model.
Then there's slippage, another sneaky cost that loves to hang out on decentralized exchanges (DEXs). Slippage is simply the difference between the price you thought you were getting and the price you actually paid. For a low-volume memecoin, that gap can be huge, easily flipping what looked like a winning trade into a loser.
When you’re trading on-chain, especially on a network like Ethereum, you have to pay the piper. Every transaction requires a network fee, better known as a gas fee, to compensate the validators who process and secure your trade.
Gas fees are not static. They can swing wildly depending on how congested the network is. Trying to get into a hyped-up token launch? Prepare for war, because gas fees can spike into the stratosphere. A single swap on Ethereum can easily bounce between $20 to over $100 during peak times.
Want a deeper look into taming these costs? Check out our guide on how to save on Ethereum gas fees for short-term trades.
Understanding and minimizing transaction costs is a skill in itself. A trader who saves 1% on fees and slippage across a hundred trades is significantly more profitable than one who ignores them.
Finally, we have the two elephants in the room: taxes and tokenomics.
Let's start with taxes. In many countries, your crypto profits are fair game for capital gains tax. That means a chunk of your hard-won net profit is earmarked for the government. If you aren't meticulously tracking every single trade—dates, costs, proceeds—you're setting yourself up for a massive headache come tax season.
Beyond the direct costs, the very design of a token—its tokenomics—can make or break your investment. Market cap is everything. When Bitcoin surged to a $1.8 trillion market cap, it delivered an insane 15,000x return for the earliest believers. Likewise, tracking the wallets that rode Solana's 7,000% gain shows how top traders can average a 350% ROI.
But it cuts both ways. Things like scheduled token unlocks can flood the market and crush prices. Just look at LUNA, whose market cap imploded by 99% in 2022 thanks to hyperinflation. A comprehensive profit calculation has to consider the whole picture, not just the buy and sell price.
Let's be honest: manually calculating the profit for every single trade is a nightmare. It’s not just a tedious slog through transaction histories; it’s also a process where one tiny mistake can throw off your entire performance picture. This is exactly why automated on-chain analysis has become a game-changer, turning profit tracking from a chore into a powerful strategic tool.
Instead of getting lost in spreadsheets, you can now use tools that do all the heavy lifting for you. Platforms like Wallet Finder.ai connect directly to the public data firehose of blockchains like Ethereum and Solana to automate your PnL calculations in real-time.
The big difference here is transparency. Unlike the private, walled-off records kept by a centralized exchange, on-chain data is a public, unchangeable ledger. Every single transaction is permanently etched into the blockchain. This creates an undisputed source of truth for a wallet's entire trading history.
Automated tools plug into this data and instantly crunch all the key performance indicators you'd ever want to see, including:
This level of automation essentially turns the entire crypto market into an open book of trading case studies, ready for you to read.
The dashboard below is a great example of how Wallet Finder.ai takes all that complex on-chain data and presents it in a clean, actionable format.
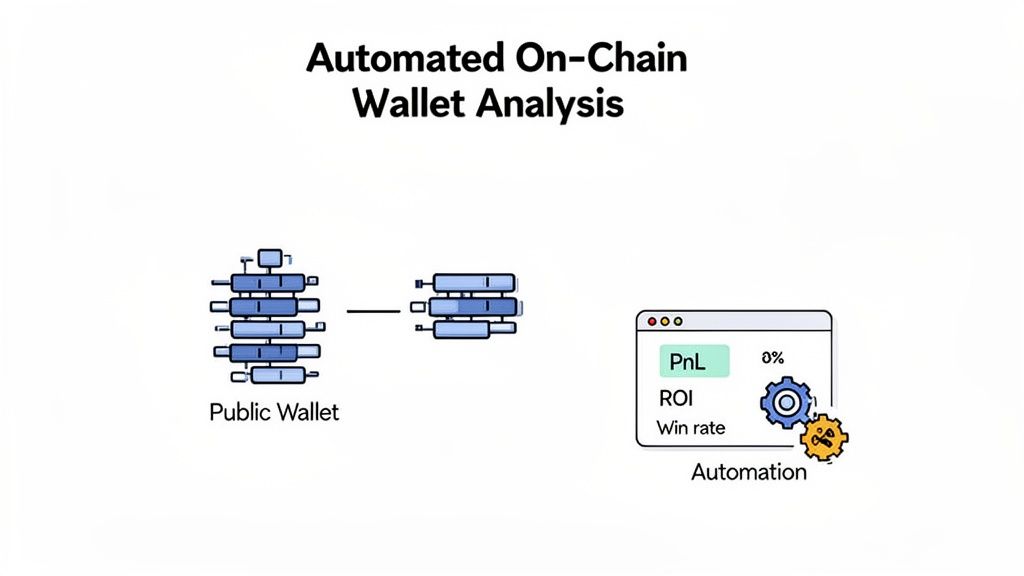
With a view like this, you can see a wallet's performance at a glance. It makes spotting genuinely skilled traders and understanding the strategies behind their success incredibly straightforward.
The true magic of an automated profit calculator crypto isn't just about tracking your own bags—it’s about learning from the best in the game. By digging into the complete performance history of any public wallet, you can uncover patterns, spot promising tokens before they start trending, and learn from the wins and losses of others.
We all know the crypto market's history is full of wild swings. A $1,000 investment in Bitcoin back in 2010 would be worth millions today, which works out to a mind-boggling compound annual growth rate of over 200%. But let's not forget that same asset took a 70% haircut in 2022. This volatility is precisely why modern trackers are so crucial; they help you find wallets that actually navigated these chaotic cycles successfully, like the Ethereum whales who managed to average 150% ROI during the 2021 bull run.
By automating on-chain analysis, you stop being a passive market observer and become an active researcher, using real-world data to refine your own trading strategy.
This approach effectively turns the blockchain into your personal trading mentor. To really make this work for you, it’s important to follow some key guidelines. For a deeper dive, check out our guide on the best practices for wallet-based profit tracking to make sure your analysis is both sharp and insightful.
Even after breaking down the process, a few specific questions always seem to come up. It's totally normal. Nailing down your exact crypto profit can feel tricky at first, so let's clear up some of the most common points of confusion.
My goal here is to make sure you're completely comfortable using a profit calculator crypto tool for your own trades.
A calculator is only as smart as the numbers you feed it. If you're punching in data manually, its accuracy is entirely on you. You need to get the buy price, sell price, and every single fee exactly right. Miss one little gas fee, and your final number is wrong.
Automated on-chain tools, however, are incredibly precise for DeFi activity. They pull data straight from the blockchain, which is an immutable, public record. The only catch is they can't see what you do on centralized exchanges like Coinbase or Binance, so you might need to add that data in yourself.
Yes. 100% of the time. No exceptions.
Gas fees aren't optional—they're a direct cost of transacting on a blockchain. If you don't subtract them from your gross profit, you’re looking at a fantasy number, not your real performance.
Think about it: if a trade makes you $50 but costs $60 in gas, you didn't make a profit. You just paid $10 for the experience. Always, always subtract gas fees to find your true net profit. This is especially crucial on high-fee networks like Ethereum.
Your real profit is what's left after the network takes its cut. Ignoring gas fees is like celebrating your salary before income tax is deducted—it’s not a real number.
Absolutely, they are a massive help for getting your tax prep in order. A good profit calculator gives you a clean, detailed record of all your trading activity—dates, cost basis, sale proceeds, the works. This is the raw data you need to figure out your capital gains or losses.
However, these tools are not a substitute for a tax professional. Tax laws are a minefield, they change, and they vary depending on where you live. Use the data from your calculator to have an intelligent conversation with a qualified accountant who actually understands crypto.
This one trips up a lot of people, but it’s pretty simple when you break it down.
You really need both. PnL tells you the size of your win, while ROI tells you the quality of it.
Ready to stop guessing and start analyzing with precision? Wallet Finder.ai automates on-chain PnL and ROI calculations, helping you discover and learn from the most profitable traders in DeFi. Find your edge today with Wallet Finder.ai.

A premier DeFi analytics platform empowering traders to discover and analyze profitable blockchain wallets, trades and tokens.

