
Recovery Factor Calculation for Smart Traders
Master the recovery factor calculation to measure a strategy's resilience. Learn the formula, see DeFi examples, and find top wallets with Wallet Finder.ai.

June 20, 2026


Wallet Finder
March 5, 2026
In the volatile world of cryptocurrency, identifying the right time to invest in altcoins and meme coins is a skill that separates the strategic traders from those who succumb to hype. The idea of jumping into one of the 40,000 to 50,000 new meme coins launched every day and finding that one gem with explosive potential may sound daunting - but it’s achievable, provided you have the right tools and strategies. This article dives into how to determine where we are in the crypto market cycle, how to leverage data to pinpoint profitable wallets, and why timing is everything when it comes to altcoin investing.
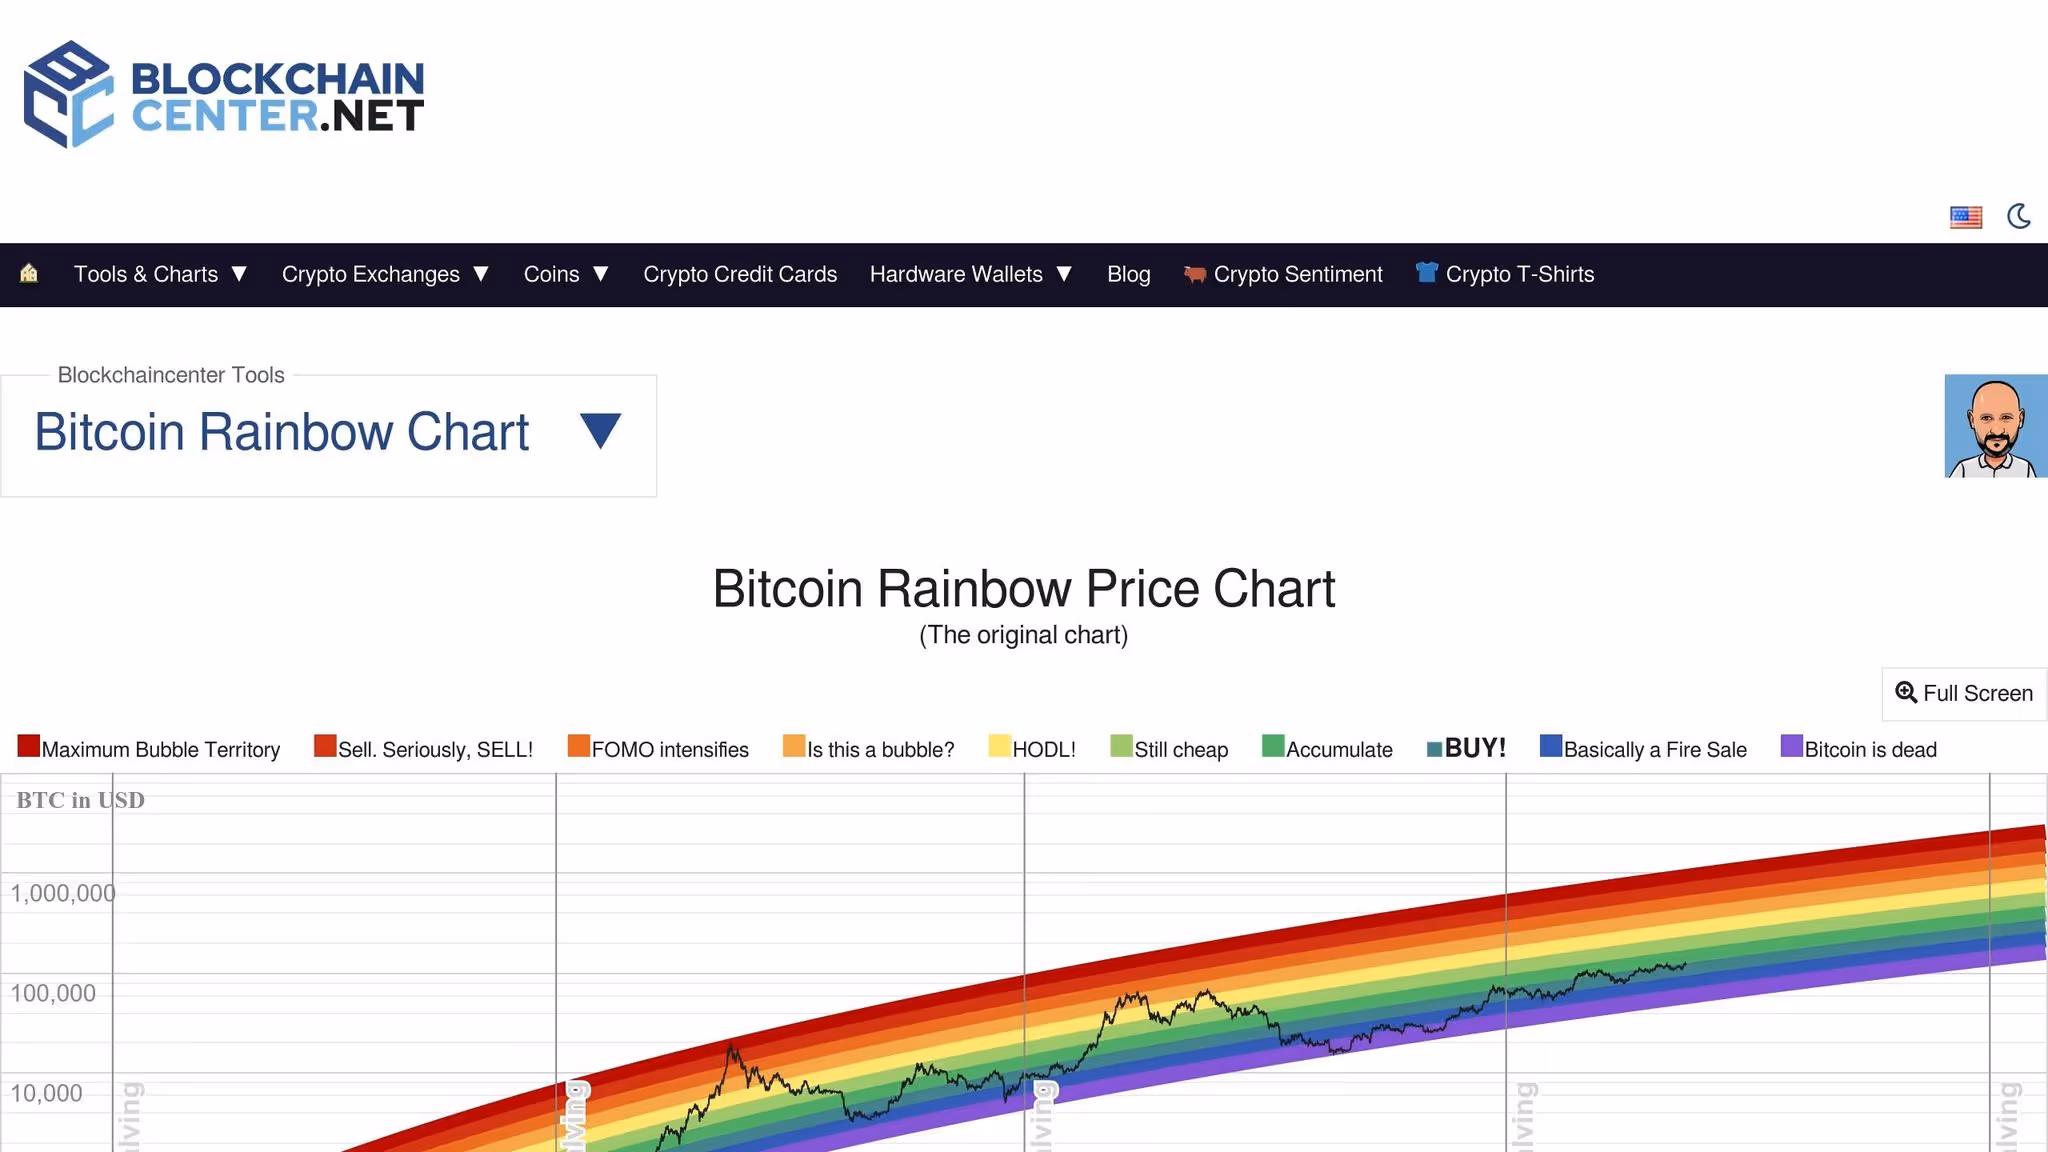
Before diving headfirst into altcoins, it’s critical to assess the broader market conditions. Altcoins typically follow Bitcoin’s trajectory, making Bitcoin a solid indicator of where the market stands. One powerful tool for this is the Bitcoin Rainbow Chart, which categorizes Bitcoin’s price movements into nine actionable zones such as "Fire Sale", "Buy", "Hold", and "Maximum Bubble Territory".
Using this chart, traders can time their entry and exit points with precision. Altcoin investors should wait until Bitcoin cycles out of "bubble" territory before rotating into alts.
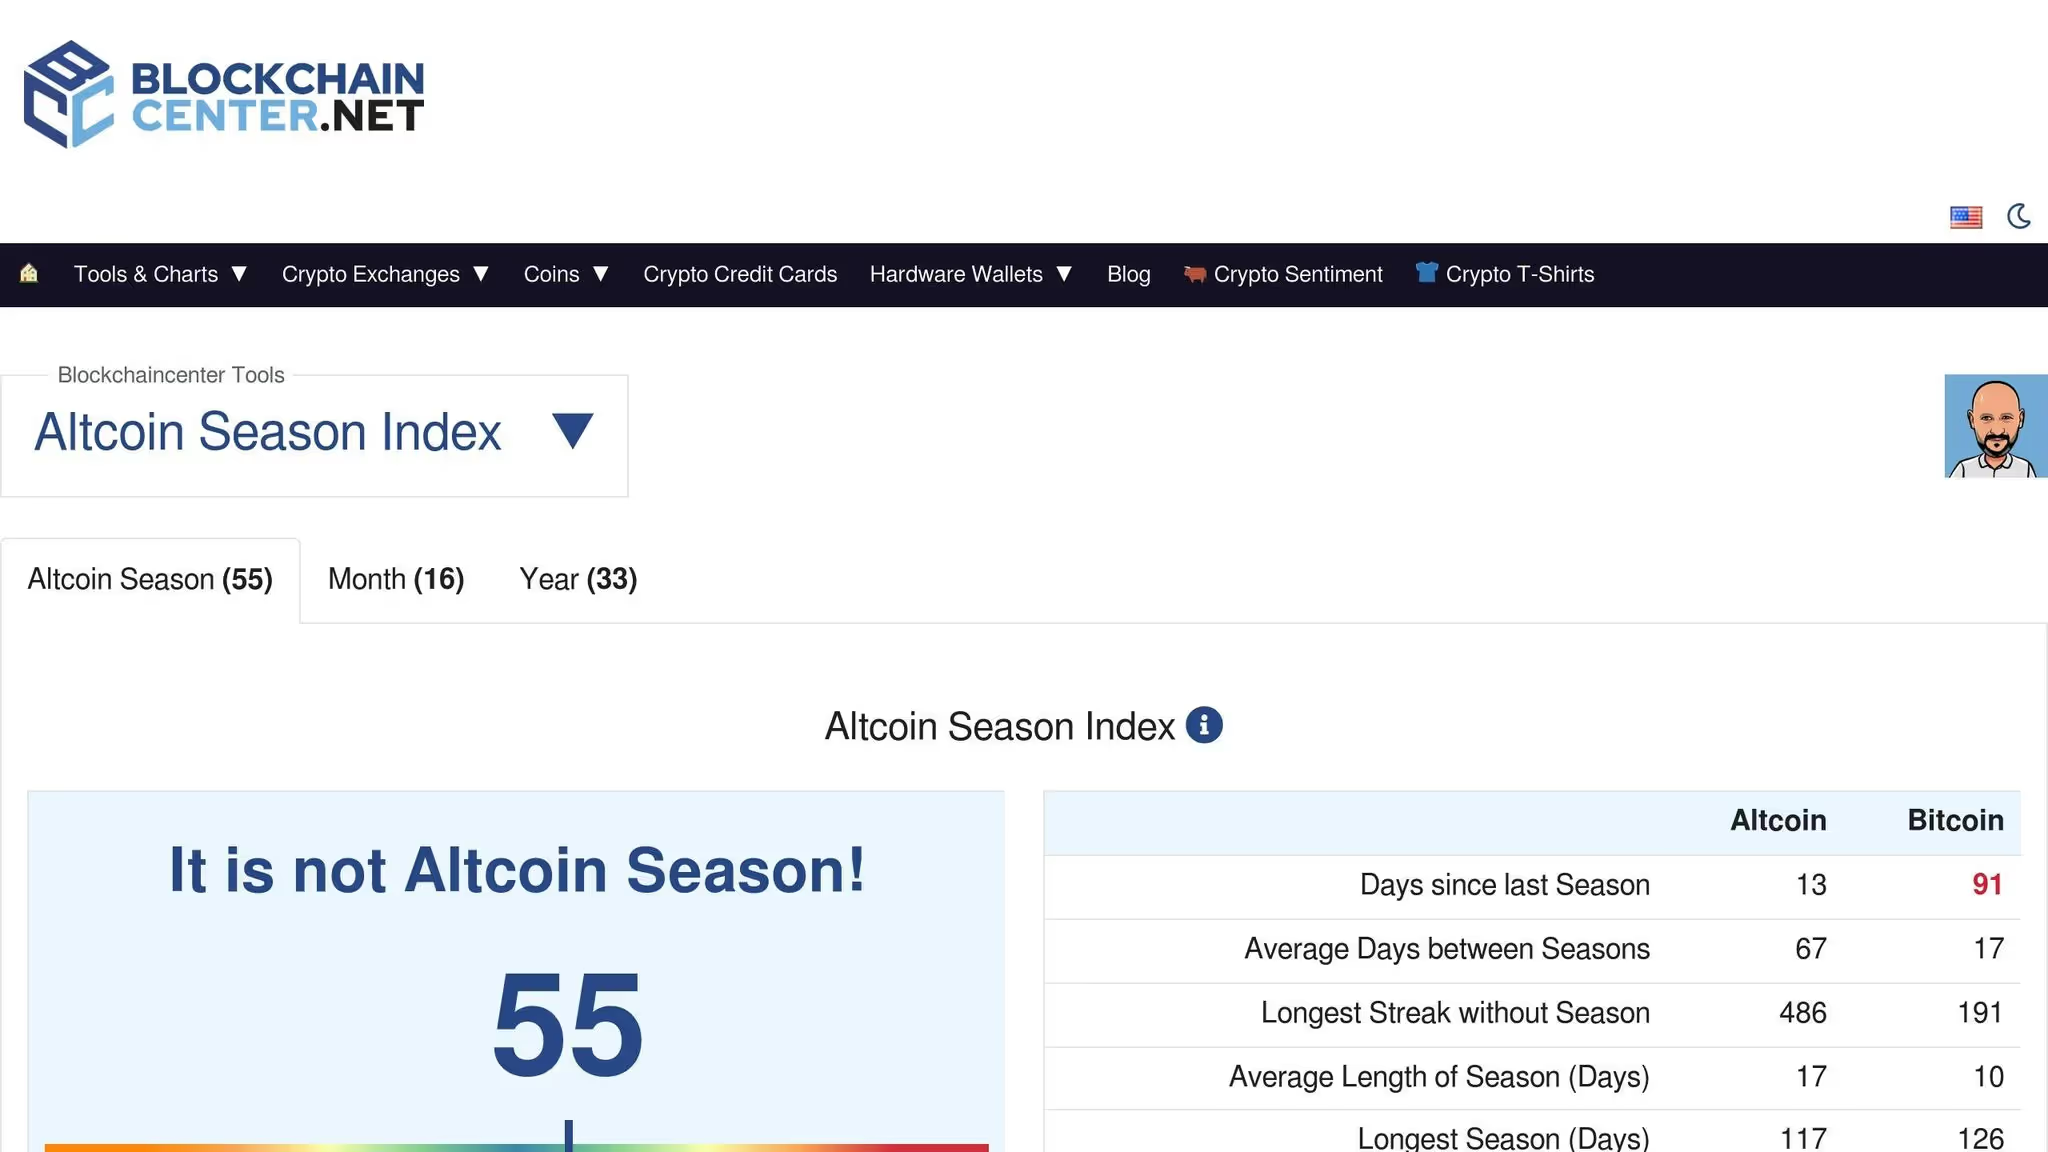
Once the overall market trajectory is clear, the next step is determining whether it’s a good time to focus on Bitcoin or shift towards altcoins. This is where the Altcoin Season Index comes in. The index scores the market on a scale from 0 to 100:
As of the video analysis, the market was rated at 37, signaling a Bitcoin-leaning phase. However, this transitional range often presents an excellent opportunity to start gradually accumulating larger, more established altcoins like Ethereum, XRP, and Solana. The real altcoin explosion typically follows Bitcoin’s rise. For those aiming to anticipate smart money movements, check out How to Spot Insider Wallets and Copy Meme Coin Trades to learn how top traders identify and mirror profitable wallet activity.
When the index nears 75, meme coins and low-cap tokens tend to experience parabolic growth. Traders should prepare by identifying potential projects before this phase.

If you want to level up your altcoin research, tracking the trading activity of major wallets can provide a significant edge. Arkham Intelligence is a tool designed to monitor institutional wallets and high-profile traders.
For instance, spotting a major institution or crypto whale quietly accumulating a small-cap token could be an early signal of an upcoming price surge. However, as the video cautions, the most lucrative gains often occur in low-market-cap projects, which may not yet be on the radar of larger players.
To uncover hidden gems with exponential potential, you need to dig deeper into small-cap tokens. Dex Screener and Solana wallet trackers (e.g., SoulScan) make this process manageable.
By combining data from Dex Screener and wallet trackers, traders can effectively follow the moves of successful "degen" traders and potentially replicate their success.
Not all whale activity leads to predictable gains. Some traders engage in insider trading or pump-and-dump schemes. To mitigate risk:
The video emphasizes one critical insight that many overlook: do not blindly follow whale trades without conducting your own due diligence. Here’s why:
By starting with paper trades and analyzing a coin’s fundamentals, you can fine-tune your ability to act on data without exposing yourself to significant losses in the early stages.
The article introduces the Altcoin Season Index and Bitcoin Rainbow Chart as primary timing tools but does not cover the on-chain capital rotation metrics that confirm altcoin season onset independently of price-based indices. On-chain capital rotation analysis measures the actual movement of capital between Bitcoin and altcoin ecosystems through wallet behavior and exchange flow data, which leads price-based indices by days to weeks because smart money repositioning precedes the retail price response that drives index readings. Using on-chain rotation metrics alongside the Altcoin Season Index creates a two-confirmation entry framework that substantially reduces false positive entries during transitional market phases.
The Altcoin Season Index is fundamentally a price performance measurement: it calculates what fraction of the top 100 altcoins have outperformed Bitcoin over the trailing 90 days, which means it confirms altcoin season only after the price outperformance has already accumulated. A trader acting on an index reading of 75 is entering after 75 percent of top-100 altcoins have already made their major moves against Bitcoin, which captures a portion of the continuing trend but misses the majority of the initial rotation gains. On-chain capital rotation metrics that detect the behavioral precursors to price rotation provide earlier entry signals by identifying when smart money wallets are repositioning before that repositioning is reflected in 90-day price comparisons.
Bitcoin exchange outflow divergence is the most direct on-chain indicator of incipient capital rotation. When Bitcoin is transitioning from accumulation to distribution phase, large wallet holders systematically transfer Bitcoin from self-custody cold wallets to exchange hot wallets in preparation for selling. This transfer activity is visible on-chain as a sustained increase in exchange inflows from wallet addresses with long holding histories, which distinguishes genuine distribution from short-term trading activity. Concurrently, exchange outflows from Ethereum and major altcoin ecosystems increase as capital that was parked in altcoin stablecoins or lower-volatility altcoin positions begins moving toward higher-beta assets. The divergence between rising Bitcoin exchange inflows and rising altcoin exchange outflows is the on-chain signature of institutional rotation from Bitcoin to altcoins, and it typically leads the Altcoin Season Index reading above 75 by 14 to 30 days based on documented historical cycle analysis.
Stablecoin supply growth rate on altcoin-dominant chains including Ethereum, Solana, and Base measures the quantity of deployable capital that has accumulated in stablecoin form and is awaiting deployment into altcoin positions. Stablecoin supply on these chains grows during risk-off periods when holders convert volatile assets to stablecoins to preserve value while maintaining on-chain positioning, and it shrinks during risk-on periods when that capital is deployed into altcoins. The rate of stablecoin supply growth is therefore a leading indicator of future altcoin buying pressure: a large accumulated stablecoin supply that begins rapidly declining signals the onset of broad altcoin deployment as holders rotate from stablecoins into risk assets simultaneously.
Stablecoin deployment velocity refines this analysis by measuring the speed at which accumulated stablecoin supply is being converted into altcoin positions, which distinguishes slow defensive repositioning from the rapid large-scale deployment that characterizes peak altcoin season entry. Deployment velocity is calculated as the change in chain-level stablecoin supply over rolling 7-day windows, expressed as a percentage of the total accumulated supply. Velocities above 5 percent per week indicate rapid broad-based deployment consistent with altcoin season onset. Velocities below 1 percent per week indicate slow defensive repositioning that may reflect tactical altcoin exposure without broad altcoin season conditions. The transition from below 1 percent to above 3 percent weekly deployment velocity over a 14-day period has historically marked the beginning of the most rapid phase of altcoin price appreciation in documented prior cycles.
Ethereum gas fee trends provide a complementary signal by measuring the aggregate demand for on-chain altcoin trading activity across the Ethereum ecosystem. Gas fees are determined by competition for block space, which increases when many users simultaneously want to execute transactions. Sustained gas fee increases above the 60-day trailing average in the context of rising stablecoin deployment velocity confirm that stablecoin deployment is being driven by genuine trading activity rather than mechanical protocol interactions, because high gas prices indicate that users are willing to pay elevated costs to execute time-sensitive transactions, which is characteristic of competitive altcoin entry during early altcoin season but not of routine protocol maintenance or slow defensive repositioning.
Wallet cohort rotation analysis segments the total population of on-chain wallets into behavioral cohorts based on their historical activity patterns and measures the rotation of trading activity and capital between cohorts as market conditions change. The cohort definitions most relevant for altcoin season detection are: long-term Bitcoin holders with minimal altcoin exposure, altcoin-focused traders with established position-building histories in prior cycles, and new entrant wallets with limited prior cycle experience. The rotation of activity from the Bitcoin holder cohort toward the altcoin trader cohort, measured by the fraction of total on-chain volume attributable to each cohort in rolling 14-day windows, provides direct evidence of institutional and experienced trader repositioning.
Smart money positioning detection within the altcoin trader cohort identifies wallets that have demonstrated profitable altcoin cycle trading in prior documented cycles, typically defined as wallets with realized profits from altcoin positions above specified thresholds during the 2020 to 2021 and 2023 to 2024 cycle periods. These wallets represent the most informed segment of the altcoin trading population because their prior cycle success provides empirical evidence of genuine analytical capability rather than luck in a single cycle. Monitoring the aggregate altcoin exposure of this cohort, measured as the ratio of altcoin holdings to stablecoin holdings across all cohort wallets, provides the most forward-looking positioning indicator available because these wallets tend to build positions early in anticipation of altcoin season rather than in response to it.
Cross-chain capital deployment sequencing captures the characteristic pattern in which capital rotates into altcoins in a consistent sequence across chains during documented altcoin seasons. Capital typically flows into Ethereum large-cap altcoins first, followed by Solana ecosystem tokens, followed by Base chain emerging projects, followed by low-cap speculative meme coins as the cycle matures. Identifying where in this deployment sequence the current market sits by measuring the relative deployment velocity across chains and asset size tiers allows traders to position in the next phase of the sequence before deployment velocity in that tier reaches peak levels. A market where Ethereum large-cap deployment velocity has already peaked but Solana ecosystem velocity is just beginning to accelerate is in the mid-cycle phase, and low-cap meme coin exposure on Solana represents the most favorable forward risk-reward positioning within that context.
Navigating the altcoin market requires a balance of strategic timing, data-driven decision-making, and adaptability. By leveraging tools like the Bitcoin Rainbow Chart, Altcoin Season Index, Arkham Intelligence, and Dex Screener, you can position yourself ahead of the curve. Most importantly, remember that the crypto market rewards patience and preparation. With the right approach, you’ll not only identify potential 100x opportunities but also avoid the pitfalls that trap many traders.
The article provides a strong foundation for identifying altcoin season onset and finding winning wallets but does not address how to size positions across different altcoin tiers and sectors to maximize cycle returns while managing the dramatically different risk profiles across large-cap established altcoins, mid-cap narrative tokens, and speculative low-cap meme coins. Altcoin season position sizing requires a fundamentally different framework from standard portfolio management because the risk-return distribution across altcoin tiers is highly asymmetric, and the optimal strategy during genuine altcoin season conditions involves accepting more risk per position than most traditional portfolio frameworks would endorse while managing total portfolio risk through tier diversification and systematic profit-taking.
The empirical return distribution of altcoins during altcoin seasons shows extreme positive skewness: the median altcoin in a genuine altcoin season produces returns of 2 to 5 times capital, while the mean return is dramatically higher because a small fraction of the distribution produces 20 to 100 times returns that dominate the average. This distribution has critical implications for position sizing. A strategy that allocates equal capital to each altcoin position and takes partial profits at moderate return levels will consistently underperform a strategy that allows small winning positions to run to their natural conclusion because it systematically truncates the right tail of the return distribution. Optimal altcoin season position sizing combines tiered allocation based on risk level with asymmetric profit-taking rules that protect downside while preserving exposure to the full upside distribution.
Tiered capital allocation divides the total altcoin season trading allocation into three tiers with different risk profiles, position sizes, and management rules. The allocation percentages and management rules for each tier are calibrated to produce a portfolio that benefits from both the reliable moderate returns of large-cap altcoins and the high-variance extreme returns of low-cap meme coins while controlling the total portfolio drawdown risk from any single tier disappointing.
Tier 1, large-cap established altcoins including Ethereum, Solana, XRP, and similar assets with multi-year track records and substantial ecosystem activity receives 50 percent of total altcoin allocation. These positions are sized to capture the reliable 2 to 5 times returns that large-cap altcoins produce during confirmed altcoin season conditions. The profit-taking rule for Tier 1 positions is systematic: sell 25 percent of the position at 1.5 times entry price to recover a meaningful portion of initial capital, sell an additional 25 percent at 3 times entry price, and allow the remaining 50 percent to run with a trailing stop at 40 percent below the highest closing price reached. This rule structure ensures capital recovery while preserving the possibility of full cycle returns if the position continues appreciating.
Narrative sector rotation is the mechanism by which capital flows sequentially through different altcoin categories during altcoin season, creating distinct performance windows for each sector that are predictable in sequence if not in precise duration. The rotation sequence observed across multiple documented altcoin seasons follows a consistent pattern driven by the risk appetite escalation of market participants as the season progresses. Infrastructure and layer-1 tokens typically lead because they have the clearest fundamental narratives and attract the earliest institutional capital. DeFi protocol tokens follow as rising asset prices increase the value of DeFi protocol activity and revenue. Gaming, NFT, and metaverse tokens rotate next as retail attention peaks. Finally, speculative meme tokens with no fundamental basis beyond community attention receive the last and typically largest percentage returns, capturing the maximum euphoria phase before the season reverses.
Tier 2, mid-cap narrative tokens with market capitalizations between $100 million and $2 billion receives 35 percent of total altcoin allocation. This tier is further subdivided by narrative sector based on where the current rotation sequence suggests the most favorable entry timing. A mid-cycle altcoin season where Ethereum large-cap tokens have already completed 60 to 80 percent of their expected cycle appreciation but DeFi tokens are still early in their rotation phase calls for overweighting DeFi in the Tier 2 allocation and underweighting layer-1 competitors that have already moved. Profit-taking rules for Tier 2 positions are more aggressive than Tier 1 given the higher volatility: sell 33 percent at 2 times entry price, 33 percent at 5 times entry price, and allow the remaining 33 percent to run with a trailing stop at 35 percent below the highest closing price.
Sector rotation confirmation signals from wallet tracking provide the most precise timing for Tier 2 entry points within each narrative sector by identifying when high-performance wallets with demonstrated cycle experience are actively accumulating a specific sector before it enters its primary appreciation phase. A high-performance wallet cohort that was successfully positioned in Ethereum large-cap tokens during the early cycle and is now rotating capital into DeFi protocol tokens provides direct behavioral evidence that the DeFi sector rotation phase is beginning, which is more actionable than any price-based sector rotation indicator because it captures repositioning before the price response occurs. Aligning Tier 2 sector weightings with the rotation signals from high-performance wallet cohort behavior produces sector timing precision that substantially improves the entry prices achieved within each sector's appreciation window.
Tier 3, speculative low-cap tokens and meme coins with market capitalizations below $50 million receives 15 percent of total altcoin allocation. Despite the small allocation percentage, Tier 3 positions generate a disproportionate fraction of total altcoin season returns in documented historical cycles because the potential return multiples are dramatically higher than in the other tiers. A 15 percent allocation to positions that achieve 20 to 50 times returns contributes more to total portfolio performance than a 50 percent allocation to positions achieving 3 to 5 times returns, which means the Tier 3 allocation is the primary driver of whether total altcoin season performance is average or exceptional.
Individual Tier 3 position sizing uses extremely small allocations per token, typically 0.5 to 1.5 percent of total altcoin allocation per position, which allows holding 10 to 30 simultaneous low-cap positions without any single position representing catastrophic risk to the total portfolio. The loss probability on any individual low-cap meme coin position is high, with the majority of tokens in this category returning losses in most market conditions, but the expected value of a portfolio of 20 to 30 carefully selected low-cap positions during confirmed altcoin season conditions is strongly positive because the small number of extreme winners more than compensate for the larger number of losers.
Late-cycle exposure management is the most consequential risk management decision in altcoin season trading because the transition from altcoin season peak to reversal occurs rapidly and with limited warning, and portfolios that fail to reduce exposure before the reversal give back a substantial fraction of accumulated season gains. The on-chain reversal warning signals mirror the rotation entry signals in reverse: rising Bitcoin exchange outflows indicating re-accumulation of Bitcoin, rising altcoin exchange inflows indicating distribution into exchange liquidity, declining stablecoin deployment velocity indicating reduced new capital entering altcoin positions, and high-performance wallet cohort rotation away from altcoin positions toward stablecoin or Bitcoin holdings. Monitoring these reversal indicators continuously and reducing Tier 2 and Tier 3 exposure systematically when two or more reversal signals appear simultaneously provides the earliest practical exit timing consistent with on-chain evidence rather than relying on price-based lagging indicators to signal the season end.
Source: "Is It Altcoin Season? How to Spot Winning Coins Before They Pump" - CryptoGX, YouTube, Aug 20, 2025 - https://www.youtube.com/watch?v=NSzKzLZibAg
Use: Embedded for reference. Brief quotes used for commentary/review.
Three on-chain metrics consistently lead the Altcoin Season Index reading above 75 by 14 to 30 days based on documented historical cycle analysis. Bitcoin exchange outflow divergence is the earliest signal: when large wallet holders with long holding histories begin systematically transferring Bitcoin to exchange hot wallets for distribution while altcoin ecosystem exchange outflows simultaneously increase, the on-chain signature of institutional rotation from Bitcoin to altcoins is established before the resulting price performance changes the index reading. This divergence pattern appears in the exchange flow data 2 to 4 weeks before the index reflects the rotational outcome.
Stablecoin deployment velocity on altcoin-dominant chains including Ethereum, Solana, and Base provides the second confirmation signal. Velocity above 3 to 5 percent of total accumulated stablecoin supply per week indicates rapid broad-based deployment consistent with altcoin season onset. The transition from below 1 percent to above 3 percent weekly velocity over a 14-day period has marked the beginning of the most rapid altcoin appreciation phases in prior cycles, typically preceding the index reading above 75 by 10 to 20 days. Smart money wallet cohort positioning provides the third and most forward-looking signal: wallets with demonstrated profitable cycle trading history that are actively rotating from stablecoin or Bitcoin holdings toward altcoin positions are repositioning in anticipation of altcoin season rather than in response to it. Monitoring the aggregate altcoin-to-stablecoin ratio across this cohort and tracking its rate of change over rolling 14-day windows provides the earliest available on-chain confirmation that experienced traders are building altcoin exposure ahead of the season's primary appreciation phase.
Optimal altcoin season capital allocation uses a three-tier structure with different size, management, and profit-taking rules calibrated to the distinct risk-return profiles of each tier. Tier 1 large-cap altcoins including Ethereum, Solana, and similar multi-year established assets should receive 50 percent of total altcoin allocation. The systematic profit-taking rule for Tier 1 is to sell 25 percent at 1.5 times entry price to recover initial capital, sell 25 percent at 3 times entry price, and hold the remaining 50 percent with a trailing stop at 40 percent below the highest closing price to capture the full cycle appreciation without attempting to time the precise top.
Tier 2 mid-cap narrative tokens with market capitalizations between $100 million and $2 billion should receive 35 percent of allocation, further subdivided by narrative sector based on where the current rotation sequence suggests the most favorable entry timing. Sector rotation confirmation from high-performance wallet cohort behavior, identified through wallet tracking platforms, provides more precise sector entry timing than price-based rotation indicators because it captures repositioning before the price response. Profit-taking for Tier 2 is more aggressive: sell 33 percent at 2 times entry, 33 percent at 5 times entry, and hold the remaining 33 percent with a 35 percent trailing stop. Tier 3 speculative meme coins should receive 15 percent of total allocation with individual position sizes of 0.5 to 1.5 percent per token, enabling 10 to 30 simultaneous positions. Despite the small allocation, Tier 3 drives disproportionate total returns because 20 to 50 times returns on even a 1 percent position contribute substantially to total portfolio performance. Late-cycle reversal monitoring through rising altcoin exchange inflows, declining stablecoin deployment velocity, and high-performance wallet cohort rotation toward stablecoins or Bitcoin should trigger systematic Tier 2 and Tier 3 reduction when two or more reversal signals appear simultaneously, capturing the majority of cycle gains before the rapid reversal phase eliminates them.

A premier DeFi analytics platform empowering traders to discover and analyze profitable blockchain wallets, trades and tokens.

