
Recovery Factor Calculation for Smart Traders
Master the recovery factor calculation to measure a strategy's resilience. Learn the formula, see DeFi examples, and find top wallets with Wallet Finder.ai.

June 20, 2026


Wallet Finder
February 15, 2026

The useless coin price is a classic memecoin rollercoaster, driven more by hype and social media chatter than by fundamentals. This isn't your slow-and-steady stock; it's a world where prices can swing wildly in minutes.
For perspective, its all-time high of $0.448 came from a mind-bending 8,860% pump off its lows. That's the kind of lottery ticket potential that draws traders in, but it's a double-edged sword that cuts just as deep on the way down.
To get a real feel for what's happening with Useless Coin, you have to look past the price tag. A few key numbers give you a much clearer picture of its health and momentum at any given moment. Think of them as the token's vital signs.
For example, a high trading volume compared to its total market cap is often a flashing light that something is about to happen. It tells you traders are highly interested and there's enough liquidity to fuel a big move—up or down. Nailing these basics is your first step to trading smarter in this chaotic space.
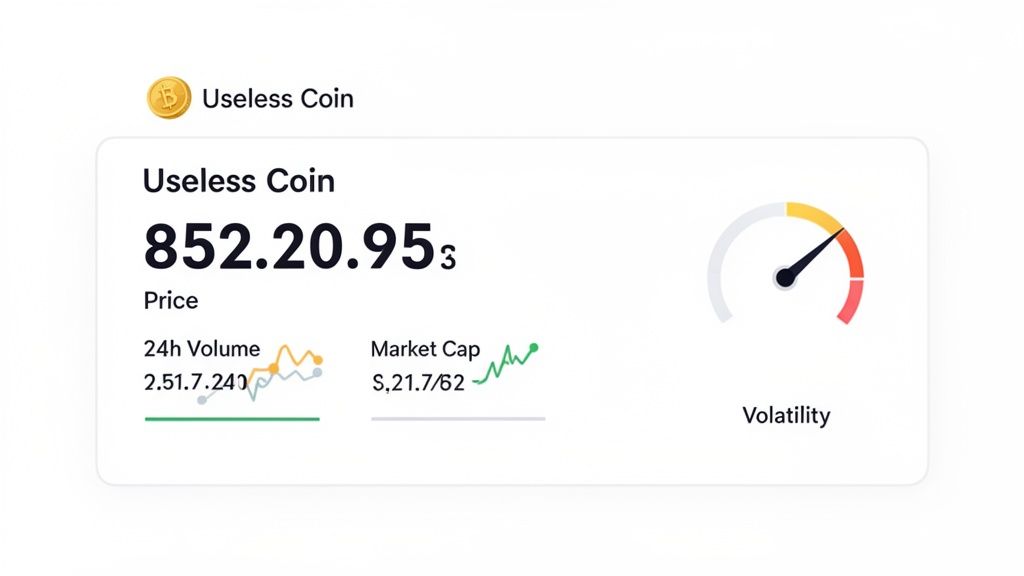
Here’s an actionable breakdown of the most critical data points for Useless Coin. This table gives you a snapshot of where the coin stands in the market and how to interpret the data.
MetricCurrent ValueWhat It IndicatesActionable InsightPrice~$0.33The current market value per token.Track price in relation to volume for momentum clues.24h Volume~$138.5MHigh volume suggests strong trader activity and liquidity.Look for volume spikes as a signal of an imminent price move.Market Cap~$340.7MThe total value of all coins in circulation.A rising market cap confirms a sustained uptrend.VolatilityHighIndicates potential for rapid and large price swings.High volatility is an opportunity but requires tight risk management.
These numbers tell a story. While the price might seem random, the underlying metrics can give you clues about what’s really going on behind the scenes.
The history of Useless Coin is a perfect lesson in memecoin behavior. It’s seen yearly gains hit 2.89K%, even while getting hammered in short-term weekly slumps. The traders who got in early and held on saw life-changing returns, but it's a familiar pattern: a tiny percentage of wallets usually walk away with the lion's share of the profits. You can dig into these patterns yourself with the historical data and charts on TradingView.
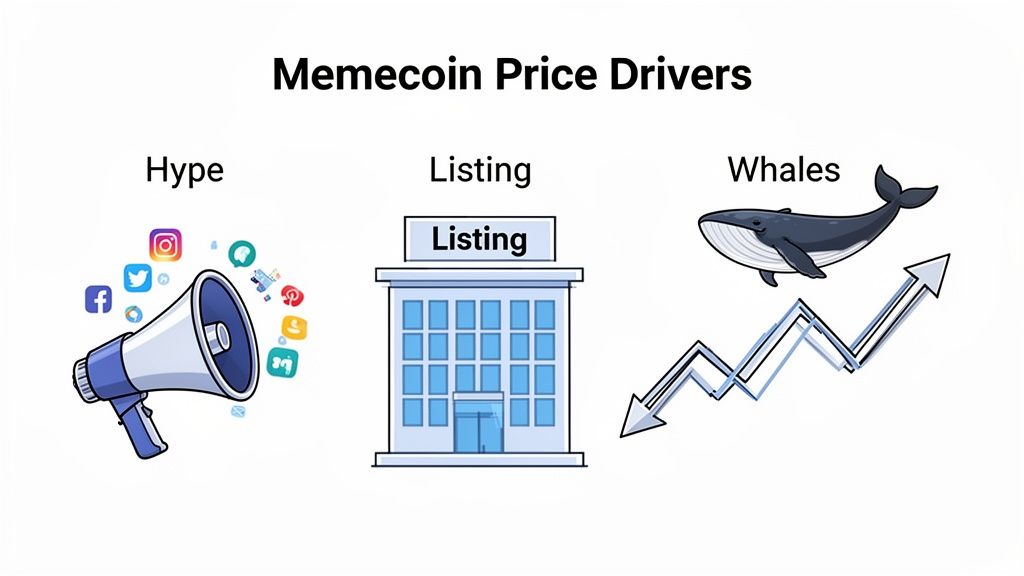
Forget everything you know about traditional stocks. Memecoins like Useless Coin play by an entirely different rulebook. Their prices aren't moved by earnings reports, but by a wild mix of social hype, community vibes, and big-money moves. If you want to get ahead, you need to understand these triggers.
The lifeblood of any memecoin pump is social media. Platforms like X (what used to be Twitter) and Telegram are where the magic—and madness—happens. A single post from a major influencer or a meme that goes viral can spark a massive buying spree, causing the useless coin price to rocket upwards in a matter of minutes.
This social buzz quickly snowballs. More chatter means more visibility, which pulls in new buyers and pushes the price even higher. This self-feeding loop is usually kicked off by a few key things:
A new exchange listing is like a memecoin graduating to the big leagues. It signals broader acceptance and introduces the token to a much larger pool of potential traders, fundamentally altering its market dynamics overnight.
Finally, you can't ignore the whales—wallets holding a massive supply of a token. These players have enough firepower to move the market all by themselves. A huge buy from a whale can signal confidence and kickstart a rally, while a massive sell-off can trigger a panic sell.
Their moves are rarely random. By keeping an eye on these large wallets, smart traders can get a heads-up on market-moving events before they play out. This is exactly why tools that track smart money are so powerful; they give you a peek into what the biggest players are planning next.
Every memecoin follows a predictable pattern. Useless Coin is no exception. The traders who make money aren't the ones chasing pumps—they're the ones who can identify which phase a coin is in and position accordingly. Miss this, and you're the exit liquidity for those who got in early.
Understanding these phases isn't just theory. It's the difference between buying at $0.05 and watching it moon to $0.44 (that's 780% profit) versus buying at $0.40 and watching it crash back to $0.30 (that's a 25% loss in days).
This is where less than 5% of eventual holders own the token. Volume is low, usually under $500K daily. Price action is boring—slow, grinding upward moves or sideways consolidation. Social media mentions are minimal.
What's happening behind the scenes:
Savvy wallets are quietly accumulating. They're not screaming about it on X. They're not shilling in Telegram. They're just buying. You can spot this by tracking wallet creation dates and transaction patterns.
On-chain signals:
Real Useless Coin example:
Before Useless Coin's initial pump in May 2025, on-chain data showed approximately 200 wallets accumulating positions between $0.02-$0.05 over a two-week period. These wallets had history—they'd successfully flipped other Solana memecoins. That was the signal.
Action for traders:
This is the best risk-reward phase to enter, but it's the hardest to catch. You need to be monitoring new token launches and tracking early wallet behavior. Use Wallet Finder's new token discovery features to surface these opportunities before they hit mainstream awareness.
This is when social media explodes. Influencers start posting. Trading volume jumps 10-20x overnight. The useless coin price starts moving 20-50% per day. Holder count skyrockets from hundreds to thousands.
What's happening:
The smart money from Phase 1 starts taking partial profits, selling into the new wave of retail buyers. But they're not dumping everything—just enough to lock in gains while letting the rest ride.
On-chain signals:
Real Useless Coin example:
Between September 24-October 14, 2025, Useless Coin went from $0.14 to its ATH of $0.44—a 214% pump in 20 days. During this period, daily active addresses increased 847%, and social mentions spiked to 0.15% of total crypto chatter. The hype was real, and it was loud.
Action for traders:
If you missed Phase 1, this is your last reasonable entry window—but only if you're early in Phase 2. Watch for the first major volume spike and enter immediately. Set tight profit targets (50-100% from your entry) and stick to them. Don't get greedy.
Price hits all-time highs. Everyone you know is talking about it. Mainstream crypto media is covering it. Celebrities or major influencers are shilling. The chart looks parabolic. Retail is convinced it's going to $1, $5, $10.
What's happening:
Smart money is exiting. Those wallets that accumulated in Phase 1? They're selling. Hard. The top 10-20 wallets start reducing positions by 30-50%. But because retail volume is so high, the selling is absorbed without the price immediately crashing.
On-chain signals:
Real Useless Coin example:
On October 14, 2025, Useless Coin hit $0.44. On-chain data from that exact day showed that top wallets (those with 300%+ PnL) accounted for 15% of total volume—and they were net sellers. Within 48 hours, the price dropped 19% to $0.36. The top was in, and the data showed it before the dump.
Action for traders:
If you're holding, sell. Not all of it if you want to gamble, but at least 50-75% of your position. The top is never obvious in the moment, but when you see smart money exiting while retail is buying, that's your signal. Don't be the last one holding the bag.
Price starts falling. At first, it's just a "healthy correction." Retail holders convince themselves it'll bounce back. It doesn't. The chart enters a long, grinding downtrend punctuated by brief, low-volume pumps (dead cat bounces).
What's happening:
Smart money is gone. The only buyers left are bag holders trying to "average down" their losses and new retail traders who think they're buying the dip. Volume dries up. Social mentions decline. The token fades from relevance.
On-chain signals:
Real Useless Coin example:
After the $0.44 peak, Useless Coin entered a slow decline. By late October 2025, it stabilized around $0.30-$0.33, down about 25% from peak. Daily volume fell from $138M (at peak) to $19M (current), a 86% volume collapse. The hype is fading.
Action for traders:
Stay away. Don't try to catch falling knives. The "buy the dip" crowd gets slaughtered here. Wait for a true bottoming signal (which might take months) before considering re-entry. Better opportunities exist elsewhere.
While social media hype can get a token noticed, serious traders are looking somewhere else for their signals. They're diving into on-chain analysis—sifting through the public transaction ledger of the blockchain itself to get a real-time, unfiltered view of what's actually happening. This isn't about guesswork; it's about making moves based on cold, hard data.
Think of it like being a detective at a crime scene. Instead of listening to rumors from the crowd, you're on your hands and knees, examining the actual evidence left behind. This is how you spot trends long before they hit the mainstream.
On-chain data is powerful, but raw numbers don't tell you everything. You need to interpret the behavior behind the transactions. This is wallet forensics—the art of profiling wallets to understand who's trading, why they're trading, and what it means for price action.
Most traders look at a memecoin and see "200 holders." A forensic analyst sees "15 smart money wallets, 50 early retail, 100 late FOMO buyers, and 35 dead wallets." That breakdown changes everything about how you assess risk.
Not all wallets are created equal. By categorizing them, you can predict price movements before they happen.
1. Dev/Team Wallets (The Potential Rugpull)
These are wallets that received tokens at launch for free or at absurdly low prices. They usually hold 5-15% of total supply. If they start selling, it's a massive red flag.
How to identify:
What to watch:
If dev wallets start moving tokens to exchanges, especially in large chunks, the dump is coming. They're cashing out. This isn't "taking profits"—this is abandonment.
Useless Coin dev wallet behavior:
Useless Coin launched via LetsBONK.fun, which limits dev allocation. This is actually a positive signal. However, you should still verify the deployer wallet and any wallets that received large initial allocations haven't sold aggressively.
2. Smart Money Wallets (The Alpha Signal)
These are wallets with a proven track record. They've flipped other memecoins profitably. They trade with discipline—they enter early, take partial profits on the way up, and exit before the dump.
How to identify:
What to watch:
When smart money wallets accumulate a new position, that's a buy signal. When they start reducing, that's a sell signal. It's that simple.
Useless Coin smart money activity:
During the September-October 2025 run, wallets tracked on Wallet Finder with >70% win rates were accumulating Useless Coin between $0.15-$0.25. When price hit $0.40-$0.44, those same wallets reduced positions by 40-60%. The playbook was textbook.
3. Bag Holders (The Exit Liquidity)
These wallets bought at or near the all-time high and are now underwater. They're hoping for a recovery. Most will sell at break-even (if they ever get the chance) or capitulate during the next leg down.
How to identify:
What it means:
A high concentration of bag holders creates resistance at their entry price. If Useless Coin pumps back toward $0.44, expect massive selling pressure as these wallets try to escape.
Useless Coin bag holder analysis:
Approximately 30-35% of current Useless Coin holders (as of late January 2026) have unrealized losses. Most bought between $0.38-$0.44. This creates a ceiling. Price needs to clear $0.45+ to trigger a real breakout, which requires new capital inflow to absorb their selling.
4. Dead Wallets (The Supply Lock)
These wallets bought and forgot. The owner might have lost access, abandoned the position, or just doesn't care. These tokens are effectively removed from circulating supply.
How to identify:
What it means:
Dead wallets reduce effective supply, which is bullish. If 10% of supply is in dead wallets, the effective supply is 10% lower than what CoinGecko reports. This can create stronger pumps when demand increases.
Useless Coin dead wallet estimate:
Roughly 5-8% of Useless Coin supply appears to be in dead or dormant wallets. Not a huge factor, but something to note when calculating real liquidity.
Here's a critical metric most traders ignore: Top 10 Wallet Dominance Percentage.
Formula:
Top 10 Dominance = (Tokens held by top 10 wallets / Total circulating supply) × 100
Interpretation:
Useless Coin's number:
Top 10 wallets hold approximately 52.96% of supply. This is high-risk territory. These wallets can crash the price whenever they want. It's essential to monitor their behavior daily.
Action step:
Before entering any memecoin position, calculate this metric. If it's above 50%, you're not trading a market—you're trading against whales. Adjust your risk accordingly (smaller position, tighter stops).
To get a real read on the momentum behind the useless coin price, you need to know which clues matter. Here are key metrics that reveal a token's true health and expose the intentions of its biggest players.
On-chain data cuts right through the noise. It shows you what traders are doing with their money, not just what they're tweeting about it. This is the difference between reacting to the market and getting ahead of it.
Given how fragile memecoins are, this data is essential. For example, Useless Coin's market cap shot up to $103,093,109 before tumbling 19% in just 48 hours. On-chain data from that time showed that top wallets—already sitting on 300%+ PnL—bought up 15% of the volume right at the peak, revealing their exit strategy in plain sight.
You can dig into more of this data yourself on CoinGecko. Learning to read these smart money flows is a game-changer. For a deeper dive, check out our complete guide to on-chain data analysis.
In the Wild West of memecoins, blindly trusting a single source for the useless coin price is a rookie mistake. Verifiable, on-chain data is your only real defense against misinformation and outright scams.
Your first stop should be cross-referencing information from the big data aggregators. Platforms like CoinGecko and CoinMarketCap are the industry standard for a reason. They aggregate price data from dozens of exchanges, giving you a solid, averaged-out view of the market.
CoinGecko, in particular, is known for listing new, obscure tokens faster than anyone else—a huge plus when you're hunting for the next memecoin gem.
While aggregators are a great starting point, they aren't the ultimate source of truth. For that, you have to go on-chain. This means using a blockchain explorer like Etherscan for Ethereum-based tokens or Solscan for anything on Solana.
Here’s a simple, actionable verification process:
Blockchain explorers are your direct window into what's actually happening. They provide an immutable, transparent record that cuts through all the social media hype and noisy price charts, showing you exactly where the money is flowing. For serious traders, this isn't optional.
For a more advanced approach, you can learn to pull data yourself using a crypto prices API. Developing this skill set is what separates passive market observers from active, data-driven analysts.
Theory is great, but turning on-chain data into a repeatable trading strategy is where the real edge is. This is exactly where a tool like Wallet Finder.ai comes into play, helping you shift from watching the market to actively mirroring its sharpest players. The idea is to find wallets that consistently win and use their moves as a high-quality signal for your own trades.
This isn't just about finding a wallet with a big, flashy profit and loss (PnL). It's about digging into their entire trading history—pinpointing their exact entries and exits, calculating their win rate, and seeing how they size their positions. When you dissect these patterns, you start to see the difference between a one-hit-wonder and a genuinely skilled trader.
The core of this strategy is using a platform’s discovery tools to sift through thousands of wallets and lock onto the "smart money." Here’s a quick rundown of how you can do it with Wallet Finder.ai:
This process—moving from broad data aggregators to specific DEX screeners—is how you verify opportunities and build a reliable on-chain signal system.
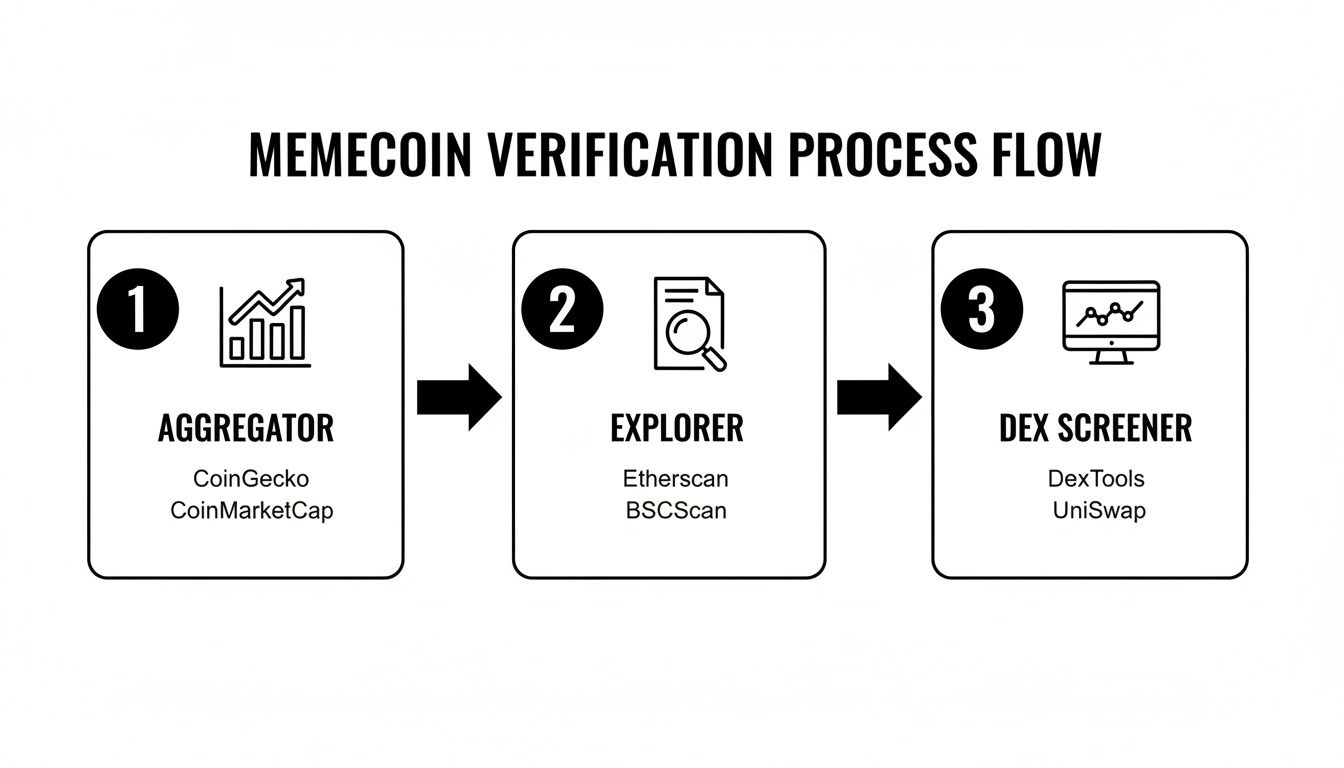
This workflow shows how traders can move from high-level market data down to specific, verifiable on-chain moves, which is the whole foundation of smart money tracking.
This strategy comes alive in the chaos of memecoin markets. Take Useless Coin, for example. It recently tanked -12.30% one day, only to roar back +12.38% the very next. The useless coin price swung by over 45% in just two days.
A platform like Wallet Finder.ai would have flagged the smart money wallets that were buying the dip, giving you a signal to get in before the rebound. Looking back, we can see that 10-15% daily swings like this happened on 68% of trading days for Useless Coin last quarter. You can dig into more historical data on Useless Coin's performance on Investing.com.
If you want to go deeper on this technique, check out our guide on how to use a smart money tracker to its full potential.
Here's the part nobody talks about: selling memecoins is harder than buying them. In traditional markets, you sell when you want. In low-liquidity memecoins, selling wrong can cost you 20-30% of your position's value in slippage alone.
This is especially critical for Useless Coin, where daily volume fluctuates wildly. On peak days, $138M in volume means you can exit a $50K position cleanly. On slow days with $5M volume, that same $50K sell could tank the price 10% and fill at a terrible average.
Liquidity depth is how much capital is available at each price level. On a DEX, this is the size of the liquidity pool. On a CEX, it's the order book depth.
Rule of thumb:
Your sell order should never exceed 1-2% of daily volume if you want to avoid significant slippage.
Example:
Useless Coin currently has ~$20M daily volume. You want to sell a position worth $50,000.
Your $50K is well below the 2% threshold. You should be able to sell with minimal slippage (<1%).
But if daily volume drops to $2M (which happens on slow days), your $50K sell becomes 2.5% of volume—now you're pushing the limits and will likely see 2-5% slippage.
Don't sell your entire position at once. Use a tiered exit based on volume and price levels.
Setup:
Let's say you hold 100,000 USELESS tokens, current price $0.33, total value $33,000.
Tier 1 Exit (25% of position): Volume-Blind Market Sell
Sell 25,000 USELESS (~$8,250) immediately at market price.
Why: This locks in some profit without worrying about timing. Even if you get 2-3% slippage, it's a small portion of your stack.
Tier 2 Exit (50% of position): Limit Orders at Key Resistance
Place limit orders to sell 50,000 USELESS at $0.36, $0.40, and $0.44.
Why: If price pumps, you'll sell automatically at better prices. If it doesn't, you still have Tier 3.
Tier 3 Exit (25% of position): Trailing Stop or Final Dump
Set a trailing stop at 10% below the 24h high, or manually sell if volume starts collapsing or smart money wallets start exiting.
Why: This is your safety net. You're protecting the remainder of your position from a total collapse.
Result:
You've locked in 25% immediately, set up 50% to catch any upside, and protected the final 25% with an active exit plan. This is professional-level position management.
If you're trading Useless Coin on a centralized exchange (Kraken, Coinbase, KuCoin), you have access to the order book—a real-time view of buy and sell orders.
What to look for before selling:
1. Bid-Ask Spread
The difference between the highest buy order (bid) and lowest sell order (ask).
2. Bid Depth
Look at the total dollar value of buy orders within 2% of current price.
Example:
Current price: $0.33Total buy orders from $0.31-$0.33: $150,000
If you're selling $50K, you'll eat through one-third of the visible buy orders. Price will drop as you sell. Consider splitting your order.
3. Sell Wall Detection
Look for abnormally large sell orders above current price. These are "walls" that prevent price from rising.
Example:
You see a 500,000 USELESS sell order at $0.35 (current price $0.33).
What it means: Someone (likely a whale or dev) doesn't want price above $0.35. They'll keep selling to cap it. If you're trying to exit, don't expect price to push past $0.35 until that wall is cleared.
Action: Sell into strength before price hits the wall, or wait for the wall to be bought and then sell.
Here's a pro move: monitor exchange inflows from large wallets.
Large wallet → Exchange = They're preparing to sell.
How to track:
Use a blockchain explorer (Solscan for Solana) and set up alerts for transfers from top 50 wallets to known exchange deposit addresses.
What it tells you:
When a top holder moves 100K+ USELESS to Kraken, they're not depositing it to hodl—they're about to dump. You have maybe 1-6 hours before they execute the sell.
Action:
If you see multiple large wallets depositing to exchanges within 24 hours, exit your position immediately. The dump is imminent, and you don't want to be caught in it.
Real example:
During Useless Coin's October 14, 2025 peak, on-chain data showed three wallets in the top 20 moved a combined 800,000 USELESS (~$350K at the time) to exchange wallets within a 12-hour window. Price dropped 19% over the next 48 hours as they sold.
Traders monitoring exchange inflows had a 12-24 hour head start to exit before the dump.
Wash trading is when the same entity creates fake volume by trading with itself. This inflates volume metrics, making a coin look more active than it really is. It's rampant in low-cap memecoins.
How to detect it:
1. Volume-to-Holder Ratio
Ratio = 24h Volume / Number of Holders
Normal ratio: $5,000 - $50,000 per holderSuspicious ratio: >$100,000 per holder
Useless Coin check:
This is a healthy ratio. Volume is real, not wash traded.
2. Transaction Pattern Analysis
Use a blockchain explorer to look at recent trades. Check for:
3. CEX vs DEX Volume Discrepancy
Compare reported volume on centralized exchanges vs decentralized exchanges. If 90%+ of volume is on a single obscure DEX, it's likely wash traded.
Action:
If you detect wash trading, reduce your position size or avoid the token entirely. Fake volume means real liquidity is much lower than it appears, increasing your exit slippage risk.
Not all dips are created equal. Some are buyable; others are the start of a long decline.
The framework:
1. Check if smart money is buying the dip
Use Wallet Finder to see if wallets with >60% win rates are accumulating during the dip. If they are, it's likely a real dip. If they're not, it's the start of a downtrend.
2. Measure the depth of the dip
40% from high: Deep dip, likely entering Phase 4 decline (avoid)
3. Volume during the dip
Useless Coin current situation (late January 2026):
Assessment: This is a "wait and watch" zone. No clear accumulation signal yet. Don't rush to buy the dip until you see smart money re-entering or volume stabilizing with price holding.
This depends entirely on what type of trader you are and what the on-chain data is showing.
The long-term hold case:
Memecoins can have multiple pump cycles. If Useless Coin gains sustained community support, listings on major exchanges, and maintains decentralized holder distribution, it could pump again.
Requirements for a long-term hold:
Current Useless Coin assessment:
Verdict: Risky long-term hold due to whale concentration. Better suited for swing trading.
The flip strategy:
Buy during Phase 1-2, sell during Phase 3. Don't marry your bags. Take profits when the data tells you smart money is exiting.
Flip framework:
For Useless Coin specifically:
Given its volatility (45% swings in 2 days are common) and whale concentration (52.96%), this is a flip candidate, not a long-term hold. Set tight profit targets, monitor smart money daily, and don't get emotionally attached.
Jumping into the wild world of memecoins always brings up a few questions. Let's cut through the noise and give you some straight answers on what’s really going on with the useless coin price and how to navigate this market.
Honestly, there's no magic bullet. The real edge comes from combining on-chain data with market sentiment.
The strongest signal is often smart money. Watching wallets with a history of winning trades as they start buying or selling is the closest thing you’ll get to a crystal ball. Tools that catch these moves give you a massive advantage. Keep an eye on big jumps in trading volume and shifts in token holder distribution, too—those are often the tremors before the earthquake.
You have to be paranoid, but a smart kind of paranoid. Here's a quick safety checklist:
In the memecoin space, trust is earned through transparency. Verifiable on-chain data, like locked liquidity and decentralized holder distribution, is your best defense against scams and manipulation.
That really comes down to your own appetite for risk. But a much better question is, "What is the on-chain data telling me right now?"
Are the smart money wallets still accumulating, or are they starting to cash out? Is the trading volume healthy and picking up steam? Use on-chain tools to figure out where we are in the cycle. Buying in after a massive pump is just asking for trouble. A smarter move is to see if profitable wallets are building a new position and mirror their entry.
Stop guessing and start tracking. Wallet Finder.ai gives you the on-chain intelligence to see what smart money is doing in real-time. Discover profitable traders, get instant alerts, and mirror their strategies before the market moves. Find your edge at https://www.walletfinder.ai.

A premier DeFi analytics platform empowering traders to discover and analyze profitable blockchain wallets, trades and tokens.

