
Recovery Factor Calculation for Smart Traders
Master the recovery factor calculation to measure a strategy's resilience. Learn the formula, see DeFi examples, and find top wallets with Wallet Finder.ai.

June 20, 2026


Wallet Finder
March 10, 2026

In decentralized finance (DeFi), if you want to quickly gauge a protocol's health and scale, there’s one number you look at first: Total Value Locked (TVL).
Think of it like checking a bank's total deposits. It’s a straightforward metric that tells you how much capital the community has collectively entrusted to a specific DeFi application. A higher TVL often signals greater user trust, deeper liquidity, and more activity.
So, what exactly is TVL? At its heart, it’s the total dollar value of all the crypto assets currently locked within a DeFi protocol's smart contracts.
These assets aren't just sitting there gathering dust. They're being put to work—staked to secure a network, deposited into a lending protocol, or used to provide liquidity for a trading pool. When you see a protocol with a $1 billion TVL, it means users have parked that much capital on the platform, signaling they believe it's secure and offers a valuable service.
To really get what TVL means, you need to understand what counts toward that final number. It’s a mix of different assets, all valued in real-time.
The main ingredients include:
Basically, if a crypto asset is committed to a protocol and can't be immediately withdrawn, it contributes to its TVL. This simple sum gives you a powerful snapshot of a platform’s financial footprint at any given moment.
Total Value Locked is more than just a number; it’s a measure of collective confidence. It reflects the willingness of thousands of users to commit their capital to a protocol, signaling its perceived utility and security in the market.
The math behind TVL is actually pretty simple. You take the total amount of each token locked in a protocol, multiply it by its current market price, and then add it all together.
For example, imagine a lending platform holds 10,000 ETH (with ETH priced at $2,000) and $5 million in USDC stablecoins. The TVL would be (10,000 ETH * $2,000/ETH) + $5,000,000 USDC, which equals $25 million. You can learn more about how different assets contribute to TVL on CoinMarketCap.
To make it even clearer, here’s a quick breakdown of the core concepts.
This table breaks down the essential components of Total Value Locked into simple terms.
ConceptSimple ExplanationExampleLocked AssetsAll crypto tokens (ETH, SOL, USDC) deposited by users.A user deposits 10 ETH into a lending protocol.Current Market PriceThe real-time USD value of each locked asset.The price of ETH is $3,500 at the time of deposit.Total ValueThe sum of the USD value of all locked assets.The protocol's total TVL is the sum of all deposits.
Understanding these three pieces is all you need to grasp how TVL works. It’s a dynamic figure that changes constantly with both new deposits and the fluctuating prices of the underlying assets.
Okay, so you get the "what" of TVL. Now, let's pull back the curtain and see how this number actually gets calculated. At its heart, the math for a single DeFi protocol is pretty simple—think of it like tallying up the total value of a diverse stock portfolio.
First, you identify every single crypto asset locked up in the protocol's smart contracts. This could be anything from majors like ETH and SOL to stablecoins like USDC and DAI. You take the total amount of each asset and multiply it by its current market price.
Add all those individual dollar values together, and voilà—you get the protocol's Total Value Locked. It’s a real-time snapshot of all the capital users have trusted it with.
Let's make this real. Imagine a decentralized lending protocol where users have deposited three different assets.
Here’s how the TVL math would break down:
That simple arithmetic is exactly how every protocol’s TVL gets figured out.
This whole calculation hinges on one thing: accurate, live price data. DeFi protocols can't just guess the price of ETH; they rely on services called price oracles. Think of platforms like Chainlink or Pyth as the data feeds that pipe reliable market prices directly into smart contracts.
Without trustworthy price oracles, TVL calculations would be a mess—inaccurate and easy to manipulate. These services are the unsung heroes making sure the data we use to judge a protocol's health is actually correct.
Now, while each protocol can calculate its own TVL, most of us get our data from massive aggregators. Platforms like DeFiLlama are constantly running these calculations for thousands of protocols across dozens of blockchains, giving us a bird's-eye view of the entire ecosystem.
The flow is simple: users deposit assets, and those assets immediately contribute to the protocol's TVL.
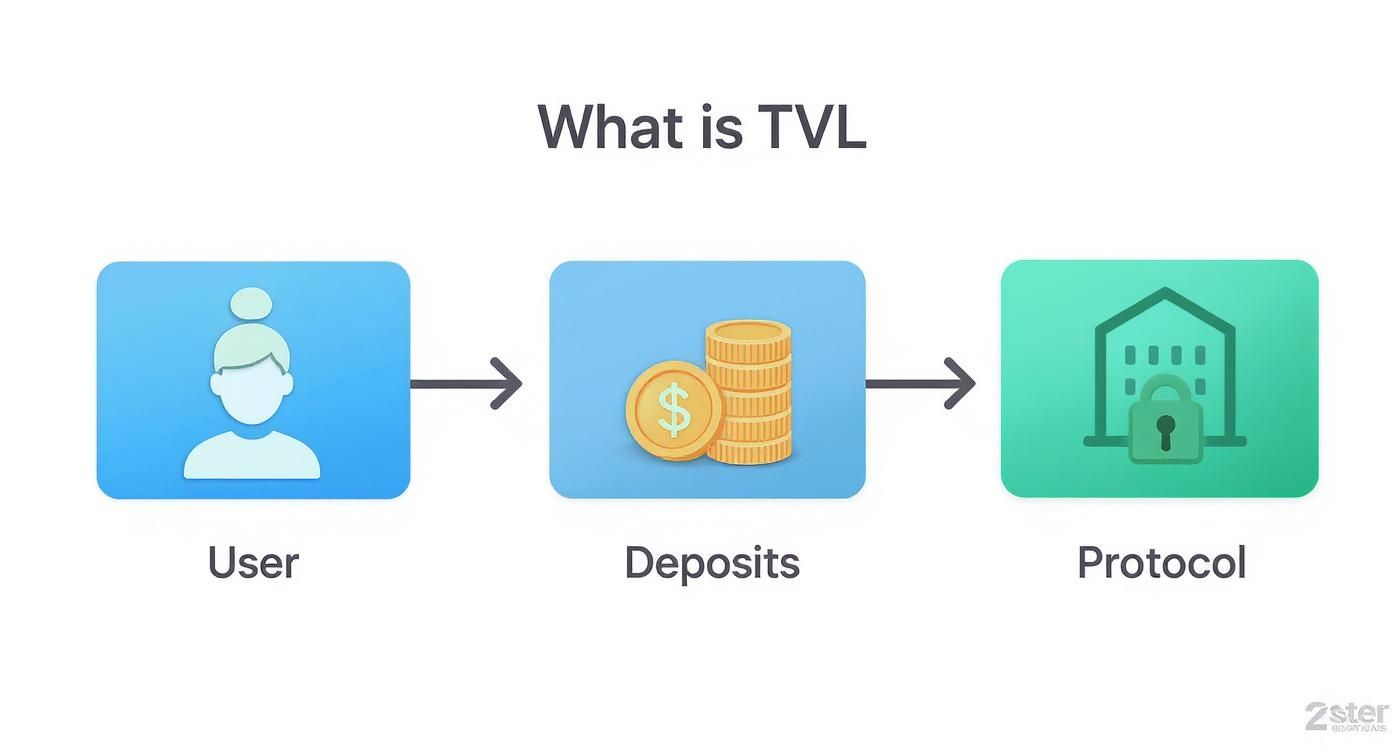
This diagram shows the journey from your wallet right into the protocol's shared pool of capital.
So how do we get the TVL for an entire blockchain, like Ethereum or Base? It's the same logic, just on a much bigger scale. Data aggregators simply add up the TVLs of every single DeFi protocol running on that chain.
For example, Ethereum's TVL is the sum of all the assets locked in Uniswap, Aave, Lido, MakerDAO, and the hundreds of other apps built on its network. This chain-level TVL is a powerful gauge of a blockchain's overall health and its dominance in the DeFi world.
Because TVL is tied directly to asset prices and user activity, it's constantly changing. It goes up and down as people deposit or withdraw funds and as token prices fluctuate, creating a living, breathing measure of capital flow across DeFi.

A protocol's Total Value Locked isn't just a static number on a dashboard; it's the living, breathing pulse of market sentiment and user activity. Learning to read its ups and downs is like learning to read a story unfolding in real-time on the blockchain.
Every fluctuation tells you something about the collective belief of thousands of users. A steady climb or a sudden nosedive offers powerful clues about a project's health, its appeal to the market, and how secure people think it is.
When a protocol's TVL is climbing, it's usually great news. Think of it as a vote of confidence from the market. This upward momentum can be sparked by a few different things, each telling a slightly different story about the protocol's success.
A sustained rise in TVL is often the sign of a project hitting its stride and building a loyal community.
Here are the most common drivers behind a TVL increase:
On the flip side, a falling TVL can be a major red flag that deserves a closer look. But just like a rising TVL, a drop can happen for many reasons—some are harmless market cycles, while others point to serious, project-specific problems.
The key is to figure out the why behind the drop. Is it part of a broader market downturn dragging everyone down, or is capital specifically fleeing this project?
A declining TVL isn't always a catastrophe, but a sharp, isolated drop is a clear signal to investigate further. It could be an early warning of underlying problems that the broader market hasn't noticed yet.
Common reasons for a drop in TVL include:
A critical skill for any on-chain analyst is telling the difference between real, sustainable growth and a temporary, incentive-fueled spike. A protocol can easily launch a liquidity mining program with massive short-term rewards, causing its TVL to shoot for the moon.
But this "mercenary capital," as it's often called, usually vanishes the second the rewards dry up. True, sustainable growth is slower and steadier. It's built on a protocol’s genuine utility, a strong community, and a product people want to use even without insane short-term incentives.
TVL is a vital sign for the health, liquidity, and adoption of DeFi protocols and entire blockchain ecosystems. High and steady TVL points to a robust platform with a strong user base, while sudden drops can warn of a crisis of confidence. You can discover more about how TVL reflects protocol health on GoMining's blog.
By looking at where the capital is coming from and how long it sticks around, you can make a much better call on whether a project is building something that will last or just enjoying its fifteen minutes of fame.
Total Value Locked is a powerful lens for sizing up the DeFi landscape, but its true magic appears when you start comparing it across different blockchains. Not all TVL is the same. The story behind the numbers reveals the unique strengths, priorities, and user bases of competing chains.
A high TVL on one network might come from lending markets, while another might be dominated by decentralized exchanges. Digging into why the capital is there tells you everything.
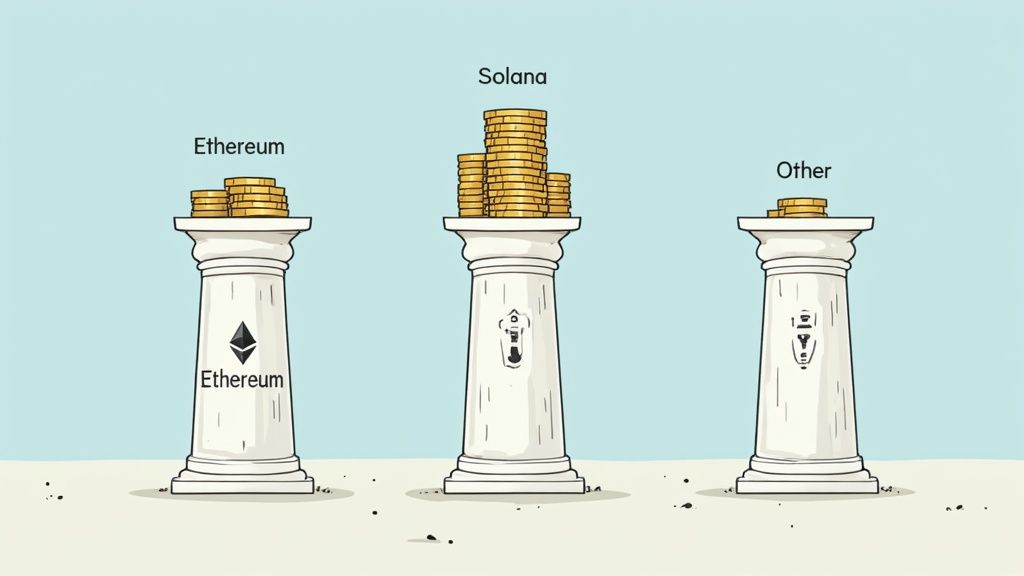
For a long time, Ethereum has been the undisputed heavyweight champion of DeFi. Its first-mover advantage and massive developer community created a network effect that was impossible to ignore, sucking in billions of dollars in capital. This early lead cemented its role as the foundational layer for many of DeFi’s most important protocols.
While Ethereum still wears the crown, the crypto world is anything but a monopoly. A whole host of competitors—often called "alt-L1s" (alternative Layer 1s)—have jumped into the ring, each with its own trade-offs. Blockchains like Solana, Base, and Avalanche have pulled in significant TVL by offering lower fees and faster speeds, making them perfect for high-frequency trading and apps that everyday users can actually afford to use.
As of early 2025, Ethereum remains the dominant force, with a TVL topping $60 billion. This reflects its deep roots and the sheer variety of protocols built on its network.
But look elsewhere, and you see a different picture. Cardano, for example, held around $500 million in TVL at the start of 2025. That's a huge difference, and it highlights just how much ecosystems can vary in maturity and user trust. You can find more TVL distribution data on Bitcoin.com Markets.
This divergence shows that different chains are building their own unique identities. One might become the go-to spot for decentralized perpetuals trading, while another carves out a niche in NFT marketplaces or liquid staking. By analyzing what is driving the TVL on each chain, you get a clear sense of its core purpose and where the real action is.
To put this all into perspective, let's look at a quick comparison. This table gives a high-level view of how capital is distributed and what kind of activities are popular across a few major networks.
BlockchainApproximate TVLTop Protocol by TVLPrimary Use CaseEthereumHighLido (Liquid Staking)Liquid staking, lending, DEXsSolanaMediumMarinade (Liquid Staking)High-speed trading, DeFi appsBaseGrowingAerodrome (DEX)SocialFi, DEXs, new projectsAvalancheMediumAave (Lending)Enterprise DeFi, gaming
This comparison makes one thing crystal clear: while the total TVL number is a good starting point, the composition of that TVL is far more revealing.
A chain’s real value isn't just about how much money it holds, but what users are actively doing with that money. To truly answer "what is tvl" for any ecosystem, you have to look past the total and understand the apps and user behaviors that give the number its meaning.
While Total Value Locked is a great starting point for sizing up a DeFi protocol, treating it as the only measure of health is a classic rookie mistake. It's a big, impressive number, but it has some serious blind spots and can be shockingly easy to game. Relying on TVL alone is like judging a company's success just by the cash in its bank account—you're completely ignoring its profits, debts, or whether its business model even makes sense.
To really get the story, you have to look past the flashy TVL figure. A high number can create a false sense of security, hiding huge risks that could put your funds on the line. Understanding these limitations is the first step to becoming a sharper on-chain analyst.
One of the biggest illusions in TVL, especially when you zoom out to the entire blockchain level, is double-counting. This happens all the time in DeFi's "money lego" system, where the same asset gets counted over and over as it moves between different protocols.
Here’s a simple example:
The result is that your initial 10 ETH now looks like 20 ETH of value locked on-chain. This inflates the blockchain’s total TVL and gives you a distorted picture of how much unique capital is actually securing the ecosystem.
Shady actors can, and do, manipulate TVL to make their project look bigger and more trustworthy than it is. A common trick involves wash trading or using low-utility tokens created by the project’s own team to pump up the numbers.
It usually plays out like this:
This trick creates a massive TVL that fools investors into thinking there's real traction, even when very little legitimate, external capital is actually involved.
TVL might show how much capital is parked in a protocol, but it says zero about whether its token will actually perform. You can have billions "locked," but that doesn't mean the token has any real value or won't dump to zero.
At its core, TVL is a measure of capital accumulation, not a scorecard for performance or sustainability. A huge TVL tells you nothing about the fundamentals.
Think about all the critical pieces of the puzzle it leaves out:
In fact, recent studies have busted the myth that high TVL leads to strong token returns, finding no real correlation. This just hammers home the point: you have to pair TVL with other, smarter metrics. For a more complete toolkit, our guide on the top metrics for liquidity pool performance is a great next step. TVL is just one piece of a much larger puzzle.
Not all TVL tells the same story. A billion dollars locked in a lending protocol represents a fundamentally different kind of user behavior and risk profile than a billion dollars locked in a decentralized exchange or a liquid staking platform. When you learn to read TVL through the lens of protocol category, the number stops being a generic confidence signal and starts giving you specific, actionable intelligence about what participants in that ecosystem are actually doing with their capital.
This distinction matters enormously for on-chain researchers and traders alike. The type of activity generating a protocol's TVL determines how sticky that capital is, how sensitive it is to market conditions, and what it signals about broader DeFi sentiment. Treating all TVL as interchangeable is one of the most common analytical mistakes in the space, and correcting it immediately sharpens the quality of every research conclusion you draw.
When you see a high TVL figure on a lending protocol like Aave, Compound, or Spark, you are looking at a direct measurement of market participants' appetite for leveraged exposure. Lenders deposit assets to earn yield from borrowers, and borrowers post collateral to access capital they deploy elsewhere, typically into other DeFi strategies or leveraged long positions.
Lending TVL therefore functions as a proxy for how much leverage the market is currently willing to carry. When lending TVL rises sharply, it often signals that traders are borrowing aggressively, frequently to amplify exposure to assets they expect to appreciate. This is a moderately bullish signal when sustained, because it reflects confidence in continued price appreciation. However, it also indicates that the market is becoming increasingly leveraged, which raises the potential severity of a forced deleveraging event if prices reverse.
The utilization rate, which is the ratio of borrowed assets to total supplied assets, adds another layer of context to lending TVL. A protocol with $5 billion in TVL but only 30% utilization is sitting on a lot of idle capital. A protocol with $3 billion in TVL and 80% utilization is operating at near-maximum capacity, which drives higher interest rates for borrowers and higher yields for lenders. Utilization rate is the metric that lending TVL alone cannot tell you, and checking it always improves your analysis of what the number actually represents.
When lending TVL drops sharply and quickly, the most common cause is forced liquidations cascading through the system. Large borrowers get their collateral liquidated as prices fall, which reduces both the collateral side and the borrowing side of the protocol's balance sheet simultaneously, compressing TVL faster than a simple price decline would. Spotting this pattern early gives traders useful intelligence about the severity of a market downturn and the likelihood of further selling pressure from liquidation cascades.
Total Value Locked in decentralized exchanges measures something meaningfully different from lending TVL. When liquidity providers deposit assets into a DEX pool, they are expressing a view that the assets in that pair will continue to generate trading volume and that the fee income will justify their exposure to impermanent loss. DEX TVL is therefore a combined signal of trading activity expectations and LP confidence in the underlying token pairs.
Rising DEX TVL in a specific token pair is one of the clearest on-chain signals that market participants expect sustained trading interest in that token. When sophisticated LPs add liquidity, they are implicitly saying they expect enough volume to generate fee revenue over their holding period. When they withdraw en masse, they are signaling the opposite. Watching liquidity depth changes in specific pools, particularly for newer or smaller tokens, can reveal early information about market maker confidence that precedes visible price action by days or even weeks.
The composition of DEX TVL also tells you about market structure. A DEX ecosystem where most TVL is concentrated in stablecoin-to-stablecoin pools reflects a market in defensive mode, where participants want to earn yield without volatile asset exposure. A DEX ecosystem where most TVL is in high-volatility altcoin pairs reflects a risk-on market where LPs are willing to accept impermanent loss exposure in exchange for high fee income from active trading. Reading the distribution of DEX TVL across pool types gives you a real-time read on market sentiment that no price chart can replicate.
Liquid staking protocols like Lido, Rocket Pool, and Jito occupy a special category in TVL analysis because their capital is structurally the stickiest and least sensitive to short-term market conditions. When a user deposits ETH into Lido and receives stETH, they are making a long-duration commitment to the Ethereum network. They are not chasing a yield farming incentive that will end in 30 days. They are expressing a fundamental belief in the long-term value of Ethereum's proof-of-stake security model.
Liquid staking TVL therefore functions as the baseline confidence layer of any proof-of-stake blockchain's DeFi ecosystem. When this number is growing, it signals that long-term holders are actively putting their assets to work rather than sitting on idle tokens, which is a structurally bullish signal for network security and ecosystem depth. When it stagnates or declines, it can indicate that long-term believers are losing conviction or rotating to competing networks.
The distinction between liquid staking TVL and other categories also explains much of the double-counting problem discussed earlier. Because staked assets like stETH are themselves deposited into lending protocols and DEX pools as collateral and liquidity, they get counted multiple times in aggregate blockchain TVL figures. Understanding which portion of an ecosystem's TVL originates in liquid staking tokens helps you identify how much of the headline number represents genuinely distinct capital versus recycled exposure to the same underlying asset.
Bridge TVL is one of the most underutilized signals in on-chain analysis. It measures the total value of assets locked in bridge contracts that facilitate the movement of tokens between different blockchain networks. When bridge TVL on a specific route rises, capital is flowing from one ecosystem to another, and that flow carries directional information about where sophisticated participants are choosing to deploy.
A sustained increase in bridge TVL flowing from Ethereum mainnet to a specific Layer 2 network, for example, tells you that users and protocols are finding enough reason to move capital onto that chain despite the friction and gas costs of bridging. This is a more intentional signal than a TVL increase driven by price appreciation, because it represents a deliberate allocation decision rather than a passive consequence of market movement.
Monitoring bridge TVL trends across major chains gives traders early visibility into ecosystem momentum shifts before those shifts are fully reflected in token prices or protocol TVL rankings. When capital consistently bridges into a network faster than it bridges out over a multi-week period, that net inflow is a meaningful leading indicator of growing developer and user activity that tends to precede token appreciation.
Knowing what Total Value Locked means is one thing, but actually using it to make smarter trades is a whole different ballgame. It's time to turn that raw data into actionable intelligence. When you know what to look for, TVL becomes a powerful lens for spotting genuine opportunities and sidestepping potential risks.
Instead of just glancing at the big headline number, you can use TVL to size up competing protocols, get a read on market sentiment, and even find assets that might be mispriced. The trick is to stop being a passive observer and start actively digging into the data. That means using tools like DeFiLlama not just to see a number, but to understand the story behind it.
One of the most straightforward ways to leverage TVL is to hunt for projects with strong, consistent growth. A protocol whose TVL is on a steady upward climb is a clear sign that it’s earning the trust of users and capturing market share. That kind of organic growth is infinitely more telling than a sudden, one-off spike.
Here’s a simple workflow you can use to start finding these gems:
Following this process helps you quickly build a shortlist of protocols that are gaining legitimate traction. It's a fundamental first step in any solid on-chain analysis strategy.
Ready to level up? A more advanced technique is to compare a project's TVL to its market capitalization. This simple ratio can be a fantastic tool for spotting potentially undervalued or overvalued assets. It all boils down to one question: how much capital is locked in the protocol versus what the market thinks the entire project is worth?
The formula is dead simple: Market Cap / TVL.
This ratio isn't a magic bullet, but it's an incredibly powerful filter. A low ratio should immediately make you ask why. Does the protocol have terrible tokenomics? Is it generating zero revenue? Or is it a hidden gem that the market has completely overlooked?
To truly get ahead of the curve, you need a system. Manually checking dashboards every day just isn’t going to cut it. The smart move is to build a simple workflow to monitor the protocols you care about.
This is where platforms like Wallet Finder.ai come into play. While it’s not a direct TVL alert system, you can track the on-chain movements of smart money wallets that interact with a protocol—giving you a powerful early signal.
When you see top traders start depositing huge sums into a protocol, that's a massive vote of confidence that often comes right before a big jump in TVL. By setting up a watchlist of key wallets or protocols, you can get real-time notifications and react instantly to significant capital flows.
As you get more comfortable with Total Value Locked, a few common questions always pop up. Let's run through them to sharpen your understanding and make sure you’re using the metric like a pro.
It’s easy to mix these two up, but they tell completely different stories.
MetricWhat It MeasuresWhat It RepresentsMarket CapTotal value of all circulating tokens (Price x Supply).Market sentiment, speculation, and future growth potential.TVLTotal value of assets locked inside a protocol's smart contracts.User trust, liquidity, and current platform utility.
A project can have a sky-high market cap fueled by hype but a tiny TVL, which is a red flag suggesting nobody's actually using the thing. The flip side is also true, making the TVL-to-Market Cap ratio a powerful gut check for analysts.
Absolutely not. Let's be crystal clear on this: a high TVL indicates user trust and deep liquidity, but it is not a security guarantee. If anything, it just paints a bigger target on the protocol's back for hackers.
DeFi's history is littered with the ghosts of protocols that had billions in TVL before a single smart contract bug led to a catastrophic exploit.
Always pair TVL analysis with your own digging. Check for security audits, look into the team's reputation, and understand how the protocol is built. A high TVL means it's popular, not invincible.
Bottom line: never deposit your funds into a DeFi protocol based on its TVL alone. Do your own homework, every single time.
For this, you'll want to use an on-chain data aggregator, which is the industry-standard tool. It’s pretty straightforward.
This is the exact method pros use to watch capital move around DeFi in real-time.
The TVL-to-market cap ratio, often expressed as the market cap divided by TVL, is one of the most widely used relative valuation tools in DeFi research. It compares what the market collectively believes a protocol is worth against the actual capital the protocol is securing and putting to work. The interpretation depends heavily on context, but there are general benchmarks that give you a useful starting orientation.
A ratio below 1.0 means the protocol's market cap is lower than its TVL, suggesting the market is ascribing less value to the project than the capital entrusted to it would imply. This can indicate undervaluation, particularly for established protocols with strong revenue and user metrics. It can also indicate that the market has correctly assessed structural problems with the tokenomics, revenue model, or long-term sustainability of the yield being offered. Low ratio alone is not a buy signal. It is an invitation to investigate whether the discount is deserved or overlooked.
A ratio significantly above 1.0 means the protocol's market cap far exceeds the capital it secures, which implies the market is pricing in substantial future growth. This is common for early-stage protocols with rapidly growing TVL, strong developer activity, and a narrative that captures speculative interest. It becomes a red flag when the ratio expands not because the protocol is delivering on that growth promise but because speculative buying has pushed the token price far ahead of any fundamental improvement. The most useful application of this ratio is not to make a single buy or sell decision but to compare it against the historical range for a specific protocol and against peers in the same category to identify relative mispricing.
TVL and bear markets interact through two distinct mechanisms that are important to separate analytically. The first is price-driven TVL compression, which is passive and does not necessarily indicate anything alarming about a protocol's user base. When the price of assets locked in a protocol falls, the dollar value of the TVL falls proportionally even if not a single user has withdrawn a single token. A protocol holding 100,000 ETH that was worth $400 million when ETH traded at $4,000 will show a TVL of $200 million when ETH trades at $2,000, even with identical deposits. This kind of TVL decline is mechanically inevitable in a bear market and does not represent capital flight.
The second mechanism is withdrawal-driven TVL compression, which is the meaningful signal you want to monitor. When TVL falls faster than the underlying asset prices, it means users are actively withdrawing capital rather than just passively watching the dollar value of their deposits decline. This is what you watch for during a bear market, because the spread between price-driven and withdrawal-driven TVL decline tells you how much genuine user confidence the protocol is retaining.
A protocol that maintains its token count, even as the dollar TVL falls, is retaining its user base through a down market. That stickiness is strong evidence that users are committed to the protocol's utility rather than just chasing yield in a bull market. When evaluating protocols during or after a bear market, comparing the peak token count in the protocol against the current token count gives you a much cleaner signal of user retention than comparing dollar TVL figures across different price environments.
TVL figures for Layer 1 blockchains like Ethereum and Solana and Layer 2 networks like Arbitrum, Optimism, and Base reflect meaningfully different things about how capital is being used, even though they are calculated using the same method.
Layer 1 TVL represents capital that has been committed to the base security layer of a blockchain. The assets locked in Ethereum's DeFi ecosystem are secured directly by Ethereum's consensus mechanism, which has the largest validator set and the longest operational track record of any proof-of-stake network. TVL on a Layer 1 carries the lowest bridge risk, because the assets never had to cross a bridge contract to get there. The trade-off is typically higher transaction costs, which limits certain use cases and tends to concentrate L1 TVL in larger positions and more capital-intensive strategies like liquid staking and institutional lending.
Layer 2 TVL represents capital that originated on a Layer 1 but was moved through a bridge contract to a faster, cheaper execution environment. The economic activity happening on the Layer 2 benefits from lower gas fees and higher throughput, but every asset in a Layer 2's TVL carries bridge contract risk that does not exist for native L1 deposits. As Layer 2 networks mature and their bridge contracts accumulate years of battle-tested operation without exploits, this distinction becomes less practically significant for established networks. It remains very relevant for newer Layer 2s whose bridge contracts have not yet been stress-tested by adversarial conditions at scale. When comparing TVL figures across L1 and L2 networks, always factor in the maturity and audit history of the bridge infrastructure that underlies the Layer 2's capital base.
Want to see where smart money is heading before it gets locked up and reflected in TVL charts? With Wallet Finder.ai, you can track the top wallets in real-time, get instant alerts on their trades, and spot opportunities before the crowd catches on. Start your 7-day trial and turn raw on-chain data into your competitive edge at https://www.walletfinder.ai.

A premier DeFi analytics platform empowering traders to discover and analyze profitable blockchain wallets, trades and tokens.

