
Recovery Factor Calculation for Smart Traders
Master the recovery factor calculation to measure a strategy's resilience. Learn the formula, see DeFi examples, and find top wallets with Wallet Finder.ai.

June 20, 2026


Wallet Finder
April 13, 2026
You’re probably staring at the same screen every crypto trader has stared at after a violent drawdown. Portfolio down. Twitter split between doom and moon calls. Price bouncing just enough to create hope, then fading again.
That’s usually when the wrong question takes over. A common question asked is, will the crypto market recover. A better question is: what does a real recovery look like before price confirms it?
Recovery doesn’t start with headlines. It starts with a sequence. Macro pressure eases. Strong assets stop making lower lows. Institutional flows hold up during fear. Then on-chain behavior shifts. The best wallets accumulate before the crowd feels safe.
That sequence matters more than any single prediction. If you treat recovery as a process instead of an event, you stop waiting for certainty and start tracking evidence.
A recovery usually begins while the market still feels broken. Price stops cascading, weak holders finish selling, and capital with a longer time horizon starts buying into fear before the broader market is willing to call a turn.
That setup is why timing a recovery with headlines is a losing approach. By the time the narrative feels safe, the highest-conviction positioning is often already done. Traders need a framework that tracks conditions early, then tests whether those conditions are being confirmed by real wallet behavior.
I focus on three layers.
First, the market needs room to recover. Liquidity pressure has to ease, policy risk has to stop getting worse, and access for larger pools of capital has to remain open. Those forces shape whether a bounce can turn into a sustained repricing or stay trapped as a short-covering rally.
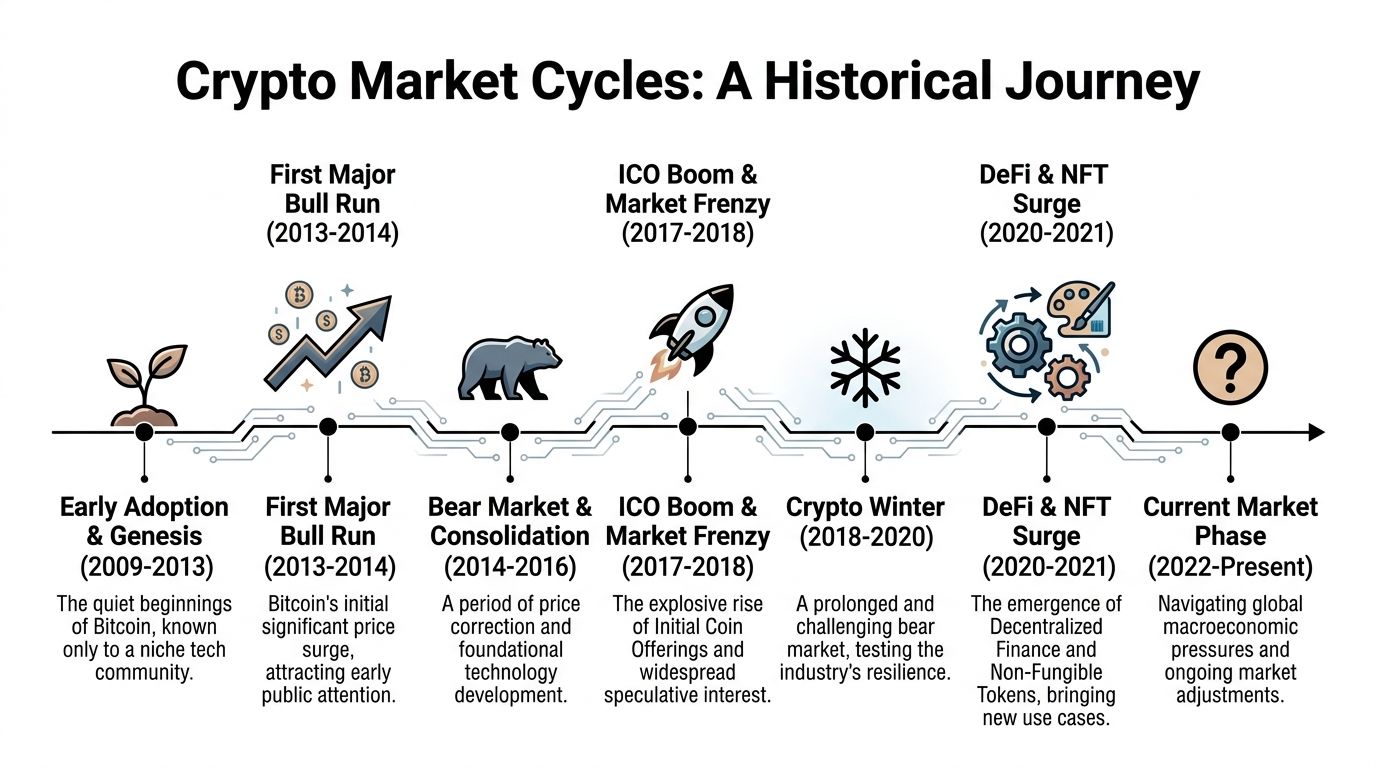
Second, price structure has to improve in a way that reflects absorption rather than hope. That means watching whether major assets stop printing fresh lows on heavy fear, whether breakdowns fail to follow through, and whether dips are bought faster than they were during the prior leg down. Traders who use a crypto market cycle chart to map where sentiment and structure tend to shift can frame that transition more clearly.
Third, on-chain behavior has to confirm that stronger hands are stepping in. This is the part generic recovery articles usually miss. A market can look better on a weekly chart and still lack conviction under the surface. What matters is whether high-quality wallets are accumulating spot exposure, whether stablecoins are being redeployed into risk, and whether smart money is buying weakness instead of chasing green candles.
That distinction changes execution.
If macro pressure stabilizes and price holds, but experienced wallets remain inactive, the move is still fragile. If macro pressure stabilizes, price holds, and tracked wallets begin accumulating before sentiment resets, the probability of a real recovery improves sharply. Wallet Finder.ai matters here because it lets traders move from abstract bullishness to observable behavior: which wallets are buying, how often they add, what sectors they rotate into, and whether that activity spreads beyond a handful of addresses.
A useful rule is simple. Treat recovery as a checklist, not a prediction. Conditions improve first. Structure follows. Wallet behavior confirms. The traders who act early are usually the ones watching all three at the same time.
Monday opens with a hot CPI print, Treasury yields jump, Bitcoin trades lower in the first hour, and Crypto Twitter declares the recovery dead. By the close, spot ETFs have still taken in net capital and several high-conviction wallets have added on weakness. That is the kind of session that matters. Recovery often starts when macro headlines stay noisy but forced selling stops getting cleaner follow-through.
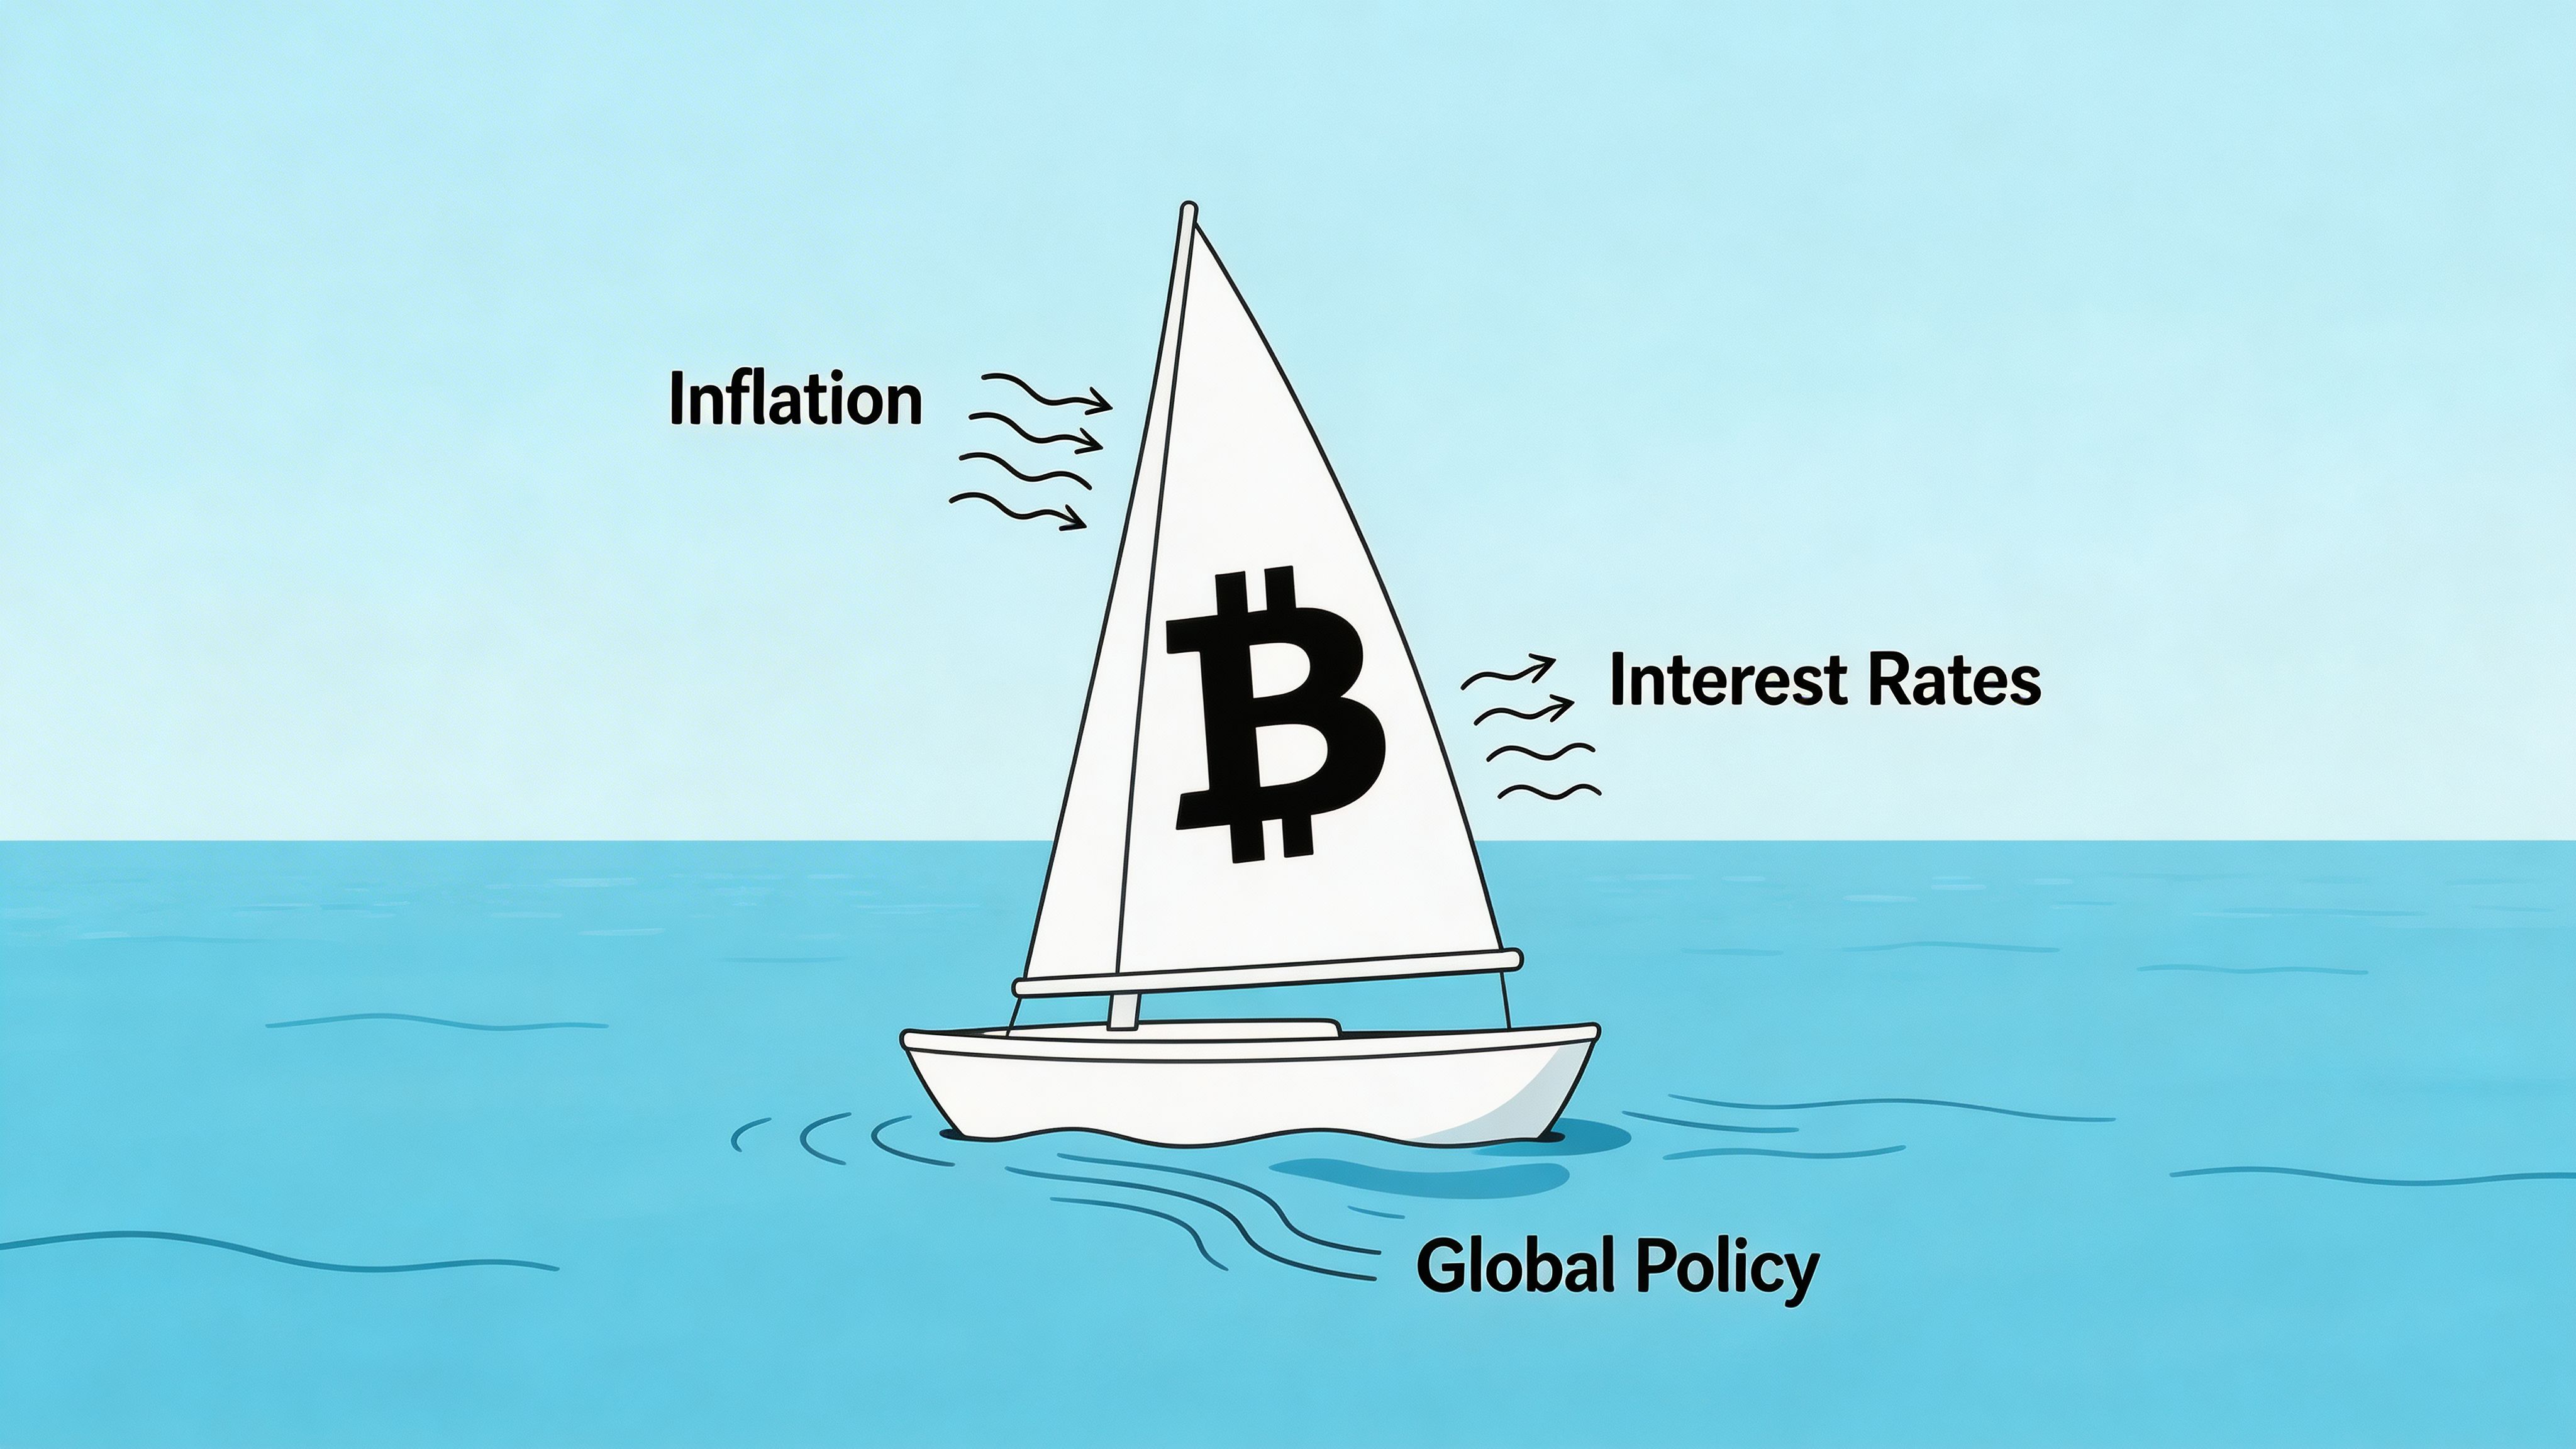
Crypto remains highly sensitive to real rates, dollar strength, and broad financial conditions because it sits far out on the risk curve. When liquidity tightens, weak hands sell first, borrowed capital quickly exits the market, and correlations with other risk assets usually rise. A durable recovery usually begins only after those macro pressures stop intensifying.
The useful question is not whether the Federal Reserve sounds friendly on any given day. It is whether capital keeps showing up during stress. US spot bitcoin ETFs publish daily flow data, which gives traders a direct read on whether institutional demand is absorbing supply or stepping away. You can monitor those creations and redemptions through public issuers, exchange data, and a disciplined on-chain analysis framework for identifying accumulation behavior.
That distinction matters in practice. If Bitcoin drops on a macro scare and ETF flows stay firm, the selloff is often distribution from weaker holders into patient capital. If price drops and those flows reverse at the same time, the market usually needs more time.
Traders often overfocus on whether regulation is bullish or bearish in the abstract. The more useful frame is access. Does a policy change make it easier for advisers, funds, corporates, and banks to hold the asset within their mandate?
That is why product approvals, custody clarity, and reporting standards matter more than headline tone. They expand the buyer base. In crypto, recoveries become stronger when capital moves from opportunistic trading desks to slower pools of money that can hold through volatility.
The non-obvious read is timing. Regulatory progress rarely marks the exact bottom. It changes the quality of future demand. That tends to matter more in the middle phase of a recovery than at the first bounce.
Macro is not only about central banks. Within crypto, major network upgrades can act like internal rate changes because they alter expected yield, security assumptions, and capital efficiency.
Ethereum is the clearest example. When staking economics improve, validator operations become more efficient, or execution risk falls, allocators may revisit ETH exposure even if Bitcoin remains the macro bellwether. That does not guarantee immediate upside. It does increase the odds that a Bitcoin-led rebound broadens into a sector-wide recovery instead of stalling as a single-asset move.
Breadth is the signal to watch. A market is healthier when capital rotates by thesis rather than crowding into the one asset perceived as safest.
I reduce the macro backdrop to four questions:
Crypto does not need perfect macro conditions to recover. It needs macro pressure to stabilize while stronger buyers absorb supply.
Macro analysis helps set the backdrop, but execution improves when you connect the backdrop to wallet behavior. If ETF flows are positive on a risk-off day, the next question is whether experienced on-chain wallets are also accumulating, rotating into leaders, or rebuilding exposure after de-risking. That is where traders get an edge before the broader narrative catches up.
| Macro factor | Why it matters | What a constructive read looks like |
|---|---|---|
| Financial conditions | Determines how much pressure sits on speculative assets | Conditions stop tightening even if they remain restrictive |
| ETF flows | Shows whether institutional demand is absorbing weakness | Inflows or stable demand during down days |
| Regulatory access | Expands the set of buyers allowed to participate | Better custody, clearer rules, easier product access |
| Protocol catalysts | Creates asset-specific reasons for capital to rotate | Renewed interest beyond Bitcoin alone |
Used together, these signals help separate noise from regime change. Macro sets the environment. The earliest tradable clue is often whether real buyers keep showing up anyway.
A trader who buys the first green weekly candle after a brutal selloff usually feels early. In crypto cycle terms, that trader is often late. The larger returns tend to come from the stretch before confidence returns, when price stops making lower lows, stronger assets hold support on retests, and informed wallets start rebuilding exposure while public sentiment still treats every bounce as suspect.
Crypto’s major recoveries rarely begin with clarity. They begin with exhaustion.
You can see that clearly in Bitcoin’s last full cycle. It fell from its 2021 peak near $69,000 to roughly $16,000 in late 2022, then recovered to new highs above its prior peak in 2024, based on historical price data from CoinMarketCap’s Bitcoin price history. The point is not that every drawdown resolves on the same timetable. The point is that severe damage has repeatedly been followed by a period where price improves well before trust does.
That gap matters for positioning. Traders who wait for a comfortable narrative usually enter during phase four and miss the cleaner risk-reward in phase three.
I break the cycle into four behavioral phases:
Euphoria
Price strength gets mistaken for safety. Traders add risk because the market has been rewarding impatience.
Crash
Forced selling resets the board. Weak balance sheets, crowded positioning, and shallow liquidity get exposed at once.
Accumulation
Volatility compresses after panic, but conviction stays low. Stronger participants start absorbing supply, usually in uneven bursts rather than a clean trend.
Recovery
Market structure improves across higher lows, level reclaim attempts, and better relative strength in leaders. Sentiment catches up later.
Accumulation is the phase that matters most because it is where the market starts to reveal who wants inventory. Price alone gives an incomplete read. The better question is whether dips are still triggering disorderly exits, or whether they are getting bought by wallets with a history of scaling in before trend confirmation.
Every major crypto drawdown feels unique while it is happening. The useful work starts after the panic, when you compare post-crash behavior across cycles.
Three signals tend to show up early in durable recoveries:
That framework is more useful than arguing over whether the latest shakeout was unusually severe. Severity tells you how much pain the market just absorbed. Recovery odds improve when the market absorbs fresh stress without making materially lower lows.
For a visual reference on how accumulation and recovery usually fit inside the broader rhythm, this crypto cycle chart explainer adds useful context to raw price action.
Markets usually bottom when marginal sellers are exhausted and stronger buyers start treating weakness as inventory, not danger.
History gives a playbook, not a schedule.
A few lessons show up repeatedly:
That last point is where cycle analysis becomes actionable. If you pair market structure with wallet behavior, you can test whether accumulation is real instead of relying on headlines or broad social sentiment. Wallet Finder.ai is useful here because it lets traders track whether smart-money wallets are buying leaders on weakness, rotating from stables into risk, or adding back exposure after de-risking earlier. Those are the behaviors that often appear before a recovery becomes obvious on a chart.
| Cycle phase | What price usually does | What sentiment usually does | What traders should do |
|---|---|---|---|
| Euphoria | Extends far above trend | Gets complacent | Reduce chase risk and define exits |
| Crash | Breaks support fast | Turns defensive | Cut weak names and monitor liquidation pressure |
| Accumulation | Builds a base with failed breakdowns and retests | Stays doubtful | Track leaders, watch wallet accumulation, wait for reclaimed levels |
| Recovery | Trends higher with stronger follow-through | Improves slowly | Add on confirmation and manage entries around pullbacks |
Cycle knowledge helps, but execution comes from reading the shift before consensus does. The edge is not predicting the exact bottom. The edge is recognizing when capital behavior starts to improve while the crowd is still anchored to the last drawdown.
At the point where the chart still looks damaged, a handful of wallets often start behaving as if the bottom is already in. They add on fear, refill stablecoin balances after red days, and keep buying leaders instead of chasing random beta. That behavior matters more than commentary because it shows committed capital, not opinion.
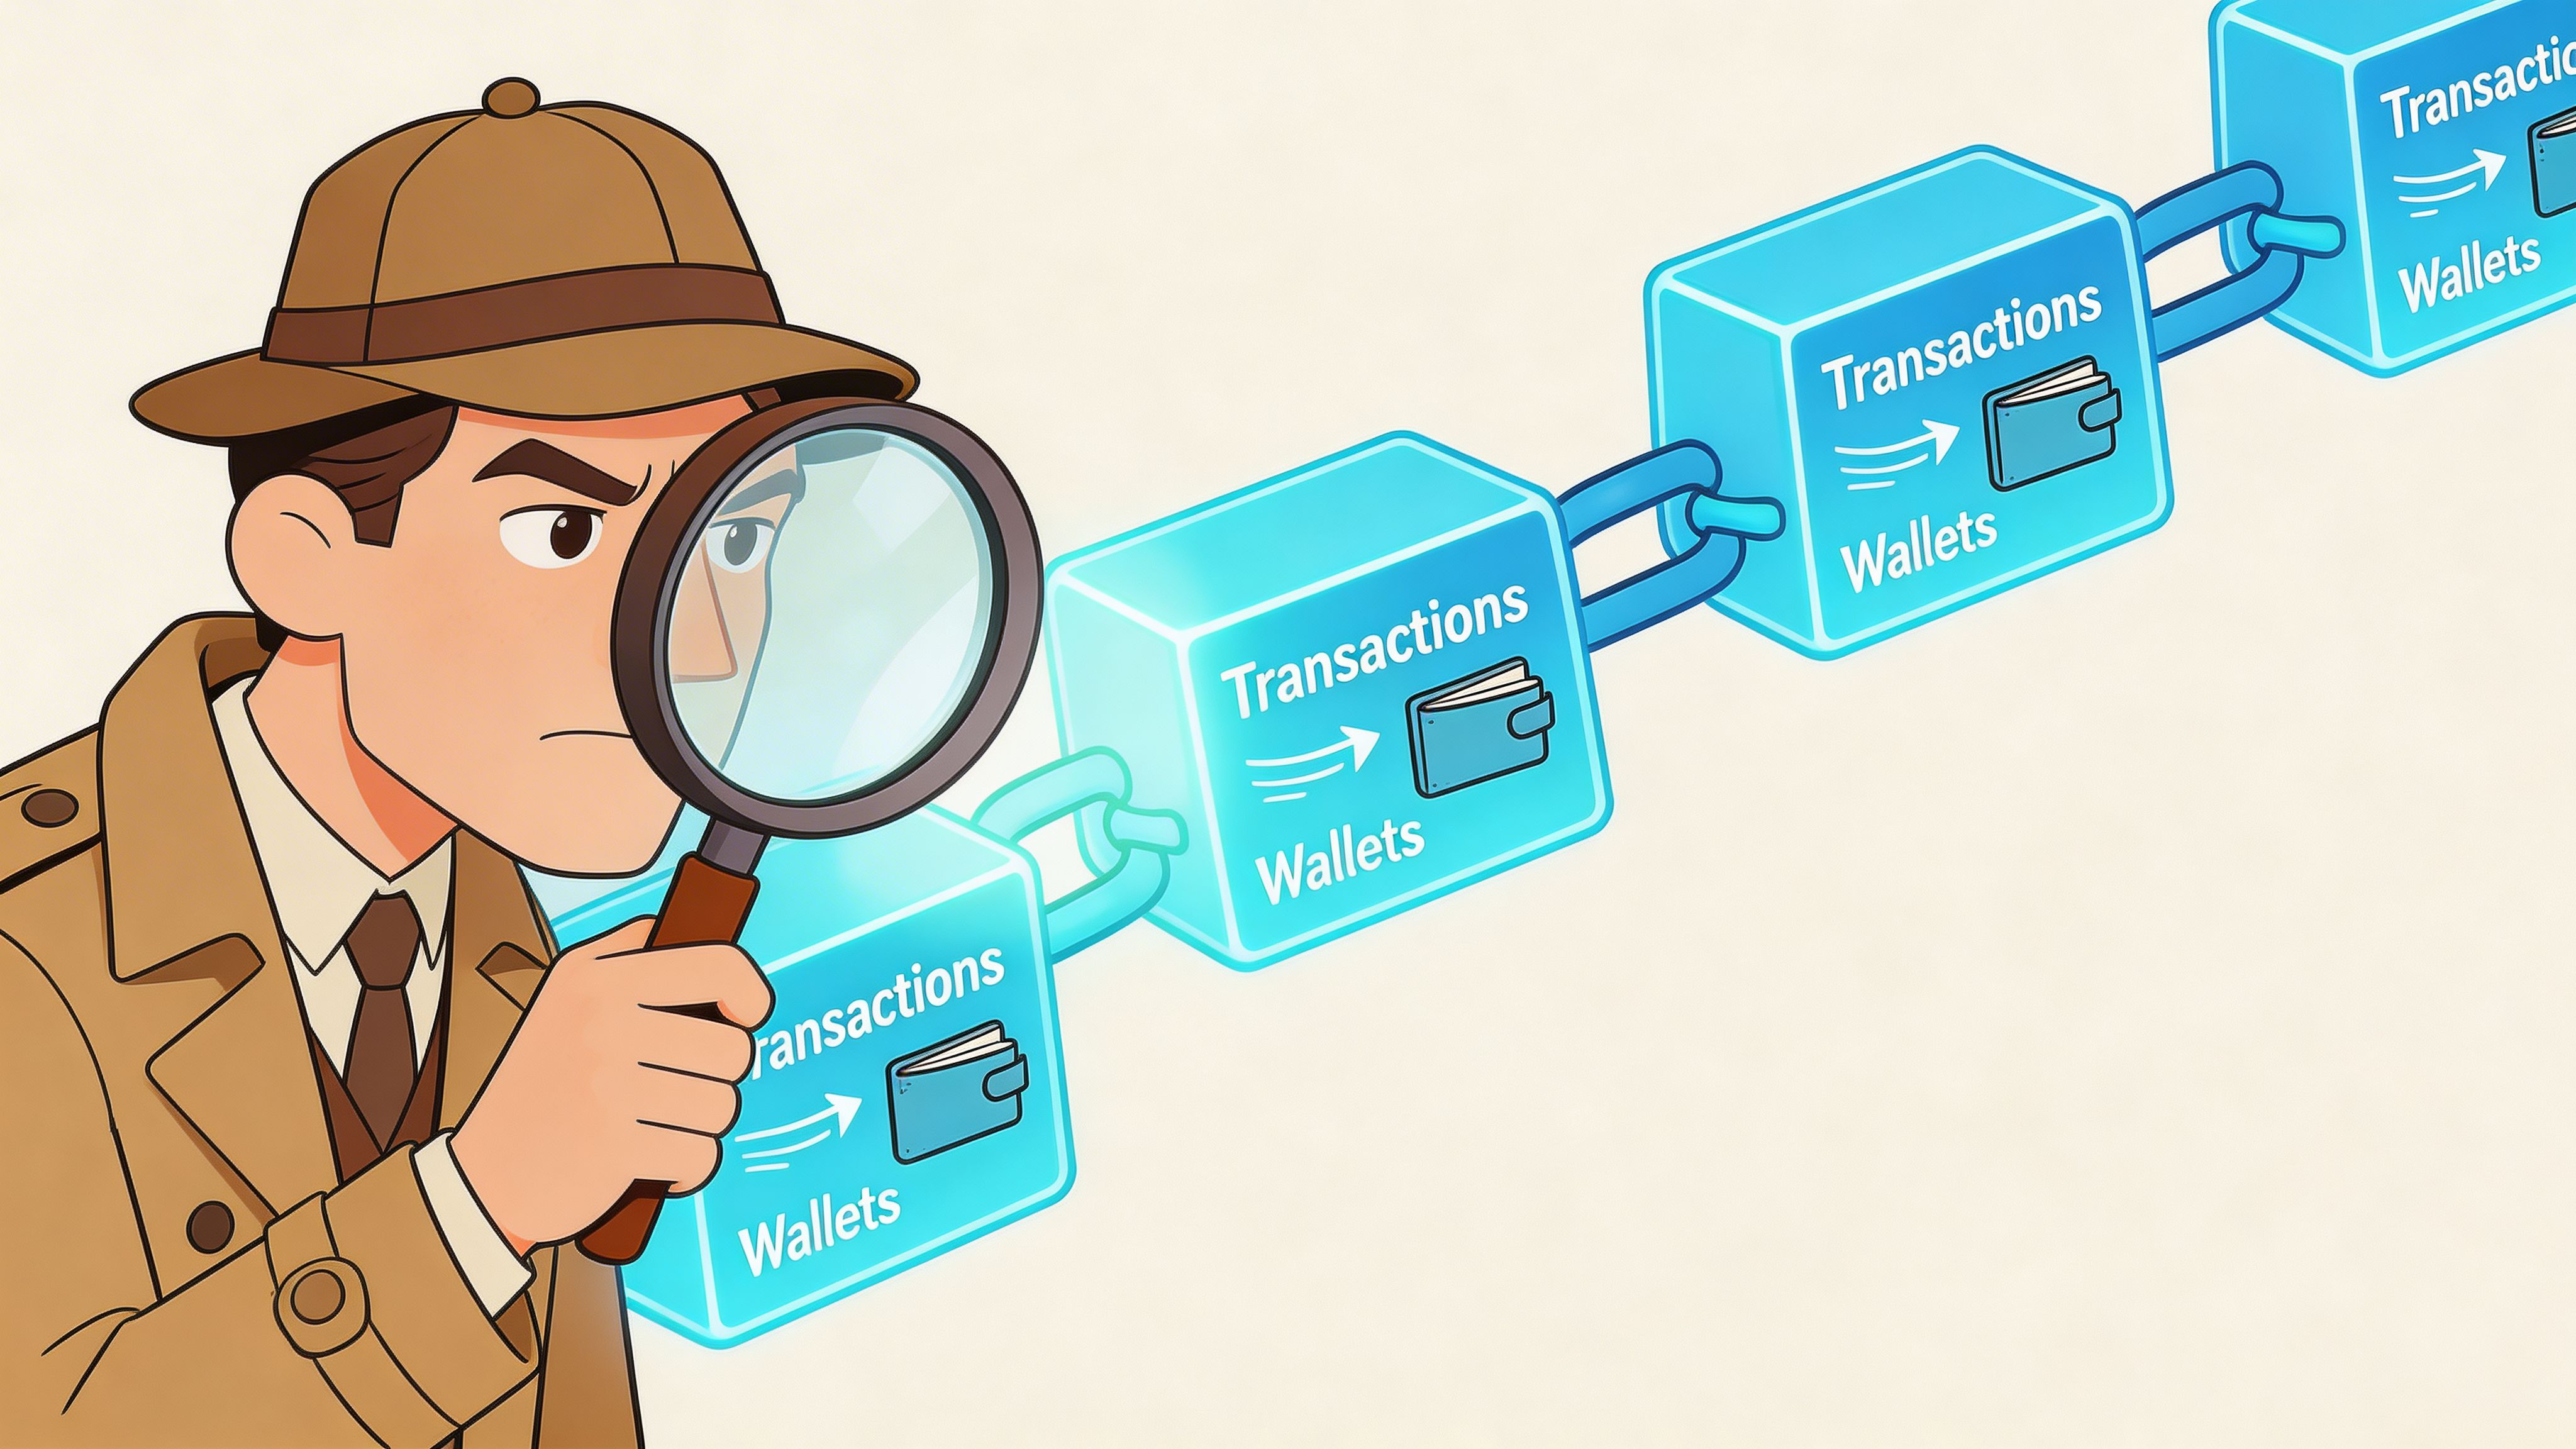
Price summarizes the result. On-chain activity shows the process that produced it.
Charts are useful, but they compress everything into one output. On-chain analysis separates that output into observable pieces: who is buying, where size is entering, whether capital is rotating out of stables into risk, and whether buyers keep showing up on retests. For recovery analysis, that sequence matters more than any single candle pattern.
A cleaner way to frame it is simple. Recovery becomes more credible when three conditions appear together: strong wallets accumulate into weakness, stablecoin liquidity stays available, and buying shows up near levels the market has already defended. If one piece is missing, the move can still bounce. It is harder to call it repair.
For traders who want a practical framework before tracking wallets in real time, this guide to on-chain analysis lays out the core metrics clearly.
I look for convergence across wallet behavior, liquidity, and execution quality.
The earliest recoveries rarely begin with broad enthusiasm. They begin with selective buying by wallets that have a history of entering before trend confirmation.
That is the advantage of wallet-level analysis over generic sentiment reads. Instead of asking whether the market feels better, you can ask whether the same high-signal wallets that sold strength or de-risked earlier are rebuilding positions now. On Wallet Finder.ai, that means tracking whether profitable wallets are buying majors and sector leaders on red days, whether they are returning to names they owned in prior uptrends, and whether those entries happen in clusters rather than as isolated probes.
A single buy means little. Repeated adds across multiple sessions are more informative.
Stablecoin balances matter because they represent ready buying power. But headline supply alone is too blunt to trade from. The better question is whether capital is moving from stables into risk at the same time price is testing support.
That distinction helps avoid a common mistake. A market can have plenty of idle liquidity and still fail to recover if larger players are unwilling to deploy it. What you want to see is active conversion. Wallets trim stables, add BTC or ETH, then broaden into liquid altcoins only after the first entries hold up. That progression usually signals intent rather than curiosity.
This is one of the more useful non-obvious reads during a base. If stablecoin balances rise while high-conviction wallets stay inactive, caution is still winning. If those balances start falling as the same wallets buy weakness, risk appetite is returning before the crowd admits it.
Support is more credible when large wallets treat it as a buying zone, not just a line on a chart.
I care less about wallet popularity and more about behavior under pressure. Do the same wallets add near prior demand zones? Do they keep size through volatility, or flip out on the first bounce? Are they buying market leaders, or only low-liquidity names that are easier to push around? Those questions separate accumulation from noise.
Field note: A local bottom gets more believable when skilled wallets add on retests after the first bounce, not only during the initial panic bid.
Here’s a useful explainer before diving deeper into wallet behavior:
When I review a possible recovery, I want evidence across four layers:
| On-chain signal | What to look for | Why it matters for recovery |
|---|---|---|
| Wallet accumulation on dips | Repeat buys from historically profitable wallets | Early positioning often appears before trend confirmation |
| Stablecoin rotation into risk | Falling stable balances alongside spot accumulation | Capital is being used, not just parked |
| Large entries near support | Size added around defended levels and retests | Suggests buyers see favorable downside-to-upside terms |
| Cross-chain participation | Strength in more than one major ecosystem | Recovery is broadening beyond a single trade |
The edge is not predicting the exact day of the bottom. The edge is seeing capital behavior improve while public positioning still reflects the last drawdown. That is where on-chain analysis becomes actionable, and where Wallet Finder.ai can help traders spot the shift before it is obvious on the chart.
A recovery path is rarely obvious in real time. Traders need a scenario map, not a prophecy.
I’d frame the current market through three possibilities. Each can be monitored with observable triggers instead of belief.
This is the V-shaped path. It happens if macro pressure fades quickly and institutional demand keeps absorbing supply.
In that case, Bitcoin holds key support, reclaims nearby resistance, and capital rotates into higher-beta sectors faster than expected. The market narrative shifts from survival to re-acceleration.
This scenario becomes more plausible if ETF inflows stay healthy during red days and wallet accumulation remains aggressive rather than selective.
This is the U-shaped path. It’s the most common in damaged markets.
Price bases for an extended period. Bitcoin stays constructive, but altcoins remain uneven. Strong wallets accumulate repeatedly, stablecoin liquidity stays available, and leadership develops one sector at a time.
This path frustrates traders who need excitement. It rewards traders who can separate accumulation from stagnation.
A slow recovery is still a recovery. It just doesn’t feel like one while it’s happening.
This is the L-shaped path. It’s the least rewarding and the easiest to mistake for a bottoming process.
Here, support doesn’t collapse, but capital also doesn’t commit broadly. Bitcoin may hold range support, yet follow-through remains weak. Wallet activity becomes opportunistic instead of directional. Rotations fail before they develop.
That kind of market punishes overtrading. It favors selective trades, reduced size, and patience.
| Scenario | Description | Key Macro Triggers | Key On-Chain Triggers |
|---|---|---|---|
| V-shaped | Sharp rebound after panic low | Continued ETF demand during weakness, improved regulatory access, strong catalyst from major network upgrades | Broad wallet accumulation, quick stablecoin deployment, strong buying near support |
| U-shaped | Extended accumulation before trend resumes | Macro stops worsening, but doesn’t turn decisively bullish | Repeated smart money buying, selective sector rotation, steady cross-chain activity |
| L-shaped | Long sideways market with weak follow-through | Mixed macro, hesitant capital, no fresh confidence catalyst | Choppy wallet behavior, low conviction sizing, failed rotations |
The important part isn’t guessing which scenario wins today. It’s updating your view when the evidence changes.
A recovery usually starts before the chart looks healthy.
Price is still choppy. Sentiment is still defensive. Headlines still frame every bounce as temporary. Yet a small group of wallets begins to change behavior first. They size into support instead of reacting to green candles. They return to the same sectors on retests. They deploy capital with more conviction than the broader market.
That gap between public narrative and wallet behavior is where early recovery signals tend to appear. A useful playbook starts there.
The better question is not which coin can bounce hardest. It is which wallets have shown repeatable timing across weak conditions, failed rallies, and genuine trend transitions.
That matters because recovery leadership rarely appears as a broad market event at first. It usually begins with concentrated buying from experienced participants on a few chains and in a few sectors. If you identify those wallets early, you stop relying on headlines and start tracking capital in motion.
Wallet Finder.ai is most useful here as a filtering and monitoring layer, not as a feed for blind copying. The core workflow starts with wallet discovery, recent trade review, and chain-level filtering so you can isolate addresses that are still executing well while the market remains messy.
A strong watchlist is segmented by function. Different wallet types answer different questions about whether a recovery is real.
I separate them into four groups:
The objective is pattern recognition. You want to know who buys weakness with discipline, who chases momentum, and who adds size only when conviction rises.
A damaged market hides weak process. A rising market often rewards it.
That is why your filters should be stricter during recovery conditions. The wallets worth following are the ones that still show edge when trend strength is absent.
Focus on these:
Win rate with trade quality
Win rate alone is incomplete. Review whether gains come from meaningful moves or from small exits that mask weak overall judgment.
PnL through different regimes
A wallet with strong results only during high-beta momentum is less useful than one that has handled chop, panic, and trend resumption.
Recency
Old performance matters less than current behavior. Recovery detection depends on what skilled wallets are doing now, not six months ago.
Position sizing
Size is one of the clearest signals of conviction. Repeated scaling near support says more than scattered low-size entries across unrelated tokens.
Chain concentration
Early strength is usually localized. If skilled wallets begin pressing exposure on one chain, that often identifies where liquidity and attention may build next.
The best signal is rarely one wallet. It is a cluster of independent wallets expressing a similar view through timing, size, and asset selection.
Speed matters once wallet behavior starts to shift.
A practical setup is simple. Track a curated list of addresses and configure alerts for buys, swaps, and size increases that occur near key levels. The point is not to mirror every transaction. The point is to catch synchronization early.
If three strong wallets buy the same ecosystem after a failed breakdown, that deserves attention. If one wallet buys and the others stay inactive, the signal is weaker. Recovery trading improves when you treat wallet activity as confirmation layers rather than isolated prompts.
You can monitor that process through smart money wallet tracking across major chains, then narrow alerts to the addresses and ecosystems that match your strategy.
Raw entries are less informative than behavior over time.
Review wallet history with a structured lens:
| Signal inside wallet history | Why it matters |
|---|---|
| Entry timing | Shows whether the wallet buys failed breakdowns, support retests, or confirmed trend changes |
| Exit discipline | Shows whether gains are realized systematically or given back through poor risk control |
| Position size progression | Shows whether conviction is increasing as conditions improve |
| Asset selection | Shows where leadership may be forming before it becomes obvious across the market |
One dip buy is anecdotal. Repeated buying at the same level, followed by larger size on confirmation, is more useful. When several strong wallets do that in the same sector, you have the start of an actionable recovery thesis.
A recovery playbook should produce decisions, not just opinions.
Use a process like this:
That framework shifts you from passive observation to evidence-based execution. It also creates a repeatable way to act before the recovery becomes consensus.
The crypto market doesn’t ring a bell at the bottom. It leaves clues.
Those clues don’t appear in one place. Macro tells you whether capital can return. Historical cycles tell you panic isn’t the same as permanent damage. On-chain data tells you whether experienced participants are already acting on that view.
That’s the answer to will the crypto market recover. It likely can, but the edge isn’t in saying yes or no. The edge is in recognizing the recovery sequence before it becomes obvious.
The traders who perform best in these environments usually do three things well. They respect macro. They don’t forget cycle history during fear. And they watch wallets, flows, and sizing with more attention than headlines.
If you build your process around those signals, you stop reacting to noise. You start operating like an analyst with a trigger framework.
That shift matters. By the time consensus agrees the recovery is real, the best entries are often gone.
If you want to move from broad market opinions to actual wallet-level evidence, Wallet Finder.ai gives you a practical way to track profitable addresses, monitor smart money flows across Ethereum, Solana, Base, and more, and receive alerts when the wallets you trust start buying before the crowd does.

A premier DeFi analytics platform empowering traders to discover and analyze profitable blockchain wallets, trades and tokens.

