Recovery Factor Calculation for Smart Traders
Master the recovery factor calculation to measure a strategy's resilience. Learn the formula, see DeFi examples, and find top wallets with Wallet Finder.ai.

June 20, 2026
Wallet Finder

July 11, 2026

You're probably seeing the same thing most traders see near the start of a major move. A few coins are ripping, timelines are getting louder, and every green candle makes people ask the same question: is this the start of a real bull run, or just another fakeout?
That confusion is expensive. Traders who wait for universal confirmation usually enter late. Traders who mistake a rebound for a regime shift often buy the local top. The edge comes from knowing what is a bull run in practical terms, then checking whether price, participation, and wallet behavior all point in the same direction.
A lot of content answers the question “what is a bull run” with a simple line about prices going up. That's not enough if you actively trade.
A better answer connects the label to market structure, capital rotation, and wallet behavior. Coinbase's educational overview points to an important gap. Many explanations stop at the definition, but traders need to know whether gains are broad-based or concentrated in a few speculative tokens. That distinction matters if you're making entries, scaling risk, or copying on-chain activity through a platform like this guide to bull run dates and cycles.
Spotting green candles isn't the struggle. The challenge lies in classification.
Is the move:
If you treat all four the same, you'll size positions badly and react to noise.
Practical rule: A bull run becomes useful as a concept only when it changes your behavior. It should affect how you enter, how long you hold, and how aggressively you rotate capital.
Crypto moves faster than many other markets. Strong rallies can happen in isolated ecosystems, while the rest of the market stays mixed. That's why the label “bull run” is often weaker and more context-dependent than beginner guides suggest.
For ambitious traders, the right question isn't just “are prices up?” It's this:
Those questions turn a vague market phrase into a workable framework.
At the simplest level, a bull run is a period when prices rise over time. The image is straightforward. A bull charges forward and pushes upward.
In crypto, though, that simple image hides the part that matters most. Not every upward move is a bull run. Some are just violent rebounds inside a weak market.
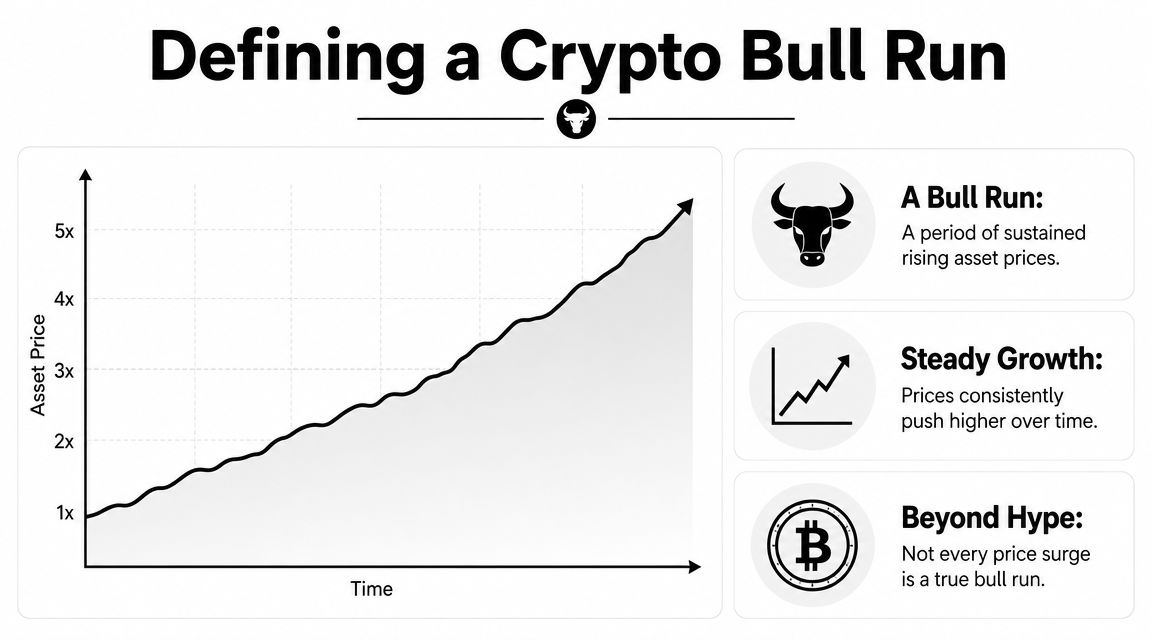
A technical explanation is more useful than hype. Equiti notes that a bull run is typically identified by a sustained sequence of higher highs and higher lows, often with rising trading volume, as price clears resistance and then holds support at progressively higher levels in a way that shows demand is absorbing supply rather than producing a short-lived bounce, as explained in Equiti's overview of crypto bull run structure.
That sounds technical, but the idea is simple:
When that repeats, the market is telling you buyers remain in control.
Newer traders often get trapped. A market can jump hard after a steep decline and still remain structurally weak.
A bounce usually looks exciting at first, but it tends to fail in one of these ways:
A true bull run behaves differently. Buyers don't just create a spike. They keep defending higher levels.
Clean breakouts matter more than dramatic candles. One explosive move can be noise. Repeated breakouts that hold are harder to fake.
The "bounce" failure pattern described above has a specific, widely used name worth knowing: a bull trap, a false breakout where price clears resistance, pulls in buyers who believe the uptrend is real, then reverses sharply back below that level, trapping those buyers in a losing position.
The mechanics line up closely with the bounce failures already covered in this guide. Price breaks a well-watched resistance level, but on weak or average volume rather than the expanding volume a genuine breakout usually shows. Buyers rush in on the fear of missing the move, the breakout shows little follow-through, and price closes back inside the prior range within a candle or two. In more extreme cases, larger holders or leveraged traders intentionally push price through a visible resistance level specifically to trigger buy orders from traders watching that level, then sell into the resulting demand.
The practical defenses are the same discipline this guide already recommends for distinguishing a bounce from a real bull run, just applied with a specific name attached. Wait for a higher-timeframe candle, four-hour or daily, to close beyond the level rather than reacting to an intraday spike. Confirm the breakout with above-average volume, not just a strong-looking candle. And watch for a retest: a genuine breakout often returns to test the broken resistance as new support before continuing, while a bull trap fails that retest and keeps falling. Knowing the term matters less than applying the discipline, but recognizing "bull trap" when you see it referenced elsewhere saves you from treating it as a separate, unfamiliar concept.
Some market educators use a rough benchmark that a bull market or bull run often begins after about a 20% price increase from a prior low, while the prior bearish phase is often framed by a 20% drawdown from a high, as described in Blink's discussion of bull-run thresholds and cycle phases.
That benchmark is useful, but it shouldn't be your only filter. In crypto, sharp moves happen often. What matters is whether the move develops into a durable structure.
A helpful way to consider this is:
SignalWhat it suggestsPrice makes higher highsBuyers are willing to pay morePullbacks hold higher lowsSellers aren't fully regaining controlVolume expands on breakoutsDemand is active, not passiveResistance flips to supportThe market accepts higher prices
A bull run isn't one continuous straight line. It develops in phases, and each phase rewards a different kind of behavior.

Cycle models often break the process into four stages: accumulation, markup, euphoria, and distribution. Blink's framework also makes the trading implication clear. The more favorable entries are usually in accumulation or early markup, before sentiment gets overheated and position quality worsens, as outlined in this crypto cycle chart guide.
Accumulation is quiet. Volatility tends to be lower, public interest is muted, and informed participants build positions without needing attention.
Markup begins when resistance breaks and broader participation rises. The market starts rewarding momentum, and more traders notice the move.
A useful visual explainer is below.
Euphoria is the loud phase. FOMO grows, media attention peaks, and many buyers stop asking what they own or why they own it.
Distribution starts when informed holders sell into that demand. Price may still look strong for a while, but leadership often narrows and the easy upside becomes harder to capture.
If you think the market is in accumulation, you can afford patience. You're looking for quiet entries, not headlines.
If you think it's in markup, you focus on trend quality. Pullbacks matter more than dramatic breakouts because you want entries that still offer asymmetry.
If the market feels euphoric, your job changes. You're no longer trying to maximize upside at any cost. You're trying to avoid becoming exit liquidity.
Key distinction: Good bull-run trading isn't just buying strength. It's buying the right phase of strength.
Price is the final output. If you want earlier clues, you need to watch both macro drivers and on-chain confirmation.

Recent coverage of crypto market cycles points out that modern bull runs are shaped by more than retail enthusiasm. They're influenced by macro conditions, Bitcoin halving cycles, institutional interest, and U.S. regulation. For data-driven traders, the useful edge comes from checking whether gains are driven by a narrow group of traders or by durable, broad participation, as discussed in Binance Square's overview of modern crypto bull-run drivers.
Macro drivers don't tell you exactly when to buy, but they help explain why risk appetite may be shifting.
Look for:
These are background conditions. They matter most when price and on-chain behavior begin to agree with them.
Many articles stay too abstract. A practical read on a bull run should include wallet and flow behavior.
Use a checklist like this:
Here's the key idea. If only a tiny slice of the market is moving, the run is fragile. If wallet activity, volume, and price structure all improve together, the move has a better foundation.
One more indicator worth tracking alongside the checklist above: Bitcoin dominance, the share of total crypto market capitalization held by Bitcoin specifically, which tends to shift in a recognizable pattern as a bull run matures.
Early in a run, Bitcoin dominance often rises first, since capital tends to flow into the most liquid, most trusted asset before traders feel comfortable taking on the added risk of altcoins. As the run progresses and confidence builds, dominance frequently declines as capital rotates outward into large-cap altcoins, then further into smaller and more speculative names, a pattern often described as an altcoin season. Watching this shift gives you a read on which phase of the four-stage cycle covered earlier in this guide the market is actually in, independent of what any single token's price chart shows.
The practical use is straightforward. A market where Bitcoin dominance keeps climbing alongside rising prices suggests participation is still narrow, closer to the earlier stages of a run. A market where dominance is falling while total market capitalization keeps rising suggests broadening participation, consistent with the markup or early euphoria stages. Track dominance the same way you'd track sector rotation elsewhere in this guide, as a breadth confirmation, not a standalone signal.
When you're trying to decide whether a move is becoming a real bull run, ask:
If price says “up” but wallets, breadth, and rotation say “narrow,” treat the move with suspicion.
The phrase “bull run” didn't start in finance. Historically, Bull Run refers to the First Battle of Bull Run, also called First Manassas, fought on July 21, 1861. It was the first major battle of the U.S. Civil War, about 25 miles from Washington, D.C., and ended in a Confederate victory that shattered expectations of a quick conflict. The American Battlefield Trust notes that the battle forced both sides to accept the war would be “long and bloody,” as described in its history of Bull Run.
That origin matters because modern market use keeps the same sense of force and momentum. But crypto bull runs don't all look the same. Each cycle has its own narrative.
One cycle may be driven by a broad belief in new token issuance. Another may center on Bitcoin, institutional acceptance, decentralized finance, NFTs, or a specific chain ecosystem.
The lesson isn't that every future cycle will copy a prior one. It won't. The lesson is that bull runs usually become obvious in hindsight because a dominant story eventually aligns with market structure.
A strong historical read asks two questions:
When you study previous runs, focus less on storytelling and more on repeatable evidence:
Historical lensWhy it mattersDominant narrativeHelps explain why traders caredLeadership assetsShows where capital entered firstSector spilloverReveals whether the run broadenedLate-cycle behaviorHelps identify when euphoria took over
That approach keeps you grounded. You're not trying to memorize old headlines. You're training your eye to notice how strong trends mature.
A good case study doesn't just show that price went up. It shows who bought first, who joined later, and when the quality of demand began to deteriorate.
Recognizing a bull run is useful. Surviving one profitably is harder. Strong markets tempt traders into bad habits because rising prices hide weak process for a while.
The goal isn't to predict every swing. The goal is to build a repeatable playbook that works across phases.
A disciplined trader follows confirmed strength rather than chasing random candles.
That means:
If you need help controlling risk per trade, a position sizing calculator for crypto trading is a practical way to keep sizing consistent.
Bull runs often start with leaders, then spread outward as confidence grows. A common mistake is starting with the highest-risk names before the market has earned that aggression.
A more disciplined approach looks like this:
Most traders spend too much time thinking about entries and too little time planning exits.
Create rules before momentum takes over:
A useful mindset is to treat risk management as your main edge. In a bull run, almost everyone feels smart on the way up. Process is what protects you when conditions turn.
Theory gets you only so far. On-chain markets reward traders who can spot positioning early and act before narratives become crowded.
Wallet Finder.ai is built for that job. It tracks DeFi wallet activity across major ecosystems and helps traders identify profitable wallets, trades, and tokens by surfacing complete trading histories, PnL patterns, entry and exit timing, and recent activity. Instead of guessing whether accumulation is happening, you can study wallets that are building positions.

Start with wallet discovery. Look for wallets with consistent results rather than one lucky trade. The point isn't to worship “whales.” It's to identify traders whose behavior repeats across multiple opportunities.
Then build a watchlist around those wallets:
During accumulation, wallet tracking helps you notice interest before public excitement arrives.
During markup, alerts help you see whether smart money keeps adding or starts trimming into strength.
During euphoria and distribution, wallet behavior becomes even more valuable. If strong wallets stop pressing risk while retail enthusiasm gets louder, that divergence can keep you from overstaying the move.
Wallet Finder.ai also supports deeper research with exportable datasets, custom charts, and views like Discover Wallets, Discover Tokens, and Discover Trades. That's useful if you want to move beyond simple copying and build your own process around wallet clusters, narrative rotation, and execution timing.
A bull run is a sustained period of rising prices confirmed by higher highs, higher lows, and expanding volume across multiple assets. A bull trap is a false signal, a breakout above resistance that quickly reverses, trapping buyers who mistook it for the start of a genuine trend. The same confirmation checklist covered in this guide, volume expansion, follow-through, and broadening participation, helps distinguish one from the other.
A bear market rally is a temporary rise in price that occurs within a broader downtrend and typically fails to establish new higher lows once it fades. A genuine bull run shows sustained structural improvement, higher lows holding and resistance flipping into support, rather than a single sharp move inside a market that's still fundamentally weak.
Not always, and the pattern isn't guaranteed to repeat identically each cycle. Historically, dominance has often risen early in a run as capital favors Bitcoin's liquidity and trust, then declined as the run matures and capital rotates into altcoins. Use it as a directional signal about breadth, not a fixed rule that applies the same way every time.
Watch for the signs of the distribution stage covered in this guide: choppy price action near highs despite continued optimism, failed follow-through after breakouts, and narrowing leadership where fewer assets are still making new highs. On-chain, a divergence where strong wallets stop adding or start trimming positions while public enthusiasm remains high is often a stronger signal than price action alone.
If you want to turn the idea of a bull run into something you can trade, Wallet Finder.ai gives you a direct way to track profitable wallets, monitor smart-money accumulation, and act on real on-chain behavior instead of hype.