
Recovery Factor Calculation for Smart Traders
Master the recovery factor calculation to measure a strategy's resilience. Learn the formula, see DeFi examples, and find top wallets with Wallet Finder.ai.

June 20, 2026


Wallet Finder
May 3, 2026
Bitcoin went from about $1,000 on January 1, 2017 to roughly $19,891 on December 17, 2017, a gain of about 1,900% in roughly 12 months according to Binance Square’s summary of the 2017 cycle. That single stretch explains why traders obsess over bull run dates. Timing doesn’t just change returns. It changes position sizing, risk tolerance, how long you can sit through pullbacks, and when you should stop pressing.
Most traders look for one perfect date. That’s the wrong frame. Crypto bull runs don’t begin with a bell ringing at the open. They emerge through a mix of cycle structure, momentum repair, liquidity, and capital rotation. The useful question isn’t “What day does the bull run start?” It’s “What window are we in, and what signals confirm it?”
That shift matters because crypto rarely rewards traders who wait for certainty. By the time mainstream consensus agrees a bull market has started, early wallets have already accumulated, rotated, and taken first profits. The edge comes from building a repeatable process before the crowd gets comfortable.
A crypto bull run is a sustained period where prices trend higher across a meaningful part of the market and trader behavior changes with them. It’s not just a green week. It’s a phase where dips get bought, narratives spread faster, confidence rises, and capital moves from major assets into riskier parts of the market.
The simplest way to think about it is a rising tide with uneven lift. Bitcoin usually attracts the first serious flow, then large caps, then selective altcoins, and finally the lower-quality parts of the market if speculation gets hot enough. In a bear market, that process runs in reverse. Traders sell strength, rallies fail faster, and capital hides in safer places or leaves crypto entirely.
A bull run usually includes a few conditions happening together:
A bear market feels very different:
Bull runs don’t feel comfortable at the start. They feel suspicious, then obvious, then euphoric.
Knowing the concept isn’t enough. The reason traders track bull run dates is practical. Cycle timing affects when you accumulate, when you rotate out of majors into higher beta trades, and when you stop adding exposure. If you treat every rally as the start of a full cycle, you’ll overtrade noise. If you dismiss every early breakout as a fake move, you’ll enter after the best asymmetry is gone.
That’s why the rest of the work has to focus on dates, windows, and confirmation signals rather than headlines.
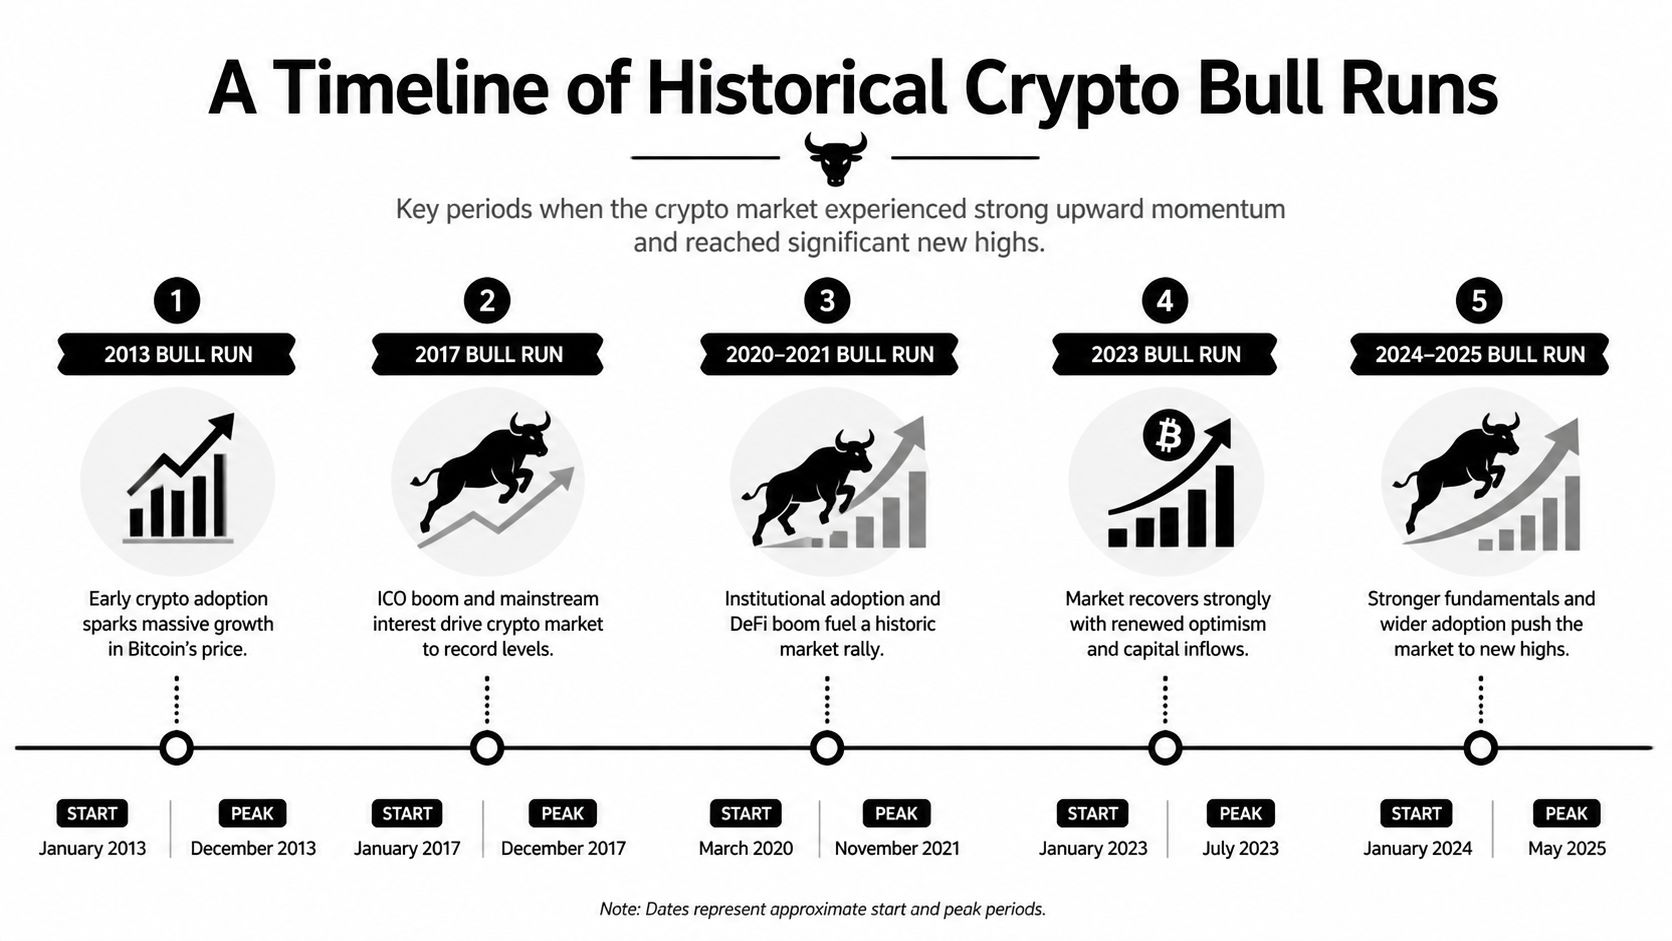
Bitcoin has gone through multiple cycle expansions in just over a decade, but the tradeable pattern is narrower than the headlines suggest. The useful question is not whether crypto has bull runs. It is how long the strongest windows lasted, what confirmed them, and how to turn those dates into a repeatable watchlist and alert process.
| Cycle | Start Date | Peak Date | Duration (Days) | Peak Price (Approx.) | Key Driver |
|---|---|---|---|---|---|
| 2013 | Qualitatively referenced as an earlier major cycle | Qualitatively referenced | 11 months | Not specified in verified data | Early crypto adoption and cycle expansion |
| 2017 | January 1, 2017 | December 17, 2017 | Roughly 12 months | ~$19,891 | Retail frenzy, mainstream media coverage, ICO boom |
| 2020-2021 | Qualitatively referenced as starting in 2020 | Qualitatively referenced as peaking in 2021 | Approximately 473 days | Not specified in verified data | Post-halving cycle expansion |
| 2024-2025 | Began in early 2024 | Potentially late 2025 or 2026 | Historically modeled at 12-18 months | Not specified in verified data | Post-halving cycle template, with possible extension beyond historical norms |
One useful way to frame those windows is against a broader crypto cycle chart framework. It helps separate a reflexive rally from a cycle that is broadening across sectors and timeframes.
The 2017 run is still the clearest historical benchmark because the start and peak are easy to anchor. Bitcoin opened the year near $1,000 and peaked near $19,891 on December 17, 2017, a move summarized in Binance Square’s cycle overview. For traders, the bigger lesson is not the exact return. It is that the strongest leg of the move came after enough participants had already convinced themselves they were late.
That cycle also showed how trend traders usually lose position before they lose conviction. The market printed sharp pullbacks on the way up, then kept repairing structure. Traders who sold every volatility spike gave up exposure right before the next expansion leg.
Historical bull run dates are useful as operating ranges, not prediction theater. A practical read of the timeline gives you three things.
First, full-cycle advances usually last longer than short-term traders expect. That matters for sizing and for deciding when to stay with Bitcoin versus when to rotate into higher beta names.
Second, corrections inside an expansion are normal. A pullback only matters if it breaks broader participation, weakens volume support, and fails to recover on-chain activity.
Third, the reset after a peak is usually severe. The same 2017 cycle summary notes that the following bear market erased more than 80% from the top. That is why timeline work should feed execution, not curiosity.
The edge comes from converting these dates into conditions you can monitor. In Wallet Finder.ai, build separate watchlists for early-cycle leaders, late-cycle speculation, and smart-money wallets that tend to add risk before public momentum is obvious. Then set alerts for wallet accumulation, unusual inflows into sector leaders, and repeated buys after market-wide pullbacks.
That process makes historical dates actionable. Instead of treating 2017 or 2020 to 2021 as trivia, use them as templates for what to watch the next time capital starts concentrating in the same part of the market.
Historical bull run dates work best as timing windows with confirmation. They are a framework for tracking wallet behavior, rotation, and trend durability before the crowd calls it a bull market.
Prices don’t launch for one reason. A durable crypto bull market usually forms when supply mechanics, liquidity conditions, and new narratives line up close enough in time that each one reinforces the others.
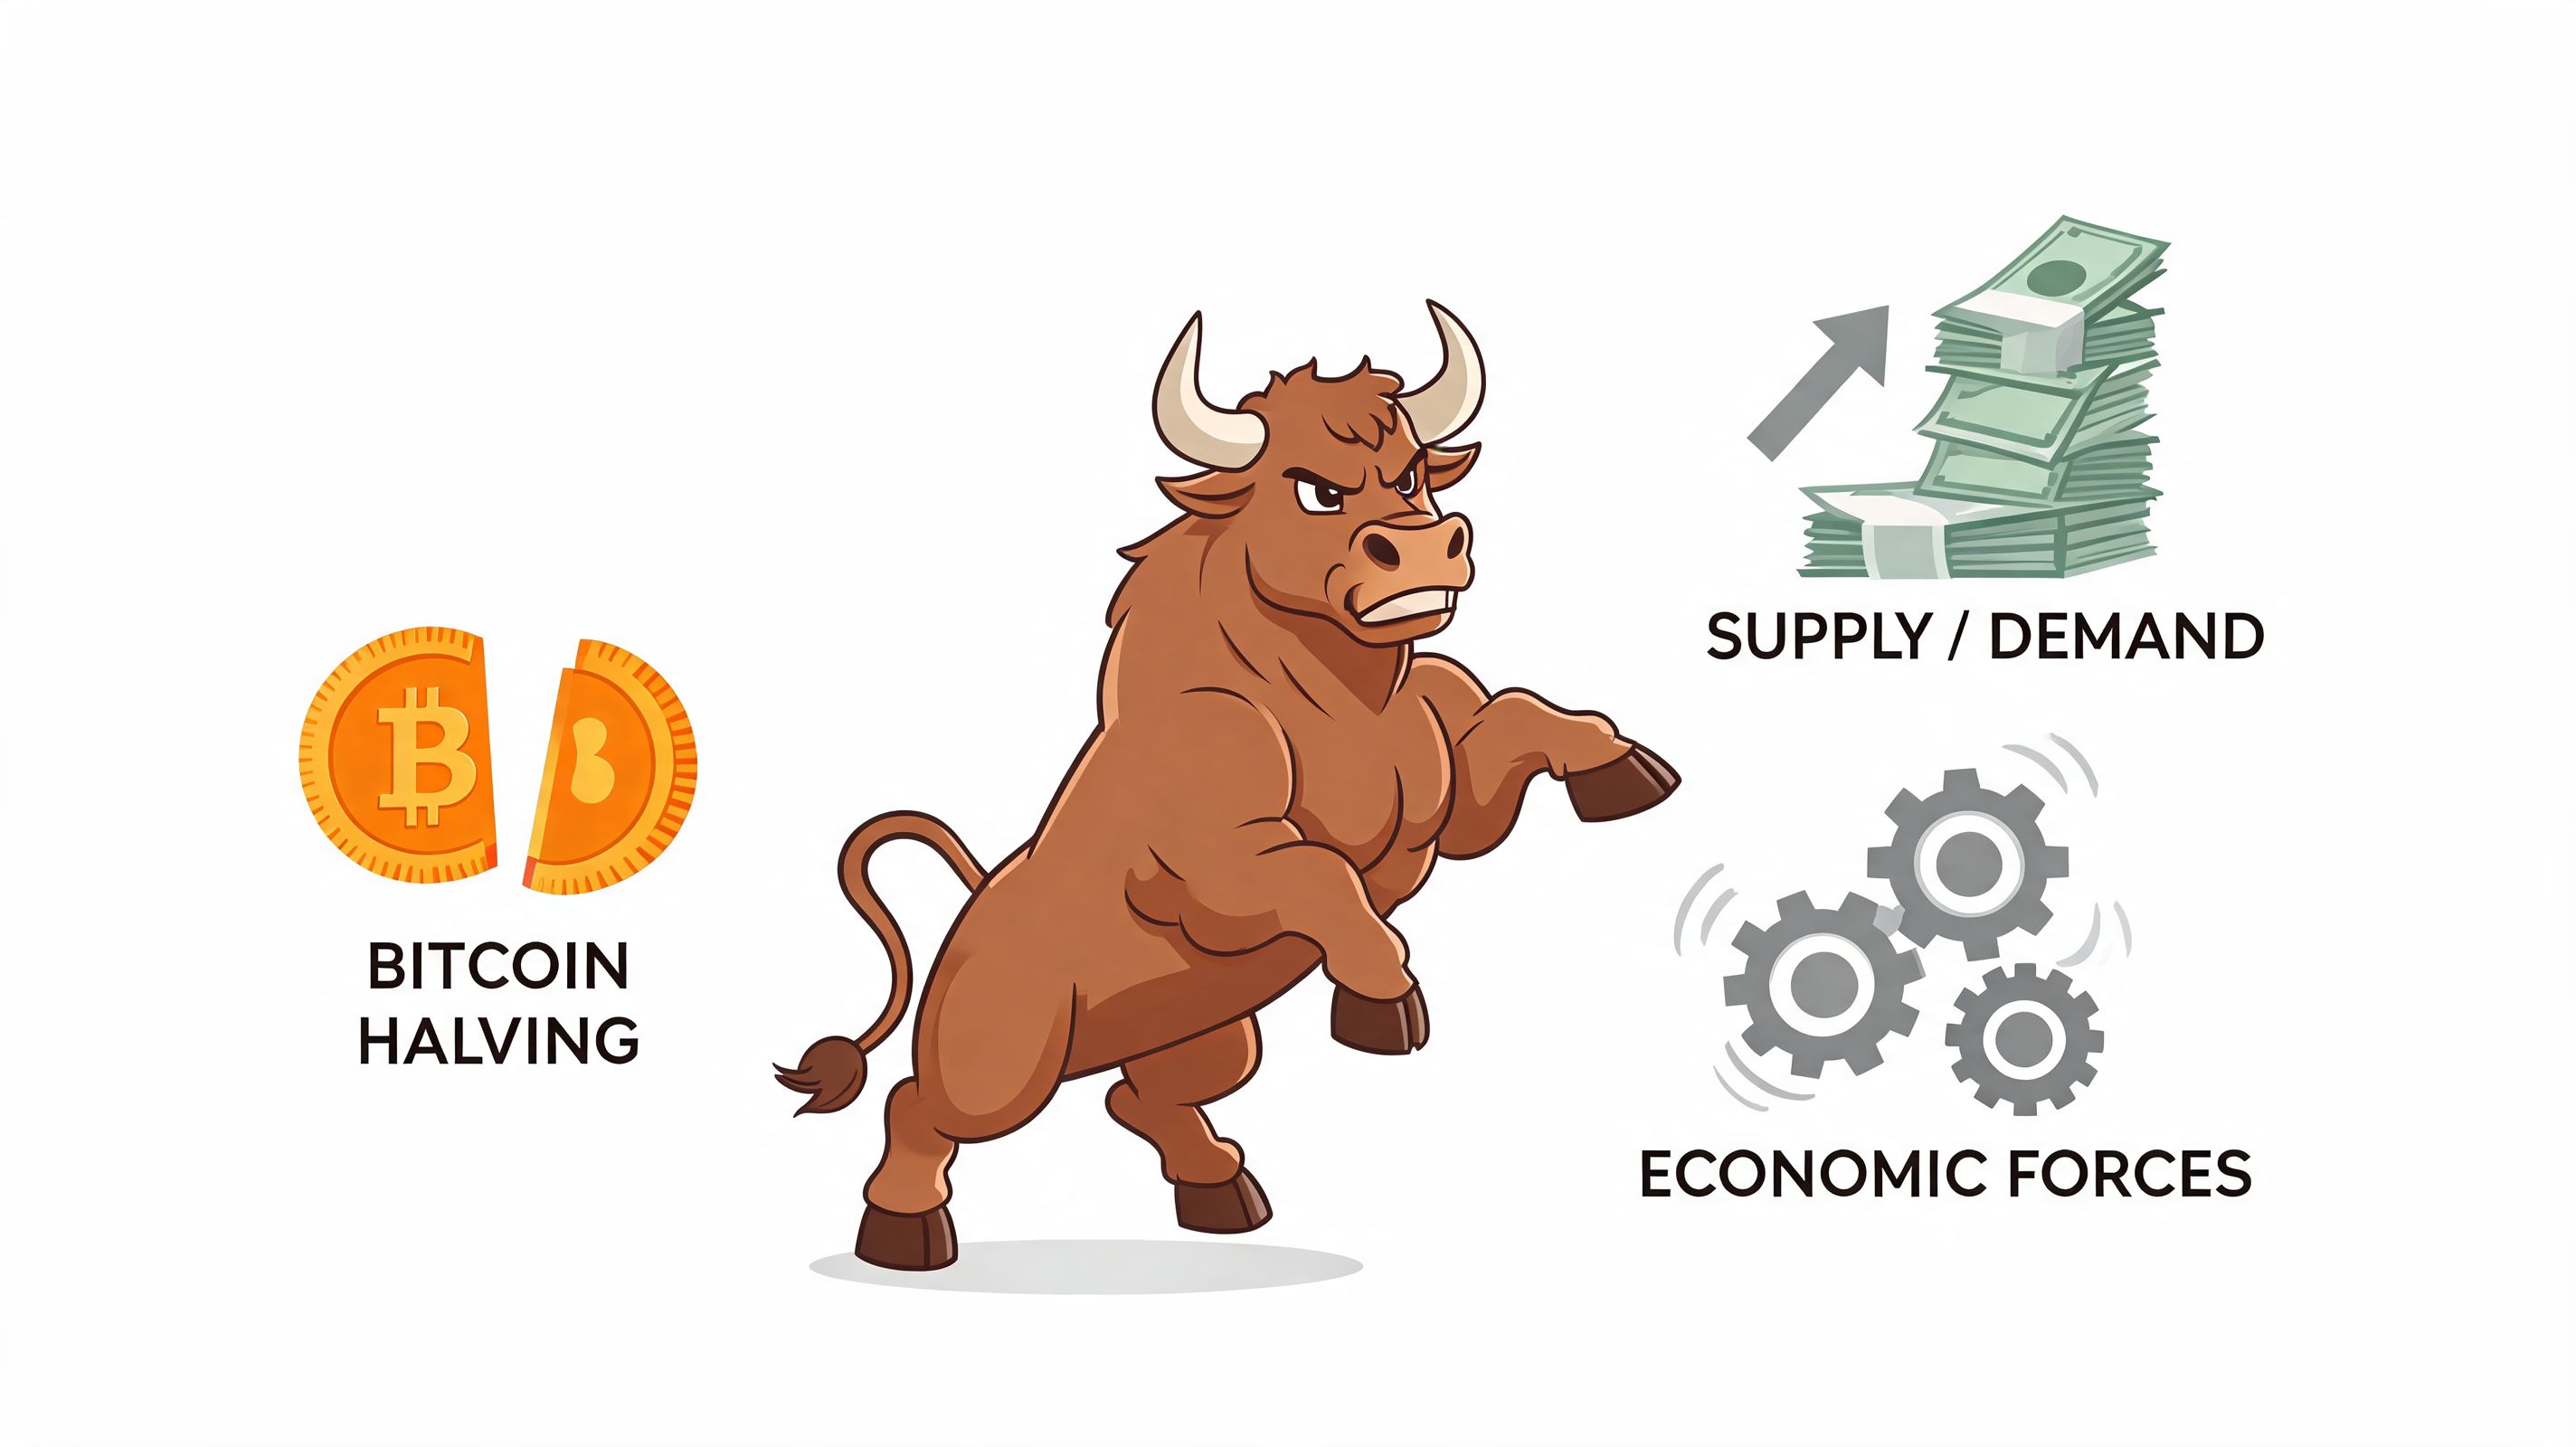
The halving is the closest thing crypto has to a built-in macro event. It reduces new Bitcoin issuance and gives the market a recurring structure that traders can anchor to. That doesn’t mean price goes vertical on the halving date. It means traders begin framing the next expansion window around it.
What works is treating the halving as a context signal. What doesn’t work is assuming every post-halving month must be bullish. The market still needs demand to meet the reduced supply profile.
A market can have a strong narrative and still fail if liquidity stays tight. Bull runs tend to accelerate when capital becomes more willing to take risk. In practice, that means traders watch for easier financial conditions, improving sentiment, and a market environment where speculative capital isn’t getting punished immediately.
Many cycle calls falter. Traders identify a technically clean setup but ignore whether fresh money can sustain it. Price can bounce on positioning alone. A true bull phase needs broader participation.
Every major cycle has a narrative engine. In one era it was ICOs. In another it was DeFi, NFTs, or chain ecosystems with faster user growth. Innovation matters because it creates a reason for capital to move beyond Bitcoin into adjacent sectors.
A few practical rules help here:
None of these drivers is enough alone. A halving without liquidity can stall. Liquidity without a compelling narrative can stay concentrated in majors. Narrative without cycle structure can produce a short-lived bubble rather than a broad bull market.
That’s why experienced traders don’t ask whether one catalyst exists. They ask whether the catalysts are converging.
A bull market usually starts when supply tightens, liquidity loosens, and traders find a story worth chasing.
On-chain data helps most when you use it as a dashboard, not a crystal ball. The goal isn’t to predict the exact candle where the market turns. The goal is to identify whether the current move looks like repair, accumulation, or late-stage chase.
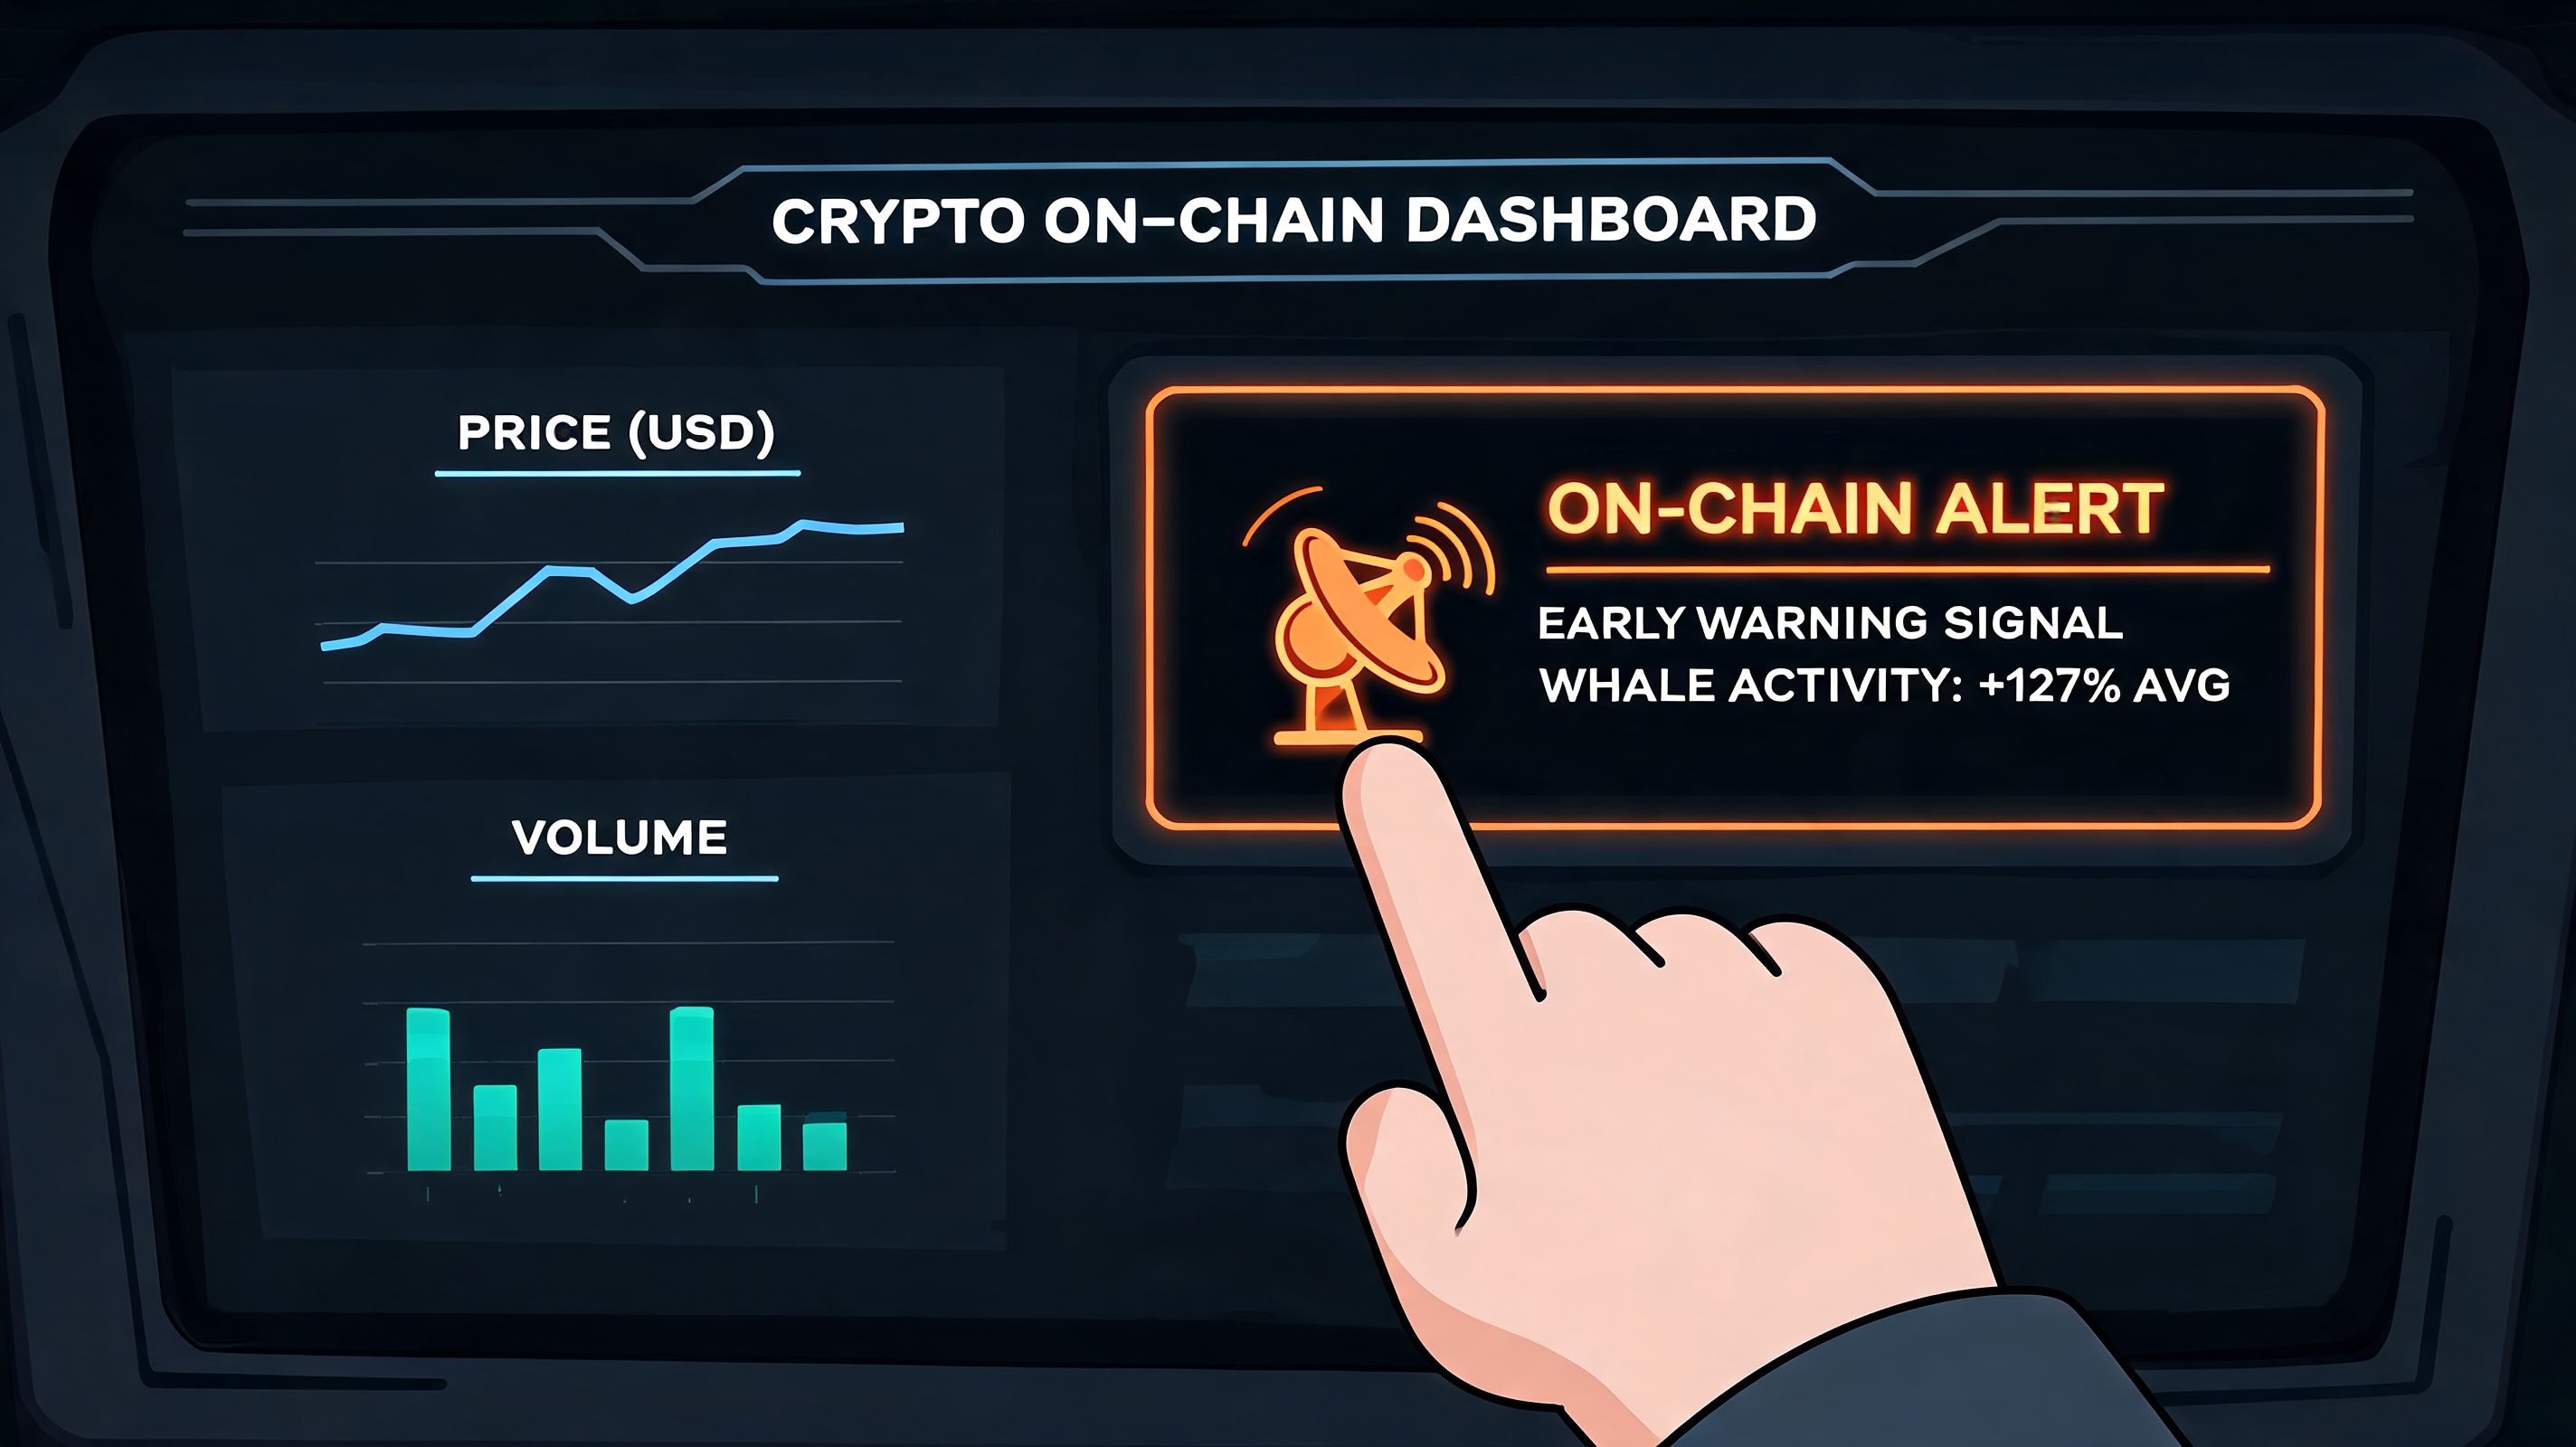
The most concrete timing signal in the verified data is the Stochastic RSI cycle duration. According to the TradingView-linked market analysis, Bitcoin’s Stochastic RSI has historically spent about 365 days below zero before major bull market reversals initiate. The same source notes that this pattern appeared in the 2018/2019 cycle and again in the 2022/2023 bear market. It also states that in 2026 Bitcoin had spent only about 120 days below zero, which suggested incomplete cycle bottom formation at that point.
That’s a useful filter because it forces patience. Many traders mistake the first aggressive bounce for a new macro bull market. Momentum duration helps separate a reflex rally from a deeper base.
You’ll hear traders cite tools like MVRV Z-Score, NVT Signal, and Stablecoin Supply Ratio. They can be useful, but only if you treat them as context.
A practical workflow looks like this:
None of these should trigger a trade by themselves. They’re strongest when they line up with price structure and position behavior from large wallets.
For traders who want a broader primer on methodology, a solid starting point is this guide to on-chain analysis.
The cleanest signals tend to come from combinations:
| Signal Type | What It Tells You | Common Mistake |
|---|---|---|
| Momentum duration | Whether a base may be mature enough for a true reversal | Calling the first bounce a new cycle |
| On-chain valuation | Whether price looks extended or compressed | Using one metric as a top or bottom trigger |
| Wallet accumulation | Whether stronger hands are building exposure | Following activity with no context |
| Sector rotation | Whether risk appetite is broadening | Assuming all chains or altcoins will move together |
Practical rule: If momentum is still rebuilding, wallet accumulation is mixed, and breadth is weak, treat the move as provisional no matter how strong social sentiment looks.
Bitcoin’s post-halving cycles have usually unfolded over many months, not a few headline-driven weeks. That matters because traders who frame bull runs as a window instead of a date usually manage exits better and avoid forcing top calls too early.
The halving is still the cleanest anchor because it creates a known supply shock on a fixed schedule. It gives you a calendar starting point. It does not give you a tradable exit signal by itself.
A practical estimate begins with three scenarios:
Base case
Use the standard post-halving window as your planning range. Within this window, swing traders should already have a scaling-out plan, not just a target price.
Extended case
If Bitcoin holds trend, liquidity stays strong, and strong wallets keep pressing into new sectors after the expected window matures, treat the cycle as stretched rather than finished. Late-cycle extensions happen, but they usually come with choppier structure and sharper reversals.
Failure case
If strength narrows to a few leaders, breakout follow-through weakens, and large wallets start reducing risk into rallies, assume the cycle is underperforming its historical template.
For a broader scenario framework, use this crypto bull run prediction guide alongside your own market logs.
Calendar models are only useful until order flow contradicts them. In practice, I update the expected bull run window when the behavior of profitable wallets and sector leaders changes before price headlines catch up.
Watch for these shifts:
That combination matters more than a date on its own. A cycle can extend past the historical midpoint, but distribution usually shows up in positioning before it becomes obvious on the chart.
Theory needs to become process at this stage. If you want a usable bull run window, build a repeatable routine in Wallet Finder.ai that tells you whether strong participants are still behaving like it is early, mid, or late cycle.
Set it up like this:
| Workflow Step | What to Track in Wallet Finder.ai | What It Suggests |
|---|---|---|
| Build a core wallet watchlist | Traders with consistent realized gains, disciplined position sizing, and recent activity | Whether smart money is still engaged |
| Split by role | Separate accumulators, rotation traders, and momentum traders | Which phase of the cycle is dominant |
| Monitor net behavior | Are top wallets adding on dips, chasing strength, or trimming into rallies? | Whether conviction is rising or distribution is starting |
| Track sector migration | Which ecosystems or narratives receive fresh capital first | Whether risk appetite is broadening or narrowing |
| Set alerts | Trigger notifications for repeated buys, cluster activity, or coordinated exits | Faster reaction when cycle behavior changes |
This gives you something you can act on. If your expected peak window is approaching but your best wallet cohort is still building positions, rotating into higher-beta sectors, and defending entries on pullbacks, the cycle may still have room. If those same wallets stop adding, shorten holding time, and start exiting into strength, the window is likely closing even if social sentiment is still euphoric.
One more point. A good bull run estimate should improve your positioning, not feed false precision. Treat the date range as the map and wallet behavior as confirmation.
Theory helps. Workflow pays. If you want to trade bull run dates rather than just talk about them, you need a process that turns cycle context into entries, watchlists, and alerts.
Start with wallet discovery, not token discovery.

When the market is still repairing, the highest-value work is finding wallets that accumulate before narratives become obvious. On Wallet Finder.ai, the practical move is to use Discover Wallets and filter for traders with strong historical PnL, consistency, recent activity, and clean position behavior across the ecosystems you care about.
Don’t just chase the top total-return wallet. That often gives you a wallet with one lucky concentration bet. Better filters are:
At this stage, I’d separate watchlists by role rather than by chain alone:
| Watchlist Type | What You Want |
|---|---|
| Core accumulators | Wallets that add into weakness and hold through noise |
| Narrative scouts | Wallets that enter new sectors early |
| Rotation traders | Wallets that move from majors into higher beta setups |
| Exit leaders | Wallets that reliably de-risk before broad sentiment turns |
Once the watchlist exists, alerts matter more than passive monitoring. Set Telegram or push alerts for buys, swaps, and sells from the wallets that fit your framework. The point isn’t to mirror every action. It’s to catch clusters.
Three wallets buying the same sector in the same window is often more informative than one whale making a noisy bet. The same is true on exits. If several strong wallets reduce exposure into strength, that’s often your first clean warning that the easy part of the move may be behind you.
This walkthrough helps if you want to see the platform flow in action:
The best use of wallet tracking is pattern extraction. You’re looking for blueprints:
What works is copying the decision logic. What fails is copying every fill without checking market context, slippage, and whether the wallet is trading a liquidity profile you can execute.
A disciplined bull-run workflow looks like this:
That process is repeatable, and that’s the whole point.
Chain participation usually narrows before price fully rolls over. That is where late-cycle PnL is made or lost.
A strong exit process starts with market breadth, not headlines. Price can keep grinding higher while fewer sectors, fewer chains, and fewer leader wallets are still carrying the move. That is a weaker tape than it looks, and it usually shows up on-chain before it shows up in the chart.
One useful late-cycle filter is chain-specific strength. Broad alt exposure is less reliable once liquidity fragments. A CryptoRank analysis argues that altcoin rallies have become less tied to Bitcoin and that a broad alt rally in 2026 is unlikely. The same analysis says 2025 token launches diluted capital by 300% versus 2021, Solana and Base wallets posted 15 to 20 percent higher PnL during "silent recessions," Ethereum wallets underperformed by 10 percent, and Solana smart-money entries led BTC pumps by 2 to 4 weeks.
I would not use one source as a complete market model. I would use it as a prompt to tighten execution. Late in the cycle, the better question is not "Is crypto still bullish?" It is "Which chains are still paying skilled risk-taking, and which ones are already in distribution?"
That is where Wallet Finder.ai becomes practical instead of theoretical. Build separate watchlists for Solana, Base, Ethereum, and Bitcoin-native traders. Filter for wallets with consistent realized gains, not one lucky moonshot. Then set sell alerts for the wallets that have historically exited well into strength. If a cluster of high-conviction wallets starts reducing size on one chain while another chain still attracts fresh entries, that divergence matters more than a generic altseason narrative.
A peak-management process should stay mechanical:
The market top often looks healthiest right before participation thins out.
Realized profit is the scorecard. If exits are not tied to wallet behavior, breadth deterioration, and chain rotation, the trade is still running on hope.
Wallet Finder.ai helps traders turn crypto cycle theory into a usable workflow. You can discover profitable wallets across Ethereum, Solana, Base, and other ecosystems, review full trading histories, filter by PnL, consistency, and recent gains, then set real-time alerts when tracked wallets buy or sell. If you want a faster way to act on bull run dates instead of reacting late, explore Wallet Finder.ai.

A premier DeFi analytics platform empowering traders to discover and analyze profitable blockchain wallets, trades and tokens.

