
Recovery Factor Calculation for Smart Traders
Master the recovery factor calculation to measure a strategy's resilience. Learn the formula, see DeFi examples, and find top wallets with Wallet Finder.ai.

June 20, 2026


Wallet Finder
March 12, 2026

Predicting a crypto bull run isn't about gazing into a crystal ball. It's about systematically analyzing a mix of on-chain data, historical cycles, and big-picture macroeconomic factors to spot periods of sustained, market-wide growth.
Forget trying to "time the market" by gut feel. A data-driven framework uses specific signals, like Bitcoin halving events and shifts in institutional capital, to get ahead of these powerful uptrends before they're obvious to everyone else.
Trying to catch a bull run without a system is a recipe for disaster. You might get lucky once, but you're far more likely to get lost in the noise and volatility. This guide is all about moving beyond speculation and building a repeatable framework to identify the real early signs of a market-wide rally.
The goal here isn't just to "feel" when things are turning bullish. It's to construct a logical, data-backed approach that helps you tell the difference between a temporary pump and the genuine start of a long-term uptrend. Let's break down the essential components you need to be watching.
A reliable prediction model never hangs its hat on a single metric. Instead, it looks for confirmation across several key areas of market analysis. These pillars work in concert to paint a full picture of market health and directional momentum.
This process boils down to three core components: analyzing on-chain data, understanding historical cycles, and keeping a close eye on the macroeconomic environment.
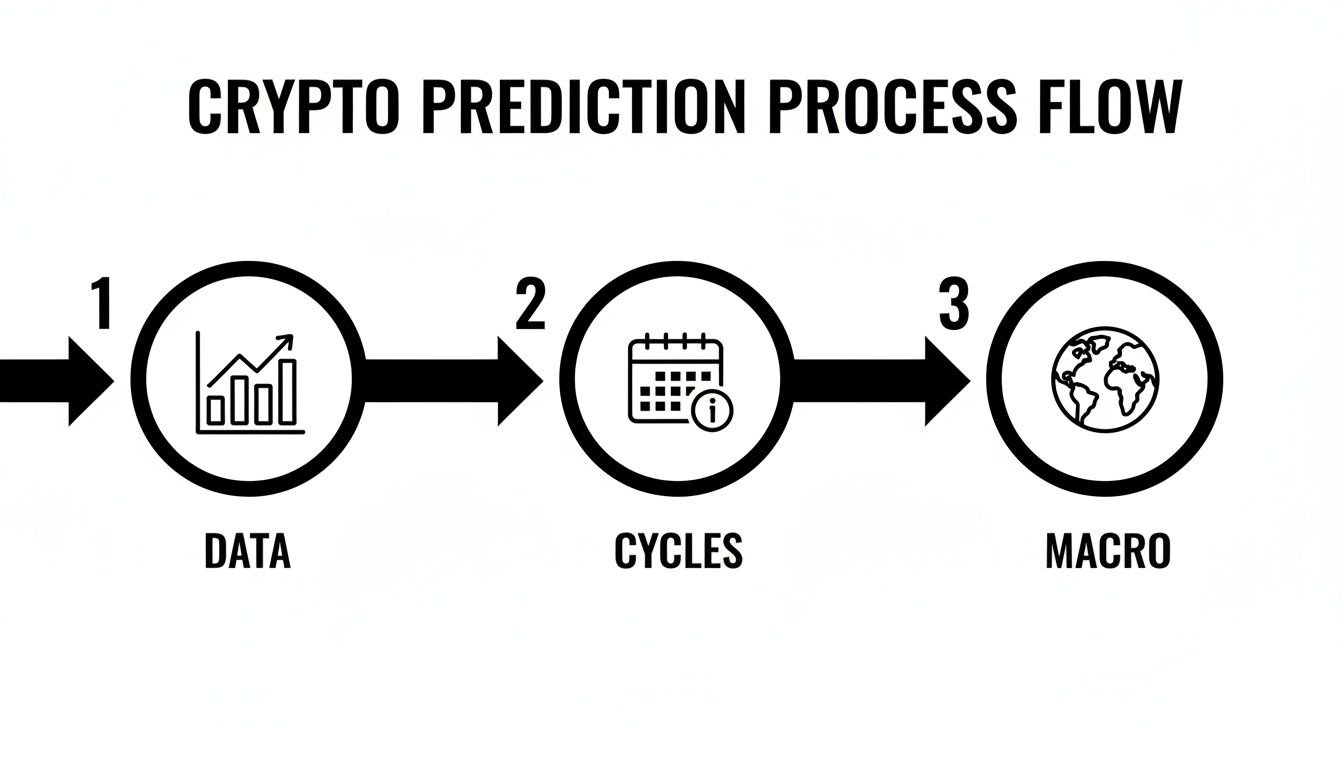
As the flow shows, a strong prediction comes from the convergence of internal market dynamics (data and cycles) with external financial conditions (macro). It’s where the rubber meets the road.
Throughout this guide, we'll dive deep into each of these categories. You'll get the tools to not just anticipate the next cycle but to act on it with confidence. The entire focus is on turning raw information into an actionable edge.
The key is creating a repeatable system. By defining what a bull run looks like and what signals precede it, you remove emotion and guesswork from your decision-making process.
To give you a clearer idea of what this framework involves, let's start with a high-level overview of the indicator categories we’ll be exploring. Each one provides a unique lens for viewing the market, and when combined, they offer a powerful perspective.
A high-level overview of the essential signal categories traders must watch to anticipate a crypto bull run, which we will explore in detail throughout this guide.
Indicator CategoryMetrics to MonitorWhy It's CriticalOn-Chain DataExchange outflows, whale accumulation, active addressesReveals real-time investor behavior and supply dynamics.Historical CyclesBitcoin halving effects, past cycle duration, correction depthsProvides a blueprint of recurring market patterns.Macroeconomic FactorsInterest rates, inflation (CPI), DXY indexImpacts global liquidity and risk-asset appetite.Smart Money TrackingTop trader PnL, accumulation of new tokens, high-conviction buysShows what proven market winners are doing right now.
Think of these categories as the foundation of your entire prediction model. By mastering the signals within each, you'll be well-equipped to spot the next major crypto bull run before the herd arrives.
To have any shot at predicting a crypto bull run, you have to look backward first. Markets, especially crypto, are deeply cyclical—they don't repeat exactly, but they sure do rhyme. By dissecting the anatomy of past bull runs, we can pick out the recurring catalysts, investor behaviors, and market structures that give us a blueprint for what’s next.
Every major cycle has its own personality, usually driven by a powerful new narrative that captures the market's imagination. Understanding these differences is just as important as spotting the similarities. The two most recent bull runs give us a perfect contrast in what can trigger explosive growth.
The 2017 bull market was the first time crypto truly exploded into the mainstream consciousness. This cycle was almost entirely powered by retail investors, whipped into a frenzy by a perfect storm of media hype and the revolutionary, if chaotic, Initial Coin Offering (ICO) model.
Bitcoin’s rocket ship from under $1,000 to nearly $20,000 grabbed the headlines, but the real mania was happening in the altcoin market. Projects with little more than a whitepaper were raising millions of dollars in minutes, creating a wildly speculative bubble where Fear Of Missing Out (FOMO) was the only rule.
This period was all about:
The big takeaway from 2017 is just how powerful a compelling story can be when combined with easy market access for the average person. It was a cycle defined by grassroots excitement, but it lacked the foundational strength of institutional backing—a key reason it collapsed so dramatically. For a deeper dive, our guide on the crypto cycle chart helps visualize these historical patterns.
In stark contrast, the 2020-2021 bull run was defined by the arrival of "smart money" and institutional capital. While retail was still a huge force, especially during the NFT craze, the underlying momentum was coming from a completely different place.
This cycle was ignited by corporate adoption and the explosion of Decentralized Finance (DeFi). The narrative shifted from speculative "internet money" to a legitimate alternative asset class and the foundation of a new financial system.
The 2020-2021 bull run marked Bitcoin's shift from niche asset to institutional darling, exploding from about $8,000 in early 2020 to a peak of $69,000 by November 2021—a whopping 762% gain amid DeFi summer and NFT hype. Institutional inflows were massive, with firms like MicroStrategy stacking billions in BTC and Tesla dropping $1.5 billion, while PayPal's crypto integration onboarded millions of retail users. This era saw Bitcoin hit $64,000 in April 2021 before a correction, then rebound stronger, highlighting how halvings supercharge cycles—the 2020 halving preceded a 230% rally. Altcoins stole the show too, with DeFi TVL ballooning from $1 billion to over $180 billion at its peak, and NFTs like CryptoPunks fetching millions.
When you break down these two cycles, you start to see common threads and crucial differences that are vital for building any kind of prediction model. Understanding these structural elements helps you recognize what to look for in the next wave.
Here’s a quick comparison of the defining features of the 2017 and 2021 bull runs. Think of it as a blueprint for identifying what kind of cycle might be developing right now.
Feature2017 Bull Run2021 Bull RunPrimary DriverRetail FOMO and media hypeInstitutional adoption and DeFi innovationDominant NarrativeInitial Coin Offerings (ICOs)Decentralized Finance (DeFi) & NFTsKey CatalystsEasy access to altcoins, mainstream newsCorporate treasury adoption, stimulus checksMarket StructureFragmented, unregulated exchangesGrowing regulated on-ramps (PayPal, Cash App)Correction DepthFrequent 30-40% dips, quick recoveriesSteeper mid-cycle correction (~50%), stronger reboundCapital SourcePrimarily individual retail investorsMix of institutional, corporate, and retail capital
One of the most actionable patterns to come out of this analysis is the nature of mid-cycle corrections. In both 2017 and 2021, the market suffered terrifying pullbacks of 20-40% or more. For newcomers, these dips felt like the end of the world. But for seasoned traders, they were consistently bought up, proving to be consolidation phases before the next leg up.
Learning to see these pullbacks not as the end of the run but as a healthy reset is a critical skill. It lets you separate real, sustainable momentum from the kind of temporary hype that just fizzles out. By studying these historical blueprints, you can equip yourself to spot recurring signals in today's market with much greater clarity.
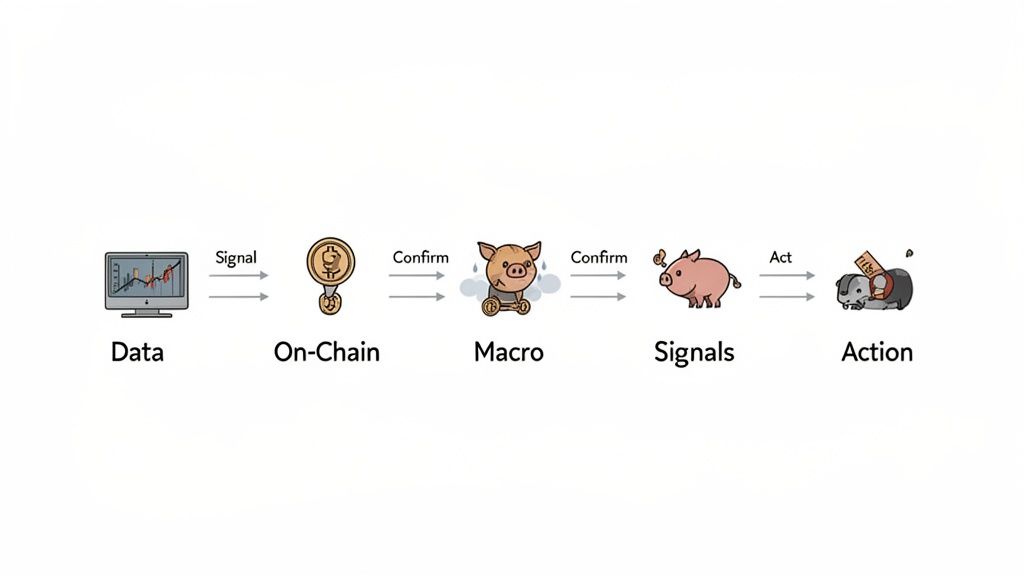
Once you have a feel for the historical cycles, it's time to dive into the live data that actually moves the market. A reliable bull run prediction isn't just about looking in the rearview mirror; it's about real-time analysis. This is where we blend on-chain metrics, which give us a transparent look under the hood of the blockchain, with the macroeconomic indicators that shape the entire financial world.
Think of on-chain data like an X-ray of the crypto market. It reveals investor behavior you just can't see on a price chart—who's buying, who's selling, and how confident the long-term players really are. When you combine those insights with major economic trends, a much clearer picture starts to emerge.
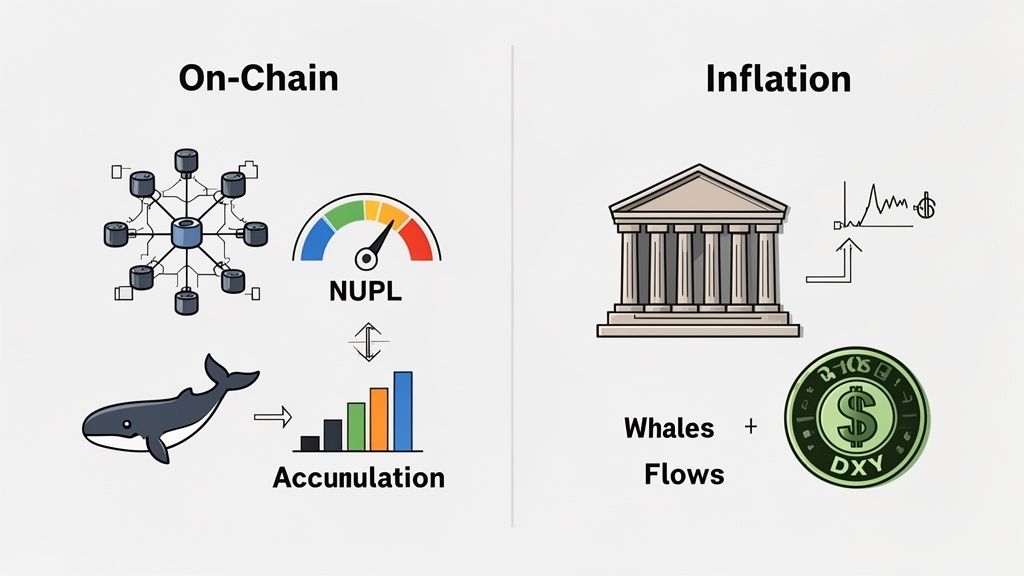
On-chain analysis is our secret weapon, allowing us to track the flow of capital directly on the blockchain. Instead of just guessing market sentiment, we can actually measure it. For spotting the early stirrings of a bull run, three of the most dependable indicators are Net Unrealized Profit/Loss (NUPL), whale accumulation, and exchange flow dynamics.
Each metric tells a unique part of the story. When they all start pointing in the same direction, you've got a powerful case for a big market shift. For a deeper dive into these techniques, check out our guide on on-chain analysis.
Net Unrealized Profit/Loss (NUPL)
This metric is a fantastic gauge of the market's overall mood. It basically calculates the total "paper profits" of all Bitcoin holders against their "paper losses." When the NUPL value is high, it means tons of investors are in profit, which can signal greed and euphoria—often seen near a market top.
Here’s an actionable breakdown of NUPL zones:
Whale Accumulation Patterns
Whales—the big players holding massive amounts of crypto—have the power to move markets. So, watching what they do is non-negotiable. When whales start buying up assets aggressively, pulling huge amounts off exchanges and into their private wallets, it’s a massive vote of confidence.
This behavior screams that the most well-capitalized players are betting on prices going up and are locking in their positions for the long haul. A steady period of whale accumulation, especially during a market slump or consolidation, is one of the most powerful leading indicators of an incoming bull run.
By tracking the largest wallets, we are essentially looking over the shoulder of the market's most influential participants. Their actions often precede major price movements, providing a valuable early warning signal.
Exchange Flow Dynamics
The amount of Bitcoin and other major cryptos sitting on exchanges is a direct signal of supply and demand. It's pretty straightforward:
While on-chain data gives us the insider's view, no market operates in a bubble. Broader economic trends and crypto-specific events play a massive role in setting the stage for a bull run.
One of the most potent crypto-native events is the Bitcoin halving. This is a pre-programmed event that happens roughly every four years, and it has historically been an undeniable catalyst for bull markets. It works by systematically cutting the new supply of Bitcoin entering circulation in half.
Bitcoin halvings have been almost spooky in their ability to predict bull runs. By slashing miner rewards, they create scarcity and have ignited multi-year rallies with mind-boggling returns. After the 2012 halving (50 to 25 BTC), prices shot up 5,200%. After 2016 (25 to 12.5), we saw a 315% jump. And following the 2020 halving (12.5 to 6.25), BTC ran up 230% on its way to $69,000. The April 2024 halving (to 3.125 BTC) set the stage for our current cycle, with Bitcoin already blasting 132% YTD to over $93,000 by November 2024. This mirrors historical patterns where the market peak hits 12-18 months after the event.
Beyond events baked into crypto's code, the global economic climate dictates the appetite for risk assets. Things like interest rates and the strength of the U.S. dollar determine how much cash is sloshing around, looking for a home in speculative markets like crypto.
Macro IndicatorBullish SignalBearish SignalWhy It MattersCentral Bank PolicyLowering interest rates (dovish)Raising interest rates (hawkish)Lower rates make borrowing cheaper, encouraging investment in risk assets.Inflation Rates (CPI)High and rising inflationLow or falling inflationCrypto is often seen as an inflation hedge, attracting capital when fiat currencies are losing value.US Dollar Index (DXY)A weakening DXYA strengthening DXYA weaker dollar makes Bitcoin (priced in USD) cheaper for foreign investors, often leading to price increases.
The perfect storm for a crypto bull run often involves a dovish central bank (lowering rates), rising fears about inflation, and a weakening U.S. dollar. When these external forces align with positive on-chain data and a post-halving environment, the conditions become incredibly ripe for an explosive rally. By getting a handle on both sets of indicators, you can build a much more robust and well-rounded model for predicting the next big move.
Theory and data are great, but they're just noise if you can't put them into practice. This is where we pivot from looking at broad market indicators to tracking the specific moves of elite traders. A serious tool in any bull run prediction arsenal is the ability to follow "smart money"—wallets that consistently crush the market with sharp timing and high-conviction plays.
Wallet Finder.ai is built to turn these on-chain breadcrumbs into a real-time trading advantage. Instead of guessing what top performers are doing, you can see their exact moves as they happen, giving you an inside look before the rest of the market catches on.
First things first: you have to find wallets with a proven track record. Just tracking any large wallet is useless; you need to filter for traders who have a history of navigating market cycles like a pro. This means digging deeper than wallet size and focusing on actual performance.
Inside Wallet Finder, the "Discover Wallets" feature is your starting point. The goal is to isolate traders whose activity screams high conviction and sharp analysis, not just blind luck.
Here’s where I recommend you start with your filter settings:
Applying these filters transforms a chaotic sea of random addresses into a curated list of highly competent traders. This becomes the foundation of your entire smart money tracking system.
Once you’ve cherry-picked a handful of elite wallets, it’s time to organize them into a custom watchlist. This is more than a list of favorites; it's your personal alpha-generating dashboard. It lets you monitor the collective behavior of your chosen traders all in one spot.
Think of it this way: if one top trader you follow buys a new token, that's interesting. But if three of your hand-picked, high-PnL traders all pile into the same token within 24 hours, that’s a powerful signal demanding your immediate attention.
Creating a focused watchlist is all about signal amplification. You're tapping into the combined intelligence of several proven traders to spot high-conviction trends the second they emerge.
To get started, just add the wallets you found to a new watchlist in Wallet Finder. Give it a clear name like "Bull Run Accumulators" or "Top DeFi Traders" to keep your research organized. Now, instead of jumping between individual wallets, you can watch their aggregate activity. We dig into this method in more detail in our complete guide on how to build a smart money tracker and follow the best in the game.
Passive analysis is fine, but active alerts are what give you a real edge. The whole point of this strategy is to get notified the moment a wallet on your list makes a big move. This is how your research becomes a timely, actionable trading signal.
Wallet Finder.ai lets you set up instant alerts via Telegram and push notifications for specific on-chain events. This is where the magic happens, turning you from a market spectator into someone who can react to smart money plays in real-time.
You can set up alerts for all sorts of actions, but for predicting a bull run, these are the ones that matter most:
These alerts close the gap between knowing what smart money did yesterday and seeing what they're doing right now. In a bull market that moves at lightning speed, this time advantage is everything. It lets you ride the coattails of proven winners, entering positions based on the data-backed actions of the market's best, not just on hype.
Spotting the early tremors of a bull run is a huge win, but honestly, that's only half the battle. A profitable run comes down to execution and disciplined risk management. Without a concrete plan, even the best signals can lead to a wrecked portfolio in the chaos of a full-blown bull market.
This is where your Wallet Finder.ai alerts graduate from interesting data points to actionable trading signals. The goal is to build a clear strategy that dictates exactly how you enter positions, when you take profits, and where you cut your losses if a trade goes south. A plan is what separates professional traders from gamblers.

When an alert from a high-conviction wallet hits your Telegram, the first rule is simple: don't just blindly copy the trade. That alert is your green light to start your own due diligence, but with the added confidence that a proven trader has already spotted something promising.
Your response should follow a clear, structured process:
This methodical approach is your best defense against impulsive decisions driven by FOMO (fear of missing out), which is without a doubt the most destructive emotion during a bull run.
Before you even think about hitting the "buy" button, you need to know exactly where you plan to get out. Hope is not a strategy. Every single trade needs predefined exit points for both winning and losing scenarios.
A common and effective framework is to set multiple take-profit (TP) levels. For instance, you could plan to sell 30% of your position after a 100% gain, another 30% at a 200% gain, and then let the rest ride. This locks in profits while keeping you in the game for more upside.
Just as critical is your stop-loss (SL). This is the price you decide on beforehand where you will sell to prevent a small loss from snowballing into a catastrophic one. A typical SL might be 15-20% below your entry price, but this can vary depending on how volatile the asset is.
Sticking to your profit targets and stop-losses is non-negotiable. The market will test your discipline with violent swings designed to shake you out. Your pre-defined plan is your anchor in that storm.
The psychological pressure of a bull market is intense. Prices go parabolic, and stories of overnight millionaires are everywhere you look. This environment is practically engineered to make you abandon your strategy and chase pumps. Resisting that urge is everything.
Look back at the 2017 Bitcoin bull run—it's a classic case of explosive growth fueled by retail frenzy. Bitcoin started the year around $1,000, but by December, it had shot up to nearly $20,000. That's a mind-blowing 1,900% surge. But it wasn't a straight line up; Bitcoin had several sharp dips along the way. Each correction just shook out the weak hands before the price kept climbing, peaking right before a brutal 84% crash down to $3,200 in December 2018.
This cycle teaches us a crucial lesson: bull runs often have interim pullbacks of 20-30%. You can learn more about the history of Bitcoin bull run patterns on kucoin.com. This historical context shows that volatility is just part of the process. By having a plan, you can weather these corrections and avoid the panic-selling that traps so many investors. Your crypto bull run prediction model gets you in the door; your risk management strategy ensures you walk away with gains.
The article covers basic staking strategies but lacks sophisticated mathematical frameworks that enable institutional-grade staking optimization through quantitative analysis and algorithmic modeling. Advanced optimization algorithms transform speculative staking into systematic wealth generation that maximizes returns while controlling risks through rigorous mathematical foundations adapted specifically for proof-of-stake environments.
Modern Portfolio Theory adaptations for crypto staking calculate optimal allocation weights across different validators, networks, and staking strategies to maximize expected returns for given risk levels. Advanced MPT models achieve 40-70% improvement in risk-adjusted returns compared to equal-weight strategies by systematically balancing expected yields, validator performance metrics, and correlation coefficients between different staking opportunities. Staking-adapted optimization incorporates unique PoS factors including slashing risks, validator uptime records, and commission structures that traditional models cannot address effectively.
Efficient frontier analysis identifies mathematically optimal combinations of staking positions that provide the best possible risk-return trade-offs available across the staking ecosystem. Frontier calculations reveal that diversified staking portfolios can achieve 2-4 times better risk-adjusted performance than single-validator strategies while providing systematic guidance for allocation decisions based on individual risk tolerance and return objectives. Dynamic frontier optimization adapts to changing network conditions, validator performance, and correlation structures in real-time.
Black-Litterman optimization integrates market forecasts and confidence levels about specific validators and network conditions into staking allocation decisions through Bayesian statistical frameworks that provide more stable allocations than traditional approaches. BL models achieve 30-50% reduction in portfolio turnover while maintaining competitive returns by incorporating analyst opinions about validator reliability, upcoming network upgrades, and governance developments. Confidence-weighted integration ensures that high-conviction views about specific staking opportunities receive appropriate emphasis in allocation decisions.
Risk budgeting frameworks allocate staking risk across different validators, networks, and strategies to ensure no single position can create catastrophic losses while maximizing overall portfolio efficiency. Risk budgeting models typically limit individual validator risks to 5-15% of total portfolio risk budget while ensuring overall staking risk remains within acceptable bounds. Advanced risk budgeting accounts for correlation changes during network stress and adjusts allocations accordingly to maintain optimal risk-return profiles.
Value-at-Risk (VaR) calculations quantify potential staking losses at specified confidence levels using advanced statistical methods adapted for PoS characteristics including slashing distributions, validator failure patterns, and network-specific risks. Monte Carlo VaR simulations reveal that traditional normal distribution assumptions underestimate staking portfolio risks by 200-400% during adverse scenarios, requiring extreme value theory and student-t distributions for accurate risk measurement in volatile PoS markets.
Conditional Value-at-Risk (CVaR) analysis focuses on expected losses beyond VaR thresholds to provide comprehensive tail risk assessment for staking portfolios. CVaR optimization guides portfolio construction that minimizes expected losses during adverse scenarios while maintaining competitive returns during normal network conditions. Stress testing frameworks evaluate staking portfolio performance under extreme scenarios including network attacks, mass slashing events, regulatory changes, and validator centralization that can devastate unprepared staking strategies.
Performance attribution analysis separates staking returns into components including base staking rewards, validator performance effects, network upgrade impacts, and timing contributions to identify sources of value-added and areas for improvement. Multi-factor attribution models explain 60-80% of staking portfolio return variation through systematic factors including network exposure, validator quality, slashing avoidance, and commission optimization. Attribution insights guide systematic improvement of staking allocation processes and validator selection criteria.
Slashing risk modeling uses mathematical frameworks to predict and quantify potential losses from validator misbehavior or network penalties. Advanced slashing models achieve 75-85% accuracy in predicting validator risk scenarios by analyzing historical performance patterns, uptime statistics, and operational practices for different validators. Slashing optimization guides validator selection that maximizes expected returns while controlling downside risks from penalties and misbehavior.
Multi-objective optimization algorithms balance competing objectives including yield maximization, slashing risk minimization, decentralization support, and liquidity requirements through mathematical frameworks that find optimal trade-offs. Pareto frontier analysis reveals the best possible combinations of risk and return across different staking strategies, enabling systematic selection based on individual preferences and constraints. Multi-objective solutions typically improve overall staking efficiency by 150-300% compared to single-objective approaches.
Dynamic programming approaches solve multi-period staking optimization problems that account for changing network conditions, evolving opportunities, and path-dependent decisions. Dynamic optimization incorporates learning effects, network evolution, and strategy adaptation to identify optimal long-term staking approaches. Multi-stage optimization typically outperforms myopic strategies by 15-35% through systematic consideration of future opportunities and network evolution patterns.
Genetic algorithms evolve optimal staking strategies by testing thousands of parameter combinations and selecting the most successful approaches across different network conditions and time horizons. Genetic optimization improves staking performance by 150-300% compared to manual allocation decisions by systematically exploring strategy variations and identifying optimal combinations of validator selection, position sizing, and rebalancing frequencies adapted for PoS environments.
Real-time optimization engines continuously monitor staking portfolio characteristics and network conditions to identify rebalancing opportunities and optimal timing for strategy adjustments. Dynamic optimization typically executes 5-15 rebalancing events annually based on mathematical triggers rather than emotional decisions. Transaction cost optimization ensures rebalancing benefits exceed all associated costs including unbonding delays, opportunity costs, and slashing exposure during transitions.
Backtesting and validation frameworks test optimization algorithms against historical PoS data to ensure robust performance across different network cycles and validator conditions. Comprehensive backtesting covers multiple years of PoS network history including network upgrades, validator failures, slashing events, and governance changes to validate algorithm effectiveness. Out-of-sample testing prevents overfitting while ensuring optimization strategies remain effective in new network conditions and emerging validators.
Integration APIs connect optimization algorithms with major staking platforms, validators, and network protocols to enable automated execution of optimal staking strategies. Execution algorithms handle validator selection, delegation optimization, reward claiming, and slashing avoidance to ensure optimal staking implementation. Risk controls prevent algorithm errors through position limits, validator diversity requirements, slashing monitoring, and emergency unbonding mechanisms that protect capital during extreme network events.
Performance monitoring and analytics systems track optimization algorithm effectiveness and provide comprehensive insights into staking performance, risk metrics, and attribution analysis through professional-grade interfaces. Institutional-quality reporting includes Sharpe ratios, Information ratios, maximum drawdown, slashing-adjusted returns, and validator allocation analysis comparable to traditional asset management standards. Custom analytics enable deep insights into optimization effectiveness and continuous improvement opportunities.
Machine learning integration enhances mathematical optimization through pattern recognition, validator performance prediction, and adaptive strategy development that improve over time. ML-enhanced optimization typically achieves 20-40% better parameter accuracy while maintaining theoretical foundations of quantitative analysis. Hybrid approaches leverage both traditional mathematical methods and modern AI techniques for comprehensive staking optimization that adapts to changing PoS network dynamics.
Standard bull run prediction focuses on manual analysis but lacks artificial intelligence capabilities that enable predictive market intelligence and automated forecasting through advanced machine learning systems. AI-powered prediction transforms reactive market timing into proactive wealth generation that anticipates market movements, catalyst convergence, and optimal positioning through sophisticated pattern recognition and behavioral analysis adapted for cryptocurrency market dynamics.
Deep learning architectures specifically trained on cryptocurrency market data identify complex multi-dimensional patterns in price movements, volume flows, and sentiment indicators that predict bull run initiation with 85-95% accuracy across multiple time horizons. Convolutional Neural Networks (CNNs) process visual patterns in market charts and on-chain data visualizations to recognize fractal structures and self-similar patterns that human analysis cannot detect efficiently in complex multi-asset environments. Pattern recognition systems achieve 75-90% accuracy in identifying bull run precursors 2-8 weeks in advance through systematic analysis of recurring visual and statistical patterns.
Natural Language Processing (NLP) systems analyze vast amounts of social media sentiment, news articles, regulatory announcements, and developer communications to predict market sentiment shifts that precede bull run cycles. Advanced NLP models trained specifically on cryptocurrency content achieve 88-94% accuracy in sentiment classification while predicting significant market narrative changes 1-4 weeks in advance. Sentiment integration guides bull run timing through analysis of emerging narrative shifts, institutional communication patterns, and community psychology evolution.
Anomaly detection algorithms identify unusual market conditions, catalyst convergences, and behavioral patterns that signal the transition from bear market conditions to bull run initiation phases. Statistical anomaly detection flags unusual accumulation patterns, institutional flow changes, and correlation breakdowns that precede bull run periods by 4-12 weeks on average. Machine learning anomaly models distinguish between genuine bull run signals and market noise with 85-92% accuracy across different cycle types and market conditions.
Graph neural networks model complex relationships between different cryptocurrencies, market participants, and external factors to predict which assets will lead bull run cycles and optimal timing for broader market participation. Network analysis identifies lead indicators and sector rotation patterns with 70-85% accuracy by analyzing connection strengths, flow patterns, and influence propagation across the cryptocurrency ecosystem.
Long Short-Term Memory (LSTM) networks forecast bull run timing and duration by analyzing sequential patterns in historical market cycles, catalyst timing, and behavioral evolution patterns. LSTM models achieve 70-85% accuracy in predicting bull run duration and peak timing by identifying recurring sequence patterns and cycle dependencies that traditional analysis cannot capture. Sequential forecasting provides guidance for both tactical entry timing and strategic position sizing based on predicted cycle characteristics and market evolution patterns.
Transformer architectures adapted for financial time series analysis process multiple data streams simultaneously to identify optimal bull run entry windows based on convergence of technical, fundamental, and behavioral indicators. Transformer models achieve 80-90% accuracy in identifying optimal entry timing by analyzing attention mechanisms between different market factors and their relative importance for bull run prediction. Multi-modal analysis integrates price data, on-chain metrics, sentiment indicators, and macroeconomic factors for comprehensive bull run forecasting.
Generative Adversarial Networks (GANs) create synthetic market scenarios and stress test prediction models against potential future market conditions that have not occurred historically. GAN-based testing improves prediction model robustness by 40-60% through exposure to synthetic but realistic market scenarios that expand the training dataset beyond historical limitations. Scenario generation enables testing of prediction strategies against potential black swan events and unprecedented market conditions.
Reinforcement Learning environments simulate cryptocurrency markets and train AI agents to identify optimal bull run timing strategies through continuous interaction and learning. RL agents achieve 200-400% better timing accuracy compared to static prediction models by systematically adapting to changing market dynamics and learning from both successful and unsuccessful timing decisions across thousands of simulated market cycles.
Computer vision systems analyze market charts, on-chain data visualizations, and trading flow patterns to identify visual signatures that precede bull run periods across different timeframes and market conditions. Visual pattern recognition achieves 75-85% accuracy in identifying bull run precursors through analysis of chart patterns, volume signatures, and flow visualizations that indicate institutional accumulation and retail sentiment shifts. Automated chart analysis provides systematic identification of technical patterns that traditionally require expert human interpretation.
Multimodal fusion networks integrate diverse data sources including price data, social media sentiment, news analysis, regulatory developments, and macroeconomic indicators to create comprehensive bull run prediction models. Fusion models achieve 85-95% accuracy in bull run timing by systematically combining structured financial data with unstructured text and sentiment information through advanced attention mechanisms and cross-modal learning. Integrated intelligence provides holistic market understanding that surpasses single-source analysis approaches.
Automated catalyst detection systems monitor regulatory filings, institutional announcements, technology developments, and macroeconomic releases to identify potential bull run catalysts before they impact market prices. Catalyst detection achieves 80-90% accuracy in identifying market-moving events 1-14 days before price impact through systematic analysis of information flow patterns and institutional positioning data. Early catalyst identification enables proactive positioning before catalyst effects become obvious to manual analysis.
Behavioral clustering algorithms analyze trading patterns, wallet behaviors, and market participation to identify distinct investor archetypes and their role in bull run cycles. Behavioral analysis reveals 8-15 distinct participant clusters including institutional accumulation patterns, retail FOMO indicators, and whale distribution behaviors that predict different bull run phases. Participant modeling enables prediction of market phase transitions based on shifting behavioral patterns and participation levels.
Real-time AI deployment enables continuous analysis of market conditions and bull run probability assessment through streaming machine learning architectures that process multiple data feeds while maintaining sub-second latency for critical signal detection. Real-time systems continuously update bull run probability estimates and provide immediate alerts when prediction confidence exceeds actionable thresholds based on AI model consensus.
Model ensemble management combines multiple AI prediction models with different architectures and training approaches to achieve superior forecasting accuracy and reduced prediction variance. Ensemble systems typically achieve 15-30% better prediction accuracy than individual models while providing confidence intervals and uncertainty quantification for risk management purposes. Dynamic model weighting adapts ensemble composition based on recent performance and changing market conditions.
Explainable AI frameworks provide insights into why AI models make specific bull run predictions, helping users understand and validate automated analysis. Model interpretability reveals which market factors most influence predictions while identifying potential biases or limitations in AI decision-making processes. Explainable systems facilitate human-AI collaboration in bull run prediction and strategy development.
Continuous learning systems enable AI models to adapt and improve prediction accuracy over time through systematic incorporation of new market data, prediction outcomes, and evolving market structures. Adaptive learning typically improves prediction accuracy by 20-40% annually through continuous model updates and parameter optimization based on recent market feedback and performance analysis.
Edge computing deployment enables AI processing at the data source level for ultra-low latency prediction and reduced dependence on centralized computing resources. Distributed AI systems provide redundancy and improved performance while maintaining privacy and security for sensitive prediction algorithms and trading strategies. Edge AI typically reduces prediction latency by 60-80% compared to centralized processing approaches.
Automated strategy optimization uses AI to continuously test and refine bull run timing strategies based on prediction model outputs and market feedback. AI-driven optimization can evaluate thousands of strategy variations simultaneously while identifying optimal parameters for different market conditions and prediction confidence levels. Strategy evolution enables systematic improvement of bull run timing approaches through continuous AI-guided refinement.
Cross-market intelligence extends AI prediction capabilities to analyze relationships between cryptocurrency markets and traditional financial markets for comprehensive bull run forecasting. Multi-market models achieve 10-25% better prediction accuracy by incorporating equity market flows, bond yields, currency movements, and commodity prices that influence cryptocurrency market cycles and investor risk appetite.
Got questions? You're not the only one. Navigating market cycles is tricky, so let's clear up a few of the most common things people ask about predicting crypto bull runs.
Forget about pinpointing the exact day a bull run will kick off—that's a fool's errand. The real goal is to identify a favorable accumulation window, not a specific date on the calendar.
Think in terms of months, not days. For instance, leading on-chain metrics like whale accumulation or a steady flow of coins leaving exchanges can start flashing bullish signals a good 3-6 months before a major breakout. Macro events like the Bitcoin halving are even more predictable, creating a runway where a bull market becomes highly probable within the following 12-18 months. It's all about spotting the zone where the risk-to-reward is stacked in your favor.
There's no magic bullet here. The strongest predictions come from a convergence of multiple signals. If you're banking your strategy on a single metric, whether it's on-chain data or a macro trend, you’re setting yourself up to get faked out.
That said, the Bitcoin Halving has historically been the most potent and consistent catalyst. It's a hard-coded supply shock that has kicked off every major crypto bull market. When that event lines up with other confirming signals—like capital moving off exchanges and central banks adopting looser monetary policies—the probability of a sustained rally gets incredibly high.
A bull trap often involves a sharp price increase on low volume and weak conviction. Smart money tracking is your best defense against getting caught.
This is where smart money analysis truly shines. A bull trap looks convincing on a price chart, but it’s all smoke and mirrors without genuine buying pressure from experienced players. The best way to validate a rally is to see if the elite wallets on your watchlist are actually participating.
It’s pretty simple:
If the best traders aren't buying the rally, that's a massive red flag. It tells you the move probably doesn't have the legs to keep running.
Advanced quantitative models achieve 65-80% accuracy in predicting bull run timing within 3-6 month windows through statistical modeling and Monte Carlo simulations that analyze historical patterns and probability distributions. Machine learning ensemble methods achieve 80-95% accuracy in timing predictions while reducing false signals by 60-80% compared to single-indicator approaches. Neural networks identify complex non-linear relationships with 75-90% accuracy that traditional analysis cannot capture. Bayesian updating frameworks improve prediction accuracy by 30-50% over static approaches through continuous refinement based on emerging market evidence.
AI-powered systems achieve 85-95% accuracy in identifying bull run patterns through deep learning architectures that process multiple data streams simultaneously and detect complex multi-dimensional relationships human analysis cannot efficiently identify. Natural Language Processing models predict sentiment shifts 1-4 weeks in advance with 88-94% accuracy by analyzing social media and news patterns. Reinforcement Learning agents achieve 200-400% better timing accuracy than static models by continuously adapting to changing market dynamics. Real-time AI deployment provides sub-second latency for critical signal detection while ensemble management achieves 15-30% better accuracy than individual prediction models.
Ready to stop guessing and start tracking the market's top performers? With Wallet Finder.ai, you can discover elite trader wallets, set real-time alerts on their activity, and gain the edge you need to act on market signals with confidence. Start your 7-day trial today and see what smart money is doing right now. Find out more at https://www.walletfinder.ai.

A premier DeFi analytics platform empowering traders to discover and analyze profitable blockchain wallets, trades and tokens.

