
Recovery Factor Calculation for Smart Traders
Master the recovery factor calculation to measure a strategy's resilience. Learn the formula, see DeFi examples, and find top wallets with Wallet Finder.ai.

June 20, 2026


Wallet Finder
June 20, 2026

A wallet can look elite on a leaderboard and still be a terrible wallet to follow.
You see a trader with massive gains, a clean feed of wins, and a token list full of names that already ran. Then you dig into the path they took to get there and realize the wallet spent long stretches underwater, sized positions too aggressively, or only survived because one late trade bailed out a brutal drawdown. Profit alone hides that story.
That's why recovery factor calculation matters for on-chain trading. It tells you how much pain a wallet had to absorb to produce its profit. If you're trying to identify wallets worth mirroring, that distinction is the difference between copying durable edge and copying a lucky survivor.
A lot of DeFi traders still rank wallets the same way beginners rank hedge funds. They start with total profit, then stop there. That shortcut breaks fast in crypto because token cycles are violent, liquidity disappears, and a wallet can print eye-catching gains after spending most of the period in a hole.
The practical question isn't just whether a wallet finished up. The practical question is how it recovered after getting hit.
Take two wallets that both end in profit. One grinds higher, takes manageable losses, and recovers quickly after bad trades. The other swings wildly, gets buried in a deep drawdown, then catches one outsized move. On a simple PnL ranking, they can look similar. In real capital allocation, they are not similar at all.
That gap is where recovery factor becomes useful. It expresses a strategy's profit-to-pain ratio. Instead of rewarding a wallet for the final snapshot alone, it asks whether the profit was produced efficiently relative to the worst drawdown suffered along the way.
Practical rule: If a wallet's path would've forced you to quit following it mid-drawdown, the end result doesn't matter much.
On-chain traders run into this constantly. A wallet can look brilliant after one rotation into a hot narrative, but if the account nearly blew up beforehand, you're not looking at a solid process. You're looking at fragile survival.
When I review wallets for copy trading, I care less about headline returns than about whether the wallet can absorb adverse periods and still recover in a controlled way. That means pairing profit with drawdown-aware metrics and benchmarking the result against other risk measures. If you need a broader frame for that, Wallet Finder's guide to benchmarking trading performance is a useful companion.
A wallet that recovers cleanly tends to show a few behaviors:
Those are the wallets worth your time. Not the ones with the loudest PnL screenshot.
In trading, Recovery Factor = Net Profit / Maximum Drawdown. That definition and the benchmark ranges used by many traders are laid out in JournalPlus's glossary on recovery factor in trading risk management.
This is a simple formula. The value comes from being strict about the inputs.
Net profit is the total profit over the period you're evaluating after losses are accounted for.
Maximum drawdown is the deepest peak-to-trough drop in the equity curve during that same period. In plain terms, it's the worst pain the strategy inflicted before recovering or ending the sample.
Put together, the metric answers one hard question: how much profit did the wallet generate for each unit of drawdown it forced you to endure?
JournalPlus notes that a Recovery Factor above 5.0 is considered very good, and above 10.0 is considered excellent. It also gives a clean example: $50,000 in net profit after a $10,000 maximum drawdown produces a Recovery Factor of 5.0, meaning the strategy made $5 for every $1 of drawdown endured. The same source also states that strategies below 3.0 are generally viewed as suboptimal in this framework.
| Recovery Factor Score | Interpretation |
|---|---|
| Below 3.0 | Generally suboptimal |
| Above 5.0 | Very good |
| Above 10.0 | Excellent |
That table is intentionally sparse because the metric isn't useful when overfitted into too many labels. In practice, the main divide is simple: low values usually signal that the path to profit was too painful relative to the reward, while higher values suggest a strategy that recovers losses efficiently.
A higher recovery factor doesn't guarantee a wallet is safe to copy. It tells you something narrower and more useful. It tells you the wallet has, over the measured period, turned drawdown into profit with better efficiency than weaker strategies.
Recovery factor is one of the fastest ways to separate smooth operators from wallets that only look good after the fact.
For DeFi traders, that matters because on-chain performance is messy. Token transfers, partial exits, unrealized PnL, and rapid rotation between ecosystems can obscure what happened. Recovery factor cuts through that noise if you calculate it from a clean equity curve.
Most traders overcomplicate this. The workflow is straightforward if you start with a time series of account value and stay consistent about the observation period.
Here's the visual process first.
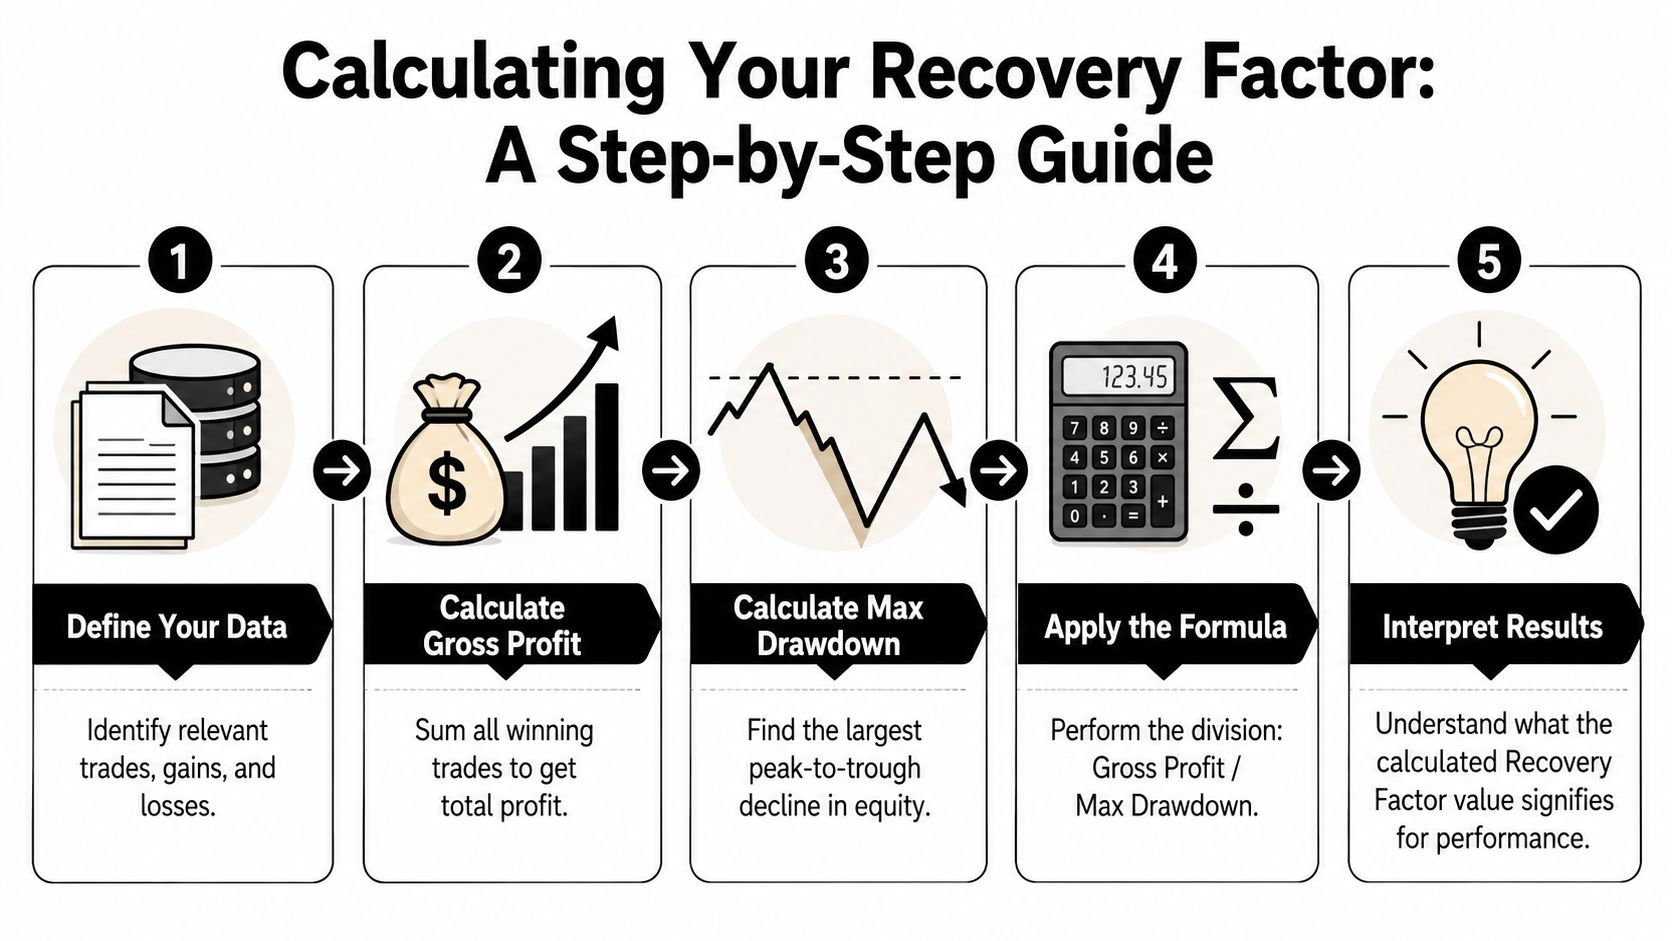
Define the evaluation window
Pick the period you want to analyze. If you mix different windows across wallets, comparisons become unreliable.
Build the equity curve
Use portfolio value over time, not just closed-trade outcomes. For DeFi wallets, that means marking holdings through time, not only reading swap logs.
Find each running peak
Move through the series and note the highest value reached so far at each point.
Measure every drop from peak to trough
For each point after a peak, compare current equity to the running peak. The largest decline is your maximum drawdown.
Compute net profit and divide
Net profit is ending equity minus starting equity over the sample. Divide that by the absolute value of maximum drawdown.
Suppose you track a portfolio through a sequence of valuations. It rises, then falls sharply, then recovers and finishes above where it started. The key point is that maximum drawdown is not the biggest losing day. It is the largest decline from a prior peak.
A clean manual workflow looks like this:
That's the whole recovery factor calculation.
For on-chain wallets, the hard part isn't the formula. It's data preparation.
You need to reconstruct wallet value over time across swaps, token balances, and any holdings that remained open while the wallet was taking new trades. If you only sum realized wins and losses, you'll understate drawdown and overstate the strategy's resilience.
A practical workflow for DeFi looks like this:
The biggest mistake in on-chain analysis is treating transaction history as performance history. They're related, but they're not the same thing.
This walkthrough helps if you're calculating manually, but seeing the process in motion can also help. This video gives a useful visual explanation of the broader idea:
What works
What doesn't
If the data going in is sloppy, the recovery factor coming out will look precise but tell you very little.
Once you move beyond a handful of wallets, manual tracking becomes a waste of time. You want a repeatable pipeline that computes drawdown from the equity curve and returns recovery factor in one pass.
This version assumes you already have a dataframe of timestamped portfolio values.
import pandas as pdimport numpy as np# Example structure:# df = pd.DataFrame({# "timestamp": [...],# "equity": [...]# })df = df.sort_values("timestamp").copy()# Running peak of the equity curvedf["running_peak"] = df["equity"].cummax()# Drawdown as the drop from the running peakdf["drawdown"] = df["equity"] - df["running_peak"]# Maximum drawdown as an absolute valuemax_drawdown = abs(df["drawdown"].min())# Net profit over the samplenet_profit = df["equity"].iloc[-1] - df["equity"].iloc[0]# Recovery Factorrecovery_factor = np.nanif max_drawdown != 0:recovery_factor = net_profit / max_drawdownprint("Net Profit:", net_profit)print("Max Drawdown:", max_drawdown)print("Recovery Factor:", recovery_factor)A few implementation notes matter more than the code itself:
If your equity snapshots live in a warehouse, window functions do the heavy lifting.
WITH ordered AS (SELECTwallet_address,ts,equity,MAX(equity) OVER (PARTITION BY wallet_addressORDER BY tsROWS BETWEEN UNBOUNDED PRECEDING AND CURRENT ROW) AS running_peak,FIRST_VALUE(equity) OVER (PARTITION BY wallet_addressORDER BY ts) AS start_equity,LAST_VALUE(equity) OVER (PARTITION BY wallet_addressORDER BY tsROWS BETWEEN UNBOUNDED PRECEDING AND UNBOUNDED FOLLOWING) AS end_equityFROM wallet_equity_snapshots),drawdowns AS (SELECTwallet_address,ts,equity,running_peak,equity - running_peak AS drawdown,start_equity,end_equityFROM ordered),summary AS (SELECTwallet_address,MIN(drawdown) AS min_drawdown,MAX(end_equity - start_equity) AS net_profitFROM drawdownsGROUP BY wallet_address)SELECTwallet_address,net_profit,ABS(min_drawdown) AS max_drawdown,CASEWHEN ABS(min_drawdown) = 0 THEN NULLELSE net_profit / ABS(min_drawdown)END AS recovery_factorFROM summary;Automation gives you two advantages. First, it removes hand-calculation errors. Second, it lets you compare recovery factor against other risk metrics in the same pipeline. If you want to pair it with volatility-based analysis, this Sharpe ratio calculator guide is a logical next read.
The core principle stays the same in both Python and SQL. Build the equity curve correctly, compute running peaks, isolate the worst decline, then divide profit by drawdown.
Most bad recovery factor analysis fails before the formula is applied. The mistake usually sits in the assumptions.
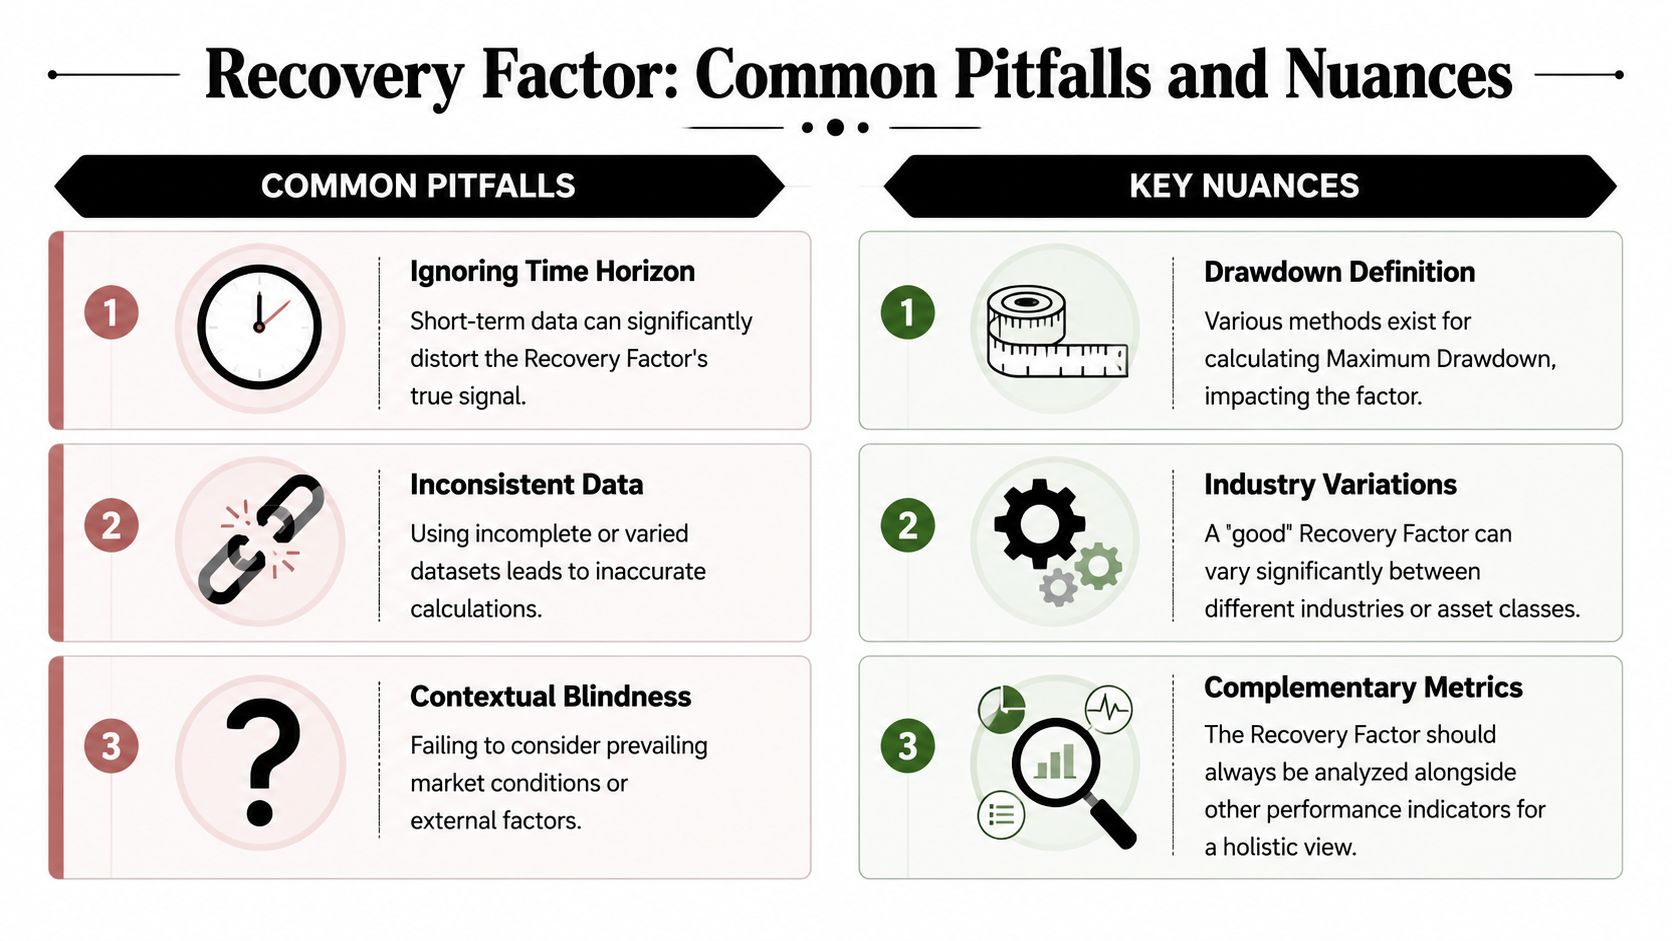
A high score can still be misleading if the sample is weak.
These aren't edge cases. They're normal data problems in on-chain analysis.
If the equity curve is incomplete, recovery factor becomes a confidence trick dressed up as a risk metric.
There's another issue that catches traders off guard. The phrase recovery factor doesn't belong only to trading.
In oil and gas, recovery factor refers to the share of hydrocarbons that can be extracted from a reservoir, not a profit-to-drawdown ratio. One benchmark often cited for the UK Continental Shelf is an expected average recovery factor of about 43%, as discussed in this oil and gas recovery factor reference. That figure has nothing to do with wallet analysis, copy trading, or risk-adjusted performance.
The confusion gets worse because the term also appears in other energy contexts. ScienceDirect notes that recovery factor definitions vary by system type and that generic answers can mislead when they ignore the application domain, which is why analysts need to anchor the term to the actual use case in its engineering overview of recovery factor.
That matters for practitioners because a search result may look authoritative while answering the wrong question entirely.
Recovery factor works best when you treat it as one lens, not a verdict. Use it to screen for resilience, then inspect the path:
Used that way, it becomes highly practical. Used in isolation, it can send you into fragile wallets that only look disciplined on paper.
The manual route is useful for understanding the math. It's not how most traders should run day-to-day research.

A useful workflow does three things well:
That's where a dedicated on-chain analytics tool is more practical than spreadsheet-first analysis. Wallet Finder.ai is one example. It tracks wallets across major ecosystems, surfaces trade histories, and lets users filter for performance characteristics that help identify resilient wallets rather than just profitable ones.
When you screen wallets, don't treat recovery factor as a standalone buy signal. Use it as a first-pass quality filter.
A process that works well looks like this:
A high recovery factor is more convincing when the wallet also shows coherent behavior. You want to see entries and exits that make sense, position sizing that doesn't lurch from tiny to reckless, and a pattern of recovery that isn't dependent on one rescue trade.
The practical benefit of a platform workflow is speed. You can move from idea generation to wallet validation without rebuilding the dataset every time a new address catches your eye. That matters when narratives rotate fast and the opportunity window is short.
Recovery factor is strong at one job. It tells you how efficiently a strategy converted drawdown pain into net profit. It doesn't tell you everything else you need to know.
Think of the metric as a durability check. It complements, rather than replaces, the rest of your review stack.
Here's the practical distinction:
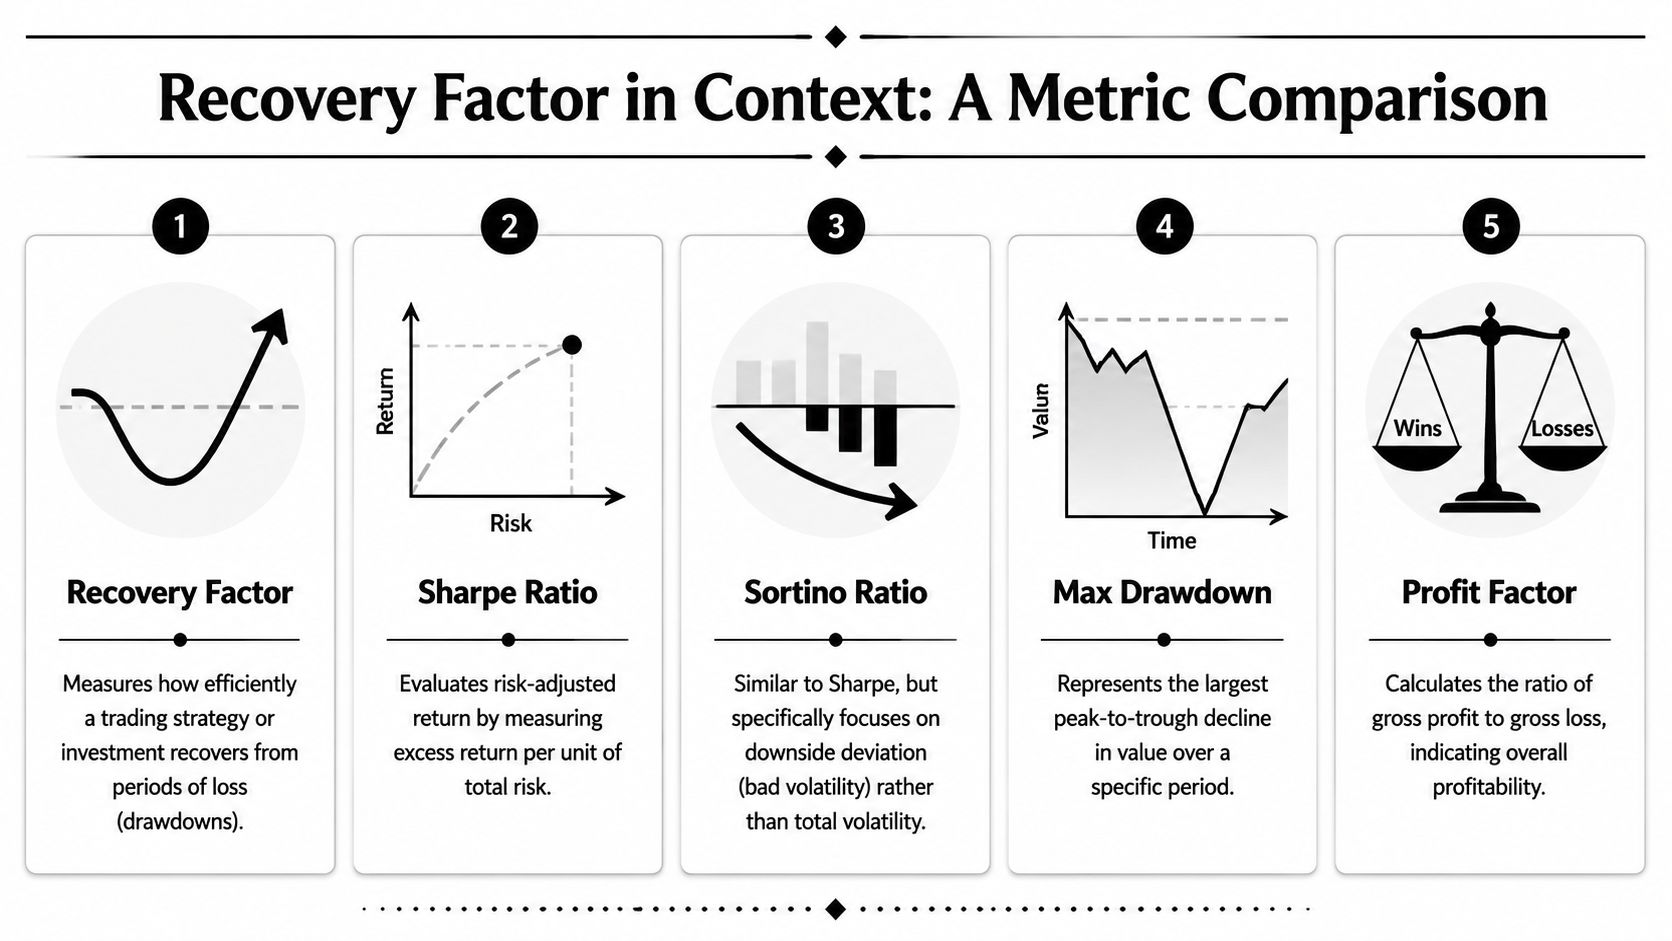
| Metric | What it helps you judge | Best use |
|---|---|---|
| Recovery Factor | Profit earned relative to worst drawdown | Screening for resilience after losses |
| Sharpe Ratio | Return relative to overall volatility | Comparing smoothness across strategies |
| Sortino Ratio | Return relative to downside volatility | Focusing on harmful volatility only |
| Max Drawdown | Worst historical decline | Stress-testing psychological and capital risk |
| Profit Factor | Gross profit versus gross loss | Evaluating trade-level payoff quality |
If I'm evaluating a wallet for followability, I don't want just one reassuring number.
I want a combination like this:
That combination gives a more complete view of how the wallet behaves.
A wallet worth tracking usually looks decent from more than one angle. If one metric is amazing and the rest look messy, inspect harder.
On-chain trading introduces behavior that single metrics miss. A wallet may have a respectable recovery factor while still showing unstable variance, poor downside control, or concentration risk in one sector. Another wallet may have lower headline profit but cleaner behavior across several measures, making it far more usable for copy trading.
That's why performance attribution matters. You're not just asking whether a wallet made money. You're asking where the returns came from, how fragile they were, and whether the process can survive the next regime shift. For a broader lens on that, Wallet Finder's guide to performance attribution in trading is worth reading.
Recovery factor should sit near the top of your filter stack, not at the end of your thinking.
If you want to turn this from theory into workflow, Wallet Finder.ai helps you inspect on-chain wallets, review trading history, and spot resilient traders worth monitoring before you decide to mirror them.

A premier DeFi analytics platform empowering traders to discover and analyze profitable blockchain wallets, trades and tokens.

