Sharpe Ratio Calculator: Master Portfolio Performance
Master the Sharpe Ratio Calculator. Learn its formula, calculate in Excel/Python, interpret crypto results, and find top wallets with Wallet Finder.ai for 2026.

May 31, 2026
Wallet Finder

May 31, 2026

You've probably done this already. You spot two wallets with the same headline return, both look elite at first glance, and the temptation is to mirror the one with the louder PnL screenshot.
That's usually where mistakes start.
Raw return hides the path. In crypto, the path matters as much as the endpoint because the path tells you whether the trader survived through controlled risk, got lucky on one burst move, or sat through a drawdown you'd never tolerate in your own capital. A Sharpe ratio calculator helps with that, but only if you use it with the right inputs and read the output with some skepticism.
Most guides stop at the formula. That's not enough for DeFi traders. The practical questions are harder: which return series should you feed the calculator, what do you use as the risk-free rate in crypto, and when is Sharpe the wrong metric entirely? Those are the questions that decide whether the number is useful or cosmetic.
Two wallets can finish in the same place and still be completely different bets.
One compounds through relatively smooth swings, cuts losers early, and rarely needs a miracle rebound. The other survives an ugly collapse, then catches one explosive recovery trade that drags the account back into the green. If you only rank them by return, they look equal. If you care about repeatability, they're not close.
That's why professionals don't stop at PnL. They ask how much uncertainty, instability, and pain came with that return. Risk-adjusted analysis doesn't eliminate judgment, but it filters out a lot of false positives.
Raw performance tells you the destination. It doesn't tell you:
A good benchmarking habit is to compare return and risk together, not in isolation. This is the practical logic behind benchmarking portfolio performance.
Practical rule: If two strategies show similar returns, prefer the one that got there with less turbulence unless you have a very clear reason not to.
The Sharpe ratio tries to answer a simple question: how much excess return did the strategy generate for the volatility it took?
That's why it became a standard first pass. It compresses return and variability into one number. For screening wallets, funds, or systems, that's useful. It lets you move beyond “who made the most” to “who got paid best for the risk they accepted.”
Still, in crypto, Sharpe is best treated as a starting filter, not a final verdict. It helps you reject noisy performers. It doesn't tell you everything about tail risk, liquidity stress, or non-linear payoff structures.
A wallet can post the same total return as another and still be far less attractive once you examine the path of returns. Sharpe is the shortcut traders use to separate return quality from return size.
Sharpe Ratio = (Portfolio Return - Risk-Free Rate) / Standard Deviation of Return
Read it in plain English. The numerator is excess return, what the strategy earned above a baseline cash alternative. The denominator is the volatility of the return series you chose. Higher excess return helps. Higher volatility hurts.
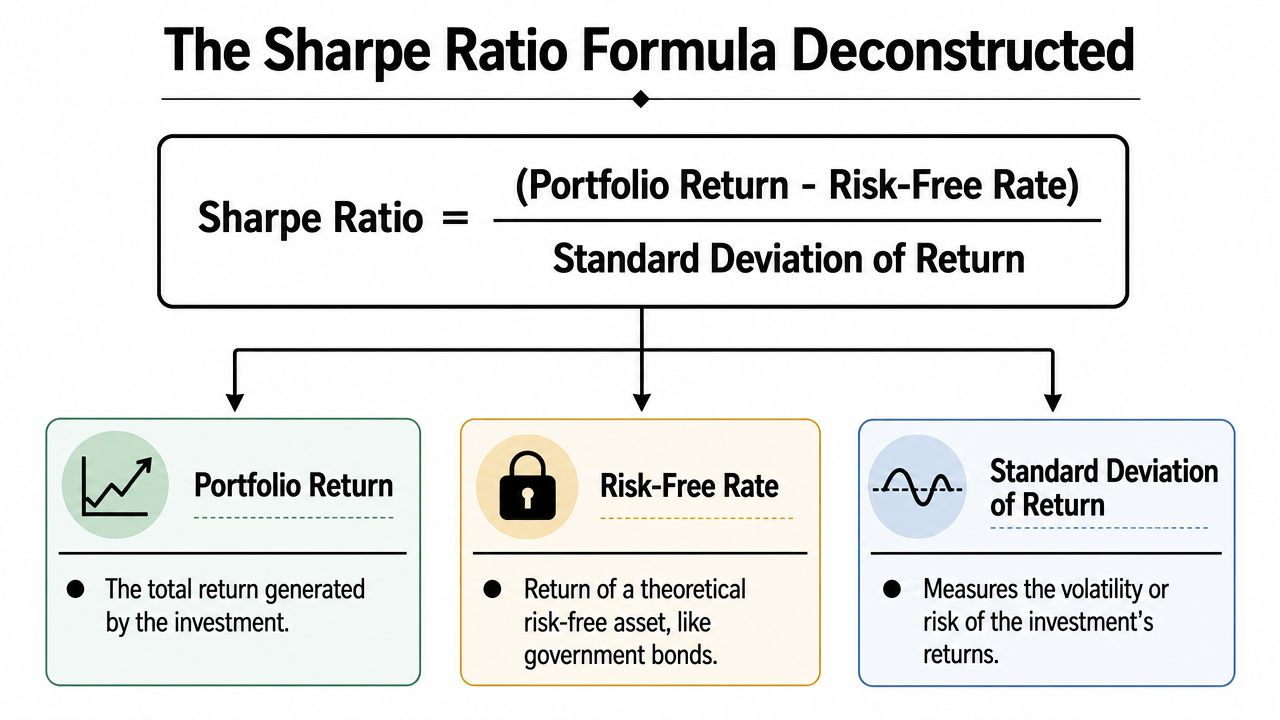
For on-chain analysis, "portfolio return" sounds simpler than it is. The result depends on how you build the series.
You can calculate returns from daily wallet equity, weekly net asset value, or realized PnL by trade batch. Those choices are not interchangeable. A market-making wallet with frequent inventory swings can look stable on monthly snapshots and erratic on daily marks. A directional wallet can look cleaner on realized PnL than on mark-to-market equity because unrealized drawdowns disappear until they are closed.
Use one return construction method across every wallet in the sample. If the inputs are inconsistent, the Sharpe comparison is weak before the math even starts. This is the same discipline used in a sound backtesting framework for strategy evaluation.
The risk-free rate is the messiest part of Sharpe in crypto.
In traditional markets, analysts usually plug in a short-term Treasury yield. In DeFi, there is no universally accepted equivalent. Stablecoin lending yields move, platform risk is real, and "cash" itself can carry smart contract, custody, or depeg risk.
Three practical approaches are common:
The last point matters most. A slightly imperfect baseline used consistently is more useful than a theoretically cleaner rate that changes from wallet to wallet.
Standard deviation measures how dispersed returns are around their average. In Sharpe, all volatility counts the same. Upside jumps and downside crashes both increase the denominator.
That is acceptable for a first screen, but crypto returns often break the assumptions that make Sharpe look tidy in textbooks. Return distributions for DeFi wallets are commonly skewed, fat-tailed, and regime-dependent. One airdrop, one liquidation cascade, or one low-liquidity exit can dominate the sample. Standard deviation captures instability, but it does not describe tail shape well.
That is why a wallet with spectacular gains can still earn a weak Sharpe, and why a decent Sharpe can still hide ugly left-tail risk.
This is the part many traders miss. Sharpe is not only about the formula. It is also about the interval of the returns fed into it.
Daily, weekly, and monthly returns can produce materially different Sharpe ratios for the same wallet. In crypto, daily data often captures more noise, slippage effects, and temporary mark-to-market swings. Monthly data smooths that noise, but it can also hide intramonth drawdowns and make a fragile strategy look cleaner than it really was.
I usually check at least two frequencies before trusting the number. If a wallet looks excellent on monthly returns and mediocre on daily returns, that gap is information. It often points to path dependence, stale marks, or a strategy that only looks comfortable when you blur the tape.
A strong Sharpe means returns were efficient relative to the volatility measured in that sample. It does not mean the wallet is safe, liquid, or resilient under stress.
A wallet can look outstanding on a PnL chart and still score poorly once returns are standardized. The calculation is simple. The setup is where traders usually make mistakes.

Start with an equity curve or periodic portfolio values. Then make one decision before touching Excel or Python: what interval will define returns? Daily, weekly, and monthly inputs can all be annualized, but they do not describe the same behavior. For on-chain strategies, daily returns usually capture execution noise, funding swings, oracle moves, and liquidity gaps. Monthly returns smooth that noise, but they can also make a fragile path look cleaner than it was.
I treat frequency choice as part of the model, not clerical work.
If you exported wallet values into Excel, a basic sheet is enough for a first pass.
Assume column A has dates and column B has wallet value. In column C, calculate the return from one row to the next:
=(B3/B2)-1
Copy that formula down the series. Once the returns column is clean, calculate three inputs over the same range:
=AVERAGE(C2:C1000)=STDEV.P(C2:C1000)(Average Return - Risk Free Rate Per Period) / Standard DeviationFor many crypto screening tasks, traders set the risk-free rate to zero because the spread versus short-term cash yields is not the main driver of the result. That shortcut is fine if you apply it consistently across every wallet you compare.
Use the square root of the number of periods per year that matches your sampling interval.
For daily data:
=Daily Sharpe * SQRT(252)
For weekly data:
=Weekly Sharpe * SQRT(52)
For monthly data:
=Monthly Sharpe * SQRT(12)
The arithmetic is standard. The interpretation is not. A daily Sharpe and a monthly Sharpe can both be annualized correctly and still lead to very different conclusions because the underlying return path was sampled differently.
Common failure: comparing one wallet on daily returns and another on monthly returns, then treating both annualized Sharpe values as equally informative.
If you want the same rules applied across many wallets, use a backtesting framework for wallet strategy evaluation instead of rebuilding the process sheet by sheet.
Pandas handles the same workflow cleanly.
import pandas as pdimport numpy as npdf = pd.read_csv("wallet_equity.csv")df["return"] = df["equity"].pct_change()returns = df["return"].dropna()risk_free_daily = 0.0mean_return = returns.mean()std_return = returns.std(ddof=0)daily_sharpe = (mean_return - risk_free_daily) / std_returnannualized_sharpe = daily_sharpe * np.sqrt(252)print("Daily Sharpe:", daily_sharpe)print("Annualized Sharpe:", annualized_sharpe)That gets the baseline number. To test weekly or monthly Sharpe, resample the equity curve first, then recompute returns from the resampled series. Do not rescale daily returns into monthly returns by hand and assume you preserved the same risk profile. In crypto, path dependency matters too much for that shortcut.
A practical extension is to run the same wallet through several frequencies and inspect the spread. If daily Sharpe is mediocre, weekly improves, and monthly looks excellent, the wallet may be relying on smoothed marks, sparse trading, or return bursts that disappear when measured closely.
For Wallet Finder.ai style wallet analysis, the process is straightforward:
That sequence catches a lot of false positives. Wallets driven by one large airdrop or one violent mark-up often rank well on raw return and poorly on repeatable risk-adjusted performance.
A quick walkthrough can help if you want to see the mechanics in motion.
Once you've got the number, the next risk is over-trusting it.
Many market participants use rough thresholds where above 1 is generally considered good and above 2 is considered excellent. Those labels are useful as broad orientation, but in crypto they can become misleading fast because the distribution of returns often isn't remotely normal.

A higher Sharpe usually suggests one of three things:
For diversified, liquid, reasonably continuous strategies, that interpretation often holds up well.
In DeFi, though, a handsome Sharpe can also come from a return stream that looks smooth right up until it doesn't. Think about wallets that collect many small gains, avoid marking risk realistically, or hold concentrated exposures that haven't blown up yet.
Existing educational content rarely spends enough time on Sharpe's blind spots. One finance education page notes that the metric's known limitations include the fact that it penalizes upside and downside volatility equally and can mis-rank strategies with frequent small gains and rare large losses or those with positive skew at Golden Door Asset's Sharpe ratio explainer. That matters even more for on-chain strategies because many return distributions are less stable than traditional portfolios.
That one point has big consequences.
If a wallet catches explosive positive moves, Sharpe counts that variability the same way it counts ugly downside swings. For momentum-heavy traders or breakouts in altcoins, that can understate what you actually care about.
A wallet that prints many small wins and carries rare crash risk can post an attractive Sharpe for long stretches. Until the tail event arrives, the standard deviation may not fully express the danger.
On-chain strategies often involve jumps, gaps, concentrated positions, and thin liquidity. Sharpe assumes a world that behaves more smoothly than that. The calculator can be numerically correct while still being strategically misleading.
A wallet with a strong Sharpe can still be one bad unwind away from deleting months of “efficient” performance.
Use Sharpe as one input in a broader judgment call.
| Situation | Sharpe interpretation |
|---|---|
| Smooth liquid strategy | More reliable as a comparison tool |
| Concentrated wallet | Useful, but incomplete |
| Options-like payoff or skewed strategy | Often understates structural risk |
| Illiquid token exposure | Sensitive to pricing noise and sampling choice |
When you see a Sharpe ratio on a wallet, ask:
Judgment test: If a metric flatters a strategy you already wanted to believe in, spend extra time attacking the assumption behind the metric.
Sharpe is useful, but it shouldn't be the only number on your screen. Crypto strategies often need a second and third lens.
The alternatives below don't replace judgment either. They just ask better questions for certain payoff profiles.
The Sortino ratio resembles Sharpe, but instead of using total volatility, it focuses on downside volatility. That makes it more aligned with how traders experience pain.
If a wallet's returns are volatile because it catches upside bursts, Sortino won't punish that as harshly. That makes it especially helpful for momentum, breakout, and positively skewed strategies.
The Calmar ratio compares return to maximum drawdown. For crypto traders, this is often more intuitive than variance-based metrics because drawdown is what blows up confidence, capital, and follower retention.
A strategy can have respectable Sharpe and still suffer a drawdown that most allocators can't stomach. Calmar forces that issue into view.
The Information ratio compares active return relative to a benchmark, typically against the variability of that active return. In crypto, this matters when you're trying to figure out whether a wallet is skillful or merely long beta.
If a trader “outperformed” during an alt rally, the core question is whether they beat a benchmark like ETH, SOL, or a sector basket on a risk-adjusted basis.
| Metric | What It Measures | Best For Evaluating | Key Weakness |
|---|---|---|---|
| Sharpe Ratio | Excess return relative to total volatility | General first-pass comparison across similar strategies | Treats upside and downside volatility the same |
| Sortino Ratio | Excess return relative to downside volatility | Skewed or momentum-heavy crypto strategies | Can still miss liquidity and tail-event structure |
| Calmar Ratio | Return relative to maximum drawdown | Survival risk and capital pain tolerance | Depends heavily on the sample path and lookback |
| Information Ratio | Return relative to benchmark-adjusted active risk | Whether a wallet is adding skill beyond market beta | Needs a sensible benchmark choice |
Use a metric stack, not a metric religion.
A thorough wallet review often looks like this: Sharpe for efficiency, Sortino for harmful volatility, drawdown for survivability, benchmark-relative analysis for actual skill.
That combination is usually more honest than a single headline ratio.
This gets useful when you turn it into a repeatable workflow.
Start with a shortlist of wallets that look interesting on recent performance and trading behavior. Don't rank them by returns alone. Export the history you need, build a consistent return series, and calculate the same metrics across the whole set.

Group wallets that trade in a similar style. A swing trader in majors and a hyperactive meme wallet shouldn't be compared as if they're running the same game.
Build one return series method and stick to it. Daily wallet equity changes are a sensible default for many active on-chain traders. If a wallet trades less frequently, weekly may be cleaner.
At minimum, run:
One wallet may have the better Sharpe. Another may have a cleaner downside profile and shallower drawdowns. Depending on your tolerance, the second wallet may be the superior one to follow.
The best wallet to mirror usually isn't the one with the flashiest return. It's the one whose risk profile you can actually live with during a bad stretch.
What works
What doesn't
If you're monitoring wallets regularly, a dedicated wallet tracker app for on-chain traders makes the screening and export process much easier.
Wallet research gets better when you stop chasing the loudest return and start measuring the quality of that return. Wallet Finder.ai helps traders discover wallets, inspect trading histories, export data for offline analysis, and track smart money activity across major chains so you can evaluate strategies with more rigor before you mirror them.