
Recovery Factor Calculation for Smart Traders
Master the recovery factor calculation to measure a strategy's resilience. Learn the formula, see DeFi examples, and find top wallets with Wallet Finder.ai.

June 20, 2026


Wallet Finder
June 3, 2026
Typing "xbt price usd" into a search bar usually leads to bad advice. Most pages assume XBT always means Bitcoin, or they treat every XBT quote as if it refers to the same instrument.
That assumption gets traders into trouble.
There are two very different things hiding behind the same three letters. One is XBT as Bitcoin’s institutional ticker, used on venues such as CME and Kraken. The other is a separate micro-cap altcoin called XBT that has traded at fractions of a cent and shown extreme instability. If you don't separate those two immediately, your pricing model, your risk model, and your execution plan are already wrong.
The practical edge is simple. Institutional desks care about XBT because that label shows up in derivatives, benchmarks, and professional market structure. Speculative on-chain traders care about the altcoin XBT because its price can move violently on thin liquidity and whale activity. Those are different games with different data sources, different liquidity assumptions, and different failure modes.
Most retail content blurs the distinction. A professional process can't. When I evaluate xbt price usd, I first ask one question: Are we talking about Bitcoin market structure, or a micro-cap token? That single filter prevents category errors that ruin otherwise solid analysis.
The most popular advice around xbt price usd is to “just check the chart.” That works only if you already know which XBT you're looking at.
In practice, many traders don't.
A quote labeled XBT/USD can refer to Bitcoin under its ISO-style ticker, or it can refer to an unrelated low-cap altcoin. Those are not interchangeable symbols. One sits inside institutional price discovery and derivative hedging. The other behaves like a thinly traded speculative token where sentiment and wallet concentration can dominate price.
That distinction matters because your next action depends on it. If you think XBT means Bitcoin, you'll look at futures basis, exchange liquidity, and cross-venue execution. If you're looking at the altcoin, you should care more about holder concentration, wallet behavior, and whether liquidity can absorb your order at all.
Practical rule: Never trade a symbol before identifying the venue, the contract type, and the underlying asset.
The confusion gets worse because both interpretations can appear in the same search results. One result may discuss institutional Bitcoin pricing conventions. Another may show a micro-cap chart with sharp swings and speculative forecasts. Traders who don't notice the difference often compare prices that should never be compared.
Here's the useful framing:
That’s where the edge starts. The traders who separate naming from market structure make better reads on flow, better decisions on venue selection, and fewer category mistakes when volatility spikes.
The reason XBT exists as a label for Bitcoin has nothing to do with rebranding or marketing. It comes from a structural problem inside the ISO 4217 standard — the same international framework that gives us USD for the US dollar, EUR for the euro, and XAU for gold.
Under ISO 4217, currencies tied to a specific country start with that country's two-letter code. The British pound is GBP. The Japanese yen is JPY. Assets that are supra-national — meaning they belong to no single country — get a ticker that starts with X instead. Bitcoin fits that definition precisely. It has no issuing government, no central bank, and no national jurisdiction. So under the ISO framework, BTC was a non-starter. The B prefix is reserved for national currencies. The community had already claimed BTC organically, but BTC doesn't fit the standard. XBT does.
The reason the switch didn't happen cleanly is the same reason most standards battles drag on forever — incumbency. Bitcoin's community adopted BTC long before ISO compliance was a concern, and that abbreviation became embedded across thousands of exchanges, wallets, APIs, news sites, and trading interfaces. Switching a deeply embedded ticker requires coordinated effort across a decentralized system with no central authority to mandate anything. The result is a permanent split: BTC for the retail and community world, XBT for institutional systems, derivatives venues, financial reporting tools, and regulated environments where ISO compliance is a hard requirement.
When someone types that into a search bar, they are almost certainly not thinking about ISO currency codes. They are trying to price an asset. The problem is that the search returns at least two completely different answers — sometimes on the same page. One set of results treats XBT as Bitcoin's institutional ticker and gives you data from CME, Kraken futures, or benchmark composites. Another set shows the altcoin XBIT, which trades on PumpSwap and KCEX at fractions of a cent and has a market cap measured in hundreds of thousands of dollars. Bitcoin Magazine and Paybis both note that Kraken runs a deliberate hybrid model: BTC for spot retail trading, XBT for futures, OTC desks, and API endpoints serving institutional clients. That split is deliberate and useful for Kraken's two very different user bases. For traders unfamiliar with it, the same split produces consistent confusion.
The single most valuable thing you can do before reading any xbt price usd quote is verify which asset and which venue the quote is coming from. Everything downstream of that check — fair value, position sizing, liquidity assumptions, risk controls — changes depending on the answer.
Think of BTC and XBT as a common name and a formal name for Bitcoin. Retail exchanges commonly use BTC. Institutional and standardized contexts often use XBT.
According to PrimeXBT’s explanation of the XBT ticker, XBT serves as the ISO 4217 standardized ticker symbol for Bitcoin, and major venues including CME and Kraken use it. That matters because some of the most important institutional flows are quoted, hedged, and discussed through XBT conventions rather than BTC conventions.
The problem is that XBT is also the name of a separate altcoin on crypto data sites. Same letters, different asset.
Search behavior causes the mix-up. A trader sees “XBT,” assumes Bitcoin, then lands on an altcoin page. Or they see “XBT/USD” on a professional venue and assume it's some niche token when it refers to Bitcoin.
That confusion isn't harmless. It changes:
For a good primer on how naming and quote conventions affect interpretation, this guide to crypto trading pairs is worth reviewing.
AttributeXBT (Bitcoin's ISO Code)XBT (Altcoin)What it refers toBitcoin under a standardized tickerA separate micro-cap crypto assetPrimary contextInstitutional trading, derivatives, standardized market referencesSpeculative altcoin tradingTypical venuesCME, Kraken, other venues using XBT notationCrypto exchanges tracking the tokenCore driverBitcoin market structure, macro flow, derivatives positioningSentiment, liquidity, wallet concentrationRisk profileDeep global asset, but still volatileMuch higher trading risk due to thinner liquidityMain analytical lensSpot, futures, basis, benchmark pricingHolder behavior, order book fragility, on-chain flow
Before reading any xbt price usd quote, verify three things:
If your market data workflow doesn't force an asset identity check before price interpretation, it will eventually feed you a false signal.
That’s the core distinction. Once that’s clear, the rest of the analysis becomes much cleaner.
Institutional XBT/USD is not a single number. It is a pricing stack.
A desk can be looking at spot on Kraken, CME Bitcoin futures quoted under XBT, or a benchmark built from several liquid venues. All three are valid references for Bitcoin, but they answer different trading questions. If you treat them as interchangeable, execution quality drops fast.
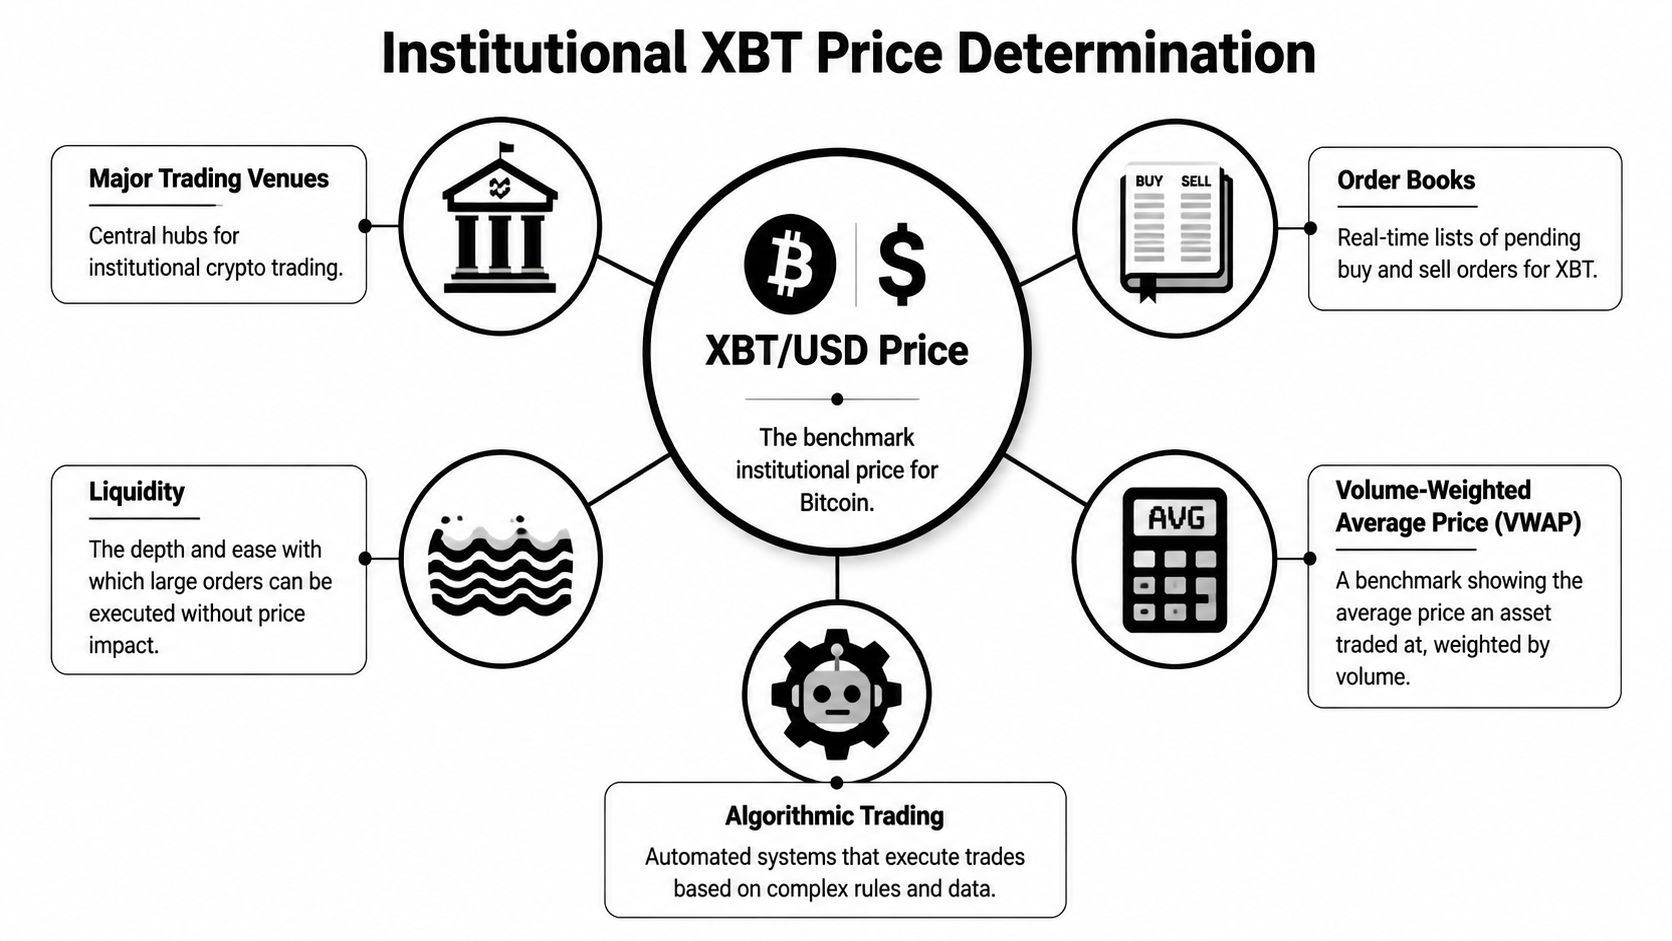
On a spot book, XBT/USD reflects the local balance of bids, offers, and available depth. The printed last trade is only the most recent match. It does not tell you how much size can clear near that level, or whether the move came from informed flow or thin liquidity.
That distinction matters more in Bitcoin than many traders realize. A retail chart can show a clean price. An institutional trader cares more about executable price, book resiliency, and whether the move is confirmed across major venues. In practice, desks compare several books and rely on composite pricing to reduce the impact of one exchange slipping out of line.
As noted earlier, some market references aggregate multiple exchanges with volume weighting. That gives a better read on where real Bitcoin risk is changing hands under the XBT label than any isolated print.
The last tick is easy to display and easy to misuse.
Serious traders care about where size traded. That is why VWAP and related benchmark logic matter. A price formed by meaningful volume is harder to distort than a price formed by a small trade at the edge of the book. The same principle applies when reading cross-venue demand. A venue trading rich to peers can signal stronger buyer urgency, better fiat access, or localized inventory constraints.
That is also why tools that compare venue relationships are useful. Traders reading the Coinbase Premium Index as a cross-venue demand signal are asking a better question than "what is Bitcoin's price right now?" They are asking where higher-quality flow is entering and whether that flow is strong enough to pull the broader market.
For many professional participants, the most important XBT price in USD is not spot at all. It is the futures curve.
CME futures embed time to expiry, funding alternatives, collateral preferences, balance sheet costs, and hedging pressure. That means the futures price can trade above spot in a carry-friendly setup or below spot when the market wants immediate coins or is de-risking aggressively. Neither condition is unusual. Both carry information.
This is the part many discretionary traders miss. Spot tells you where Bitcoin changed hands. Futures tell you how the market is pricing exposure, financing, and risk transfer. If spot is flat but basis is expanding, the market is often saying more than the chart shows.
The XBT label also appears in regulated products, including CoinShares XBT Provider ETPs. Those vehicles can trade at a premium or discount to the value of the underlying Bitcoin exposure because wrappers add fees, market-making frictions, and local demand imbalances.
According to 3Commas’ discussion of XBT Provider products, these ETPs showed an average premium or discount in Q1 2026, which makes them useful as a sentiment and access signal, but not a clean substitute for spot or futures.
The practical read is simple. When you see xbt price usd, first identify the instrument. Then decide whether you are looking at execution, benchmark valuation, or demand for a specific wrapper. Traders who separate those layers read Bitcoin more accurately, and they make fewer bad decisions from mislabeled price data.
A trader who understands xbt price usd as a set of related prices instead of one fixed number sees opportunity faster.
Spot, futures, and regulated wrappers can all diverge. Sometimes the gap is noise. Sometimes it signals inventory stress, directional demand, or hedging pressure. The job is to tell the difference.
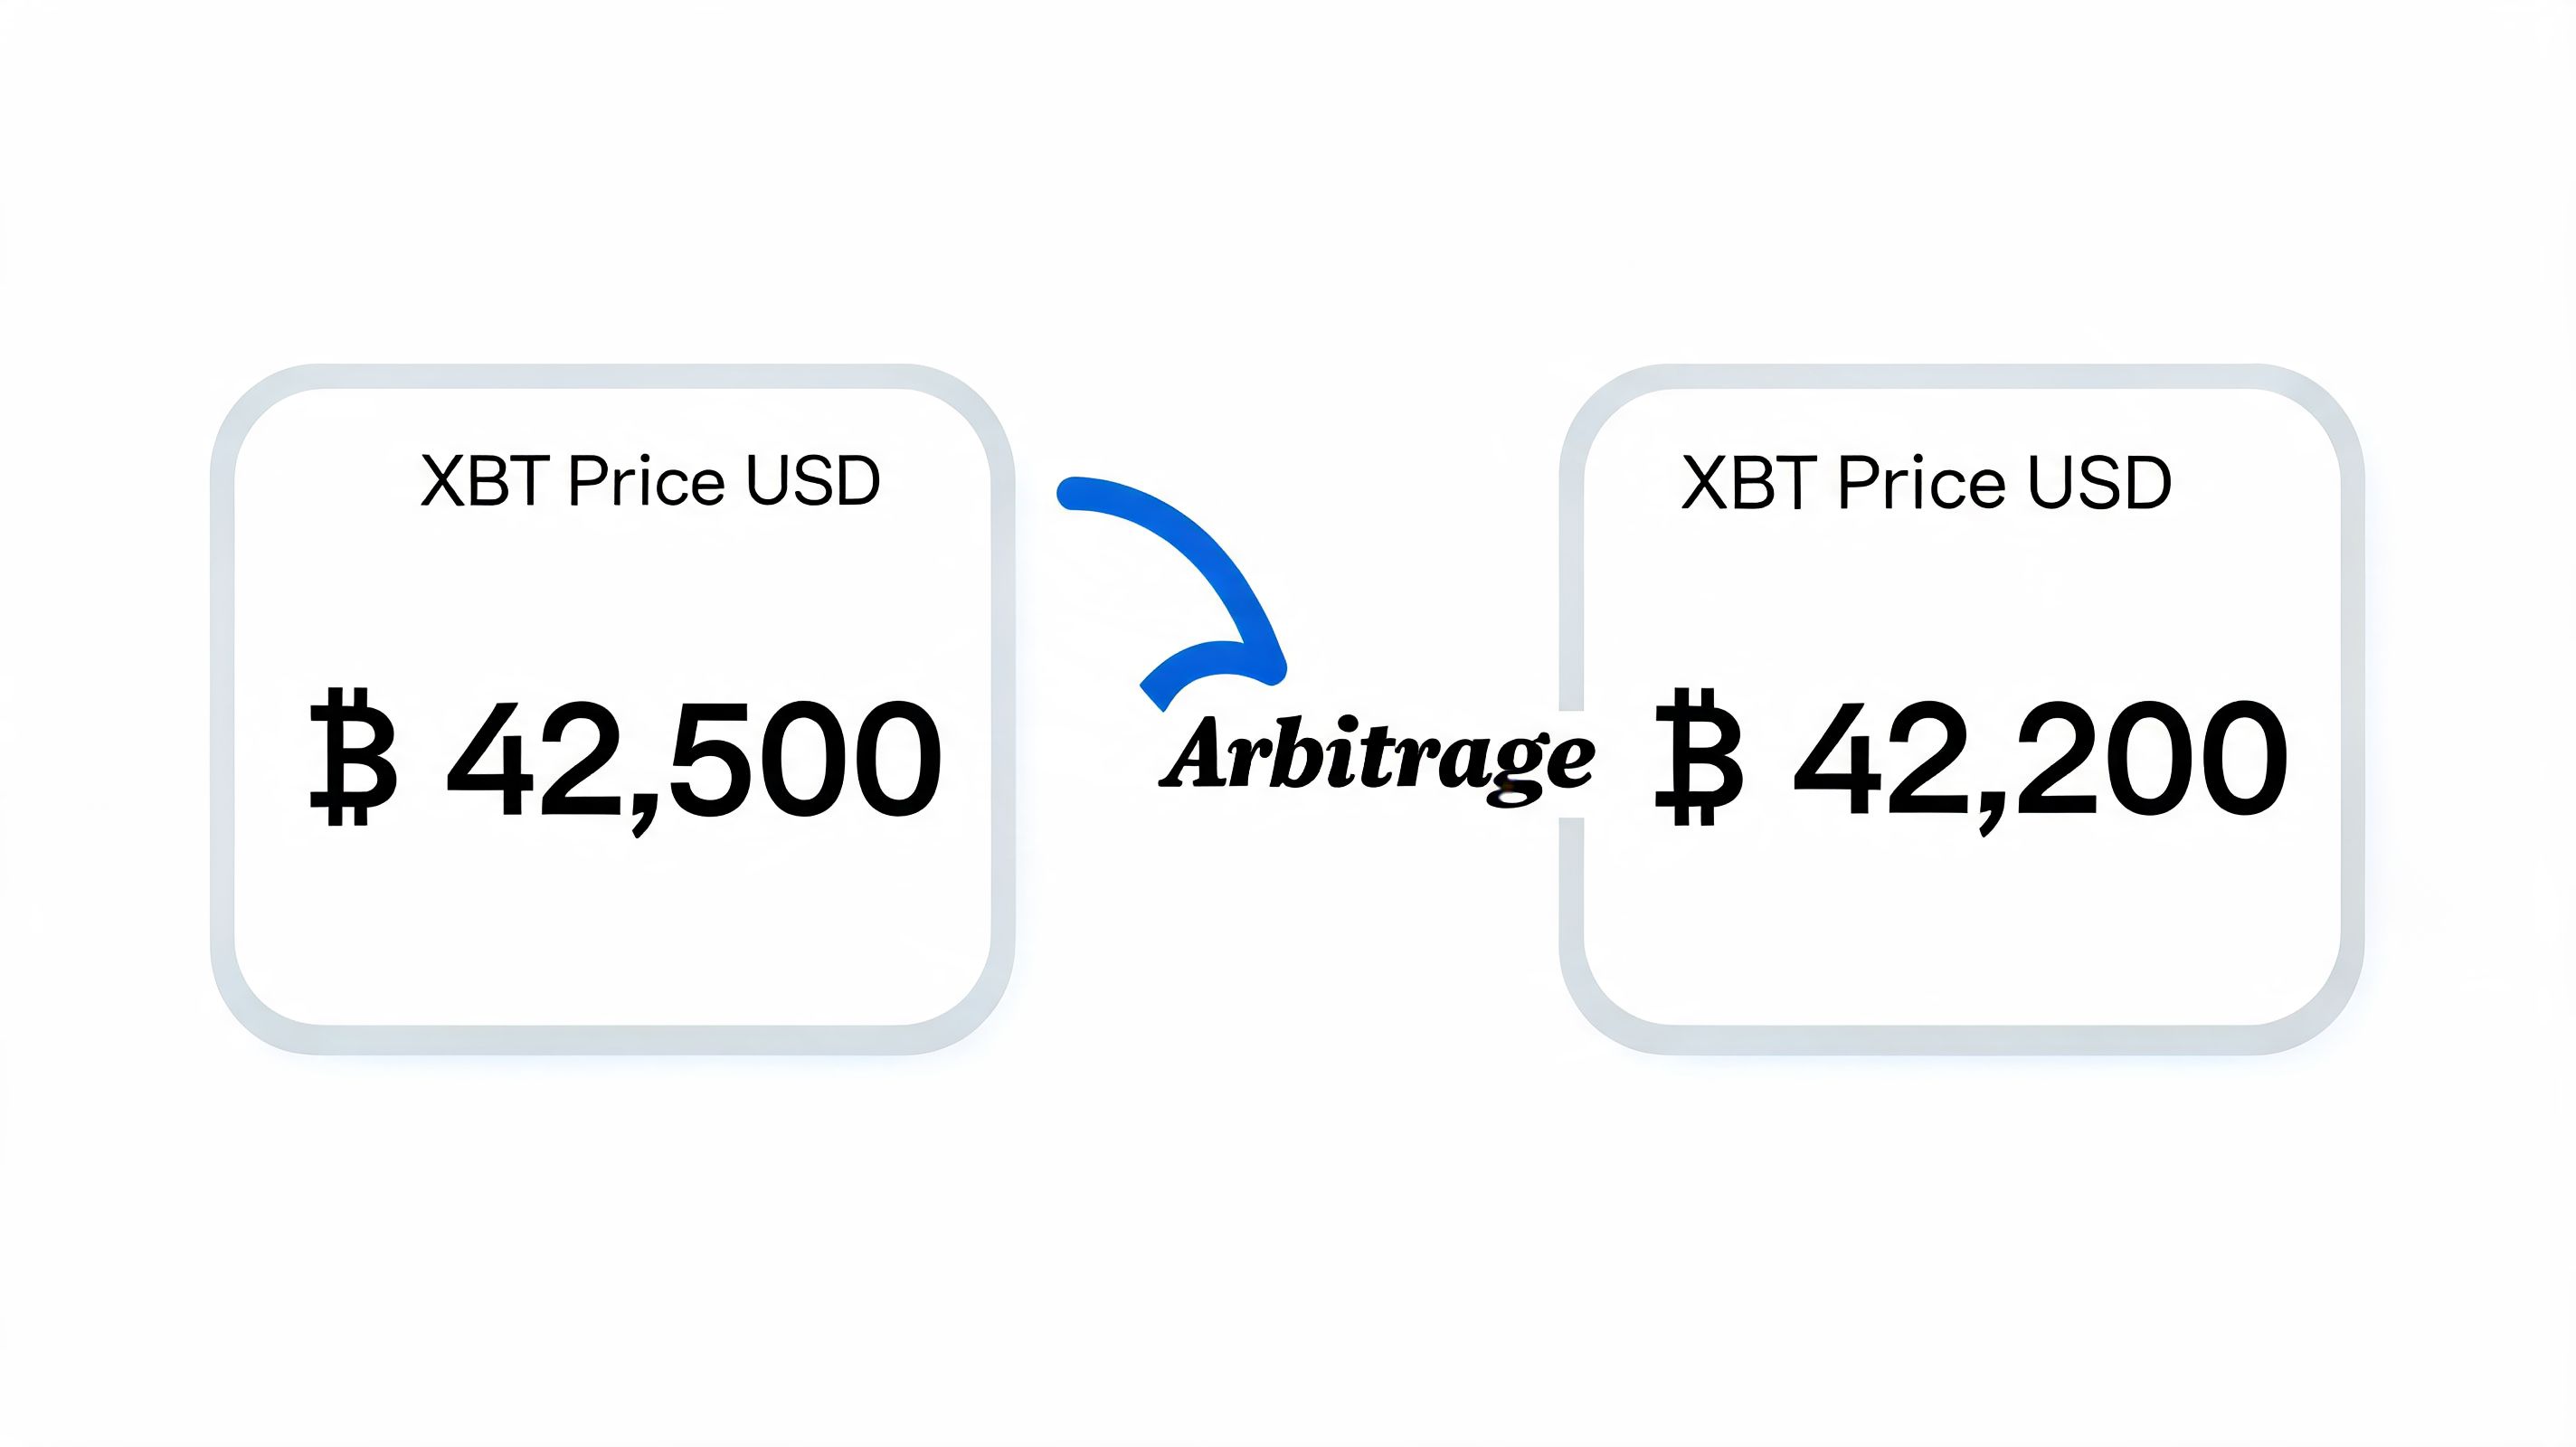
When futures trade above spot, traders call that contango. In plain English, the market is pricing future exposure at a premium. That can reflect demand for capital efficiency, balance-sheet costs, or bullish positioning.
When futures trade below spot, that's backwardation. That often shows up when traders pay up for immediate spot ownership, or when risk-off positioning pressures derivatives lower.
Neither condition is automatically tradable. What matters is whether the spread exceeds your costs, operational friction, and timing risk.
The cleanest edge usually isn't “free money.” It’s better interpretation.
A few practical uses:
For traders building scanners around spread behavior, a dedicated crypto arbitrage scanner framework is useful because it forces you to separate visible spread from executable spread.
Newer traders often overfocus on the spread and underfocus on the plumbing. That’s the mistake.
A discrepancy is only actionable if you can answer all of these:
Most failed arbitrage attempts aren't failures of math. They're failures of execution assumptions.
The professional edge comes from treating discrepancies as signals first, trades second. Read the basis. Read the wrapper. Read the venue. Then decide if there’s a trade.
The altcoin version of XBT belongs in a different mental bucket entirely. This is not institutional Bitcoin under another label. It is a micro-cap speculative asset with behavior that looks nothing like mature Bitcoin market structure.
The numbers make that clear. According to CoinGecko’s XBT market page, the token hit an all-time high of $0.03015 on May 17, 2025, then fell to an all-time low of $0.0006932 on June 21, 2025, a 96.7% decline in about a month. That is not normal benchmark behavior. That is micro-cap risk in plain sight.
A move like that usually points to a fragile market structure:
CoinGecko’s verified data also notes that the token later traded in a 24-hour range between $0.0008242 and $0.001028 in early May 2026, which implies it stabilized compared with the collapse phase, but still remained vulnerable to sharp intraday movement on a small nominal price base.
This type of market often reacts more to who is holding than to what the token represents. Thinly traded assets can gap hard when a few concentrated participants buy, stop buying, or exit.
That means classic large-cap habits don't transfer well. On Bitcoin, you can often think in terms of macro flow, derivatives positioning, and broad liquidity. On a micro-cap token, you need to think in terms of concentration risk, spread cost, and whether your own order becomes the event.
A micro-cap chart can look tradeable right up until your exit becomes the largest order in the book.
If you trade this kind of altcoin at all, keep the framework strict:
What works here is discipline. What doesn't work is importing Bitcoin assumptions into a market that can turn illiquid faster than your dashboard refreshes.
If you're trading the altcoin XBT, price alone won't save you. In a concentrated micro-cap market, the better question is who is moving inventory.
The verified data supports that view. According to MEXC’s XBT price prediction page, the top 10 holders control 65% of supply, and 3 wallets achieved 200%+ PnL on XBT. Whether you agree with the surrounding commentary or not, those two facts are enough to justify an on-chain-first workflow.
Use two separate watchlists.
One watchlist is for institutional Bitcoin signals under the XBT convention. That includes spot-futures relationships, venue behavior, and benchmark drift. The other watchlist is for altcoin XBT wallet behavior. Mixing them creates noisy conclusions.
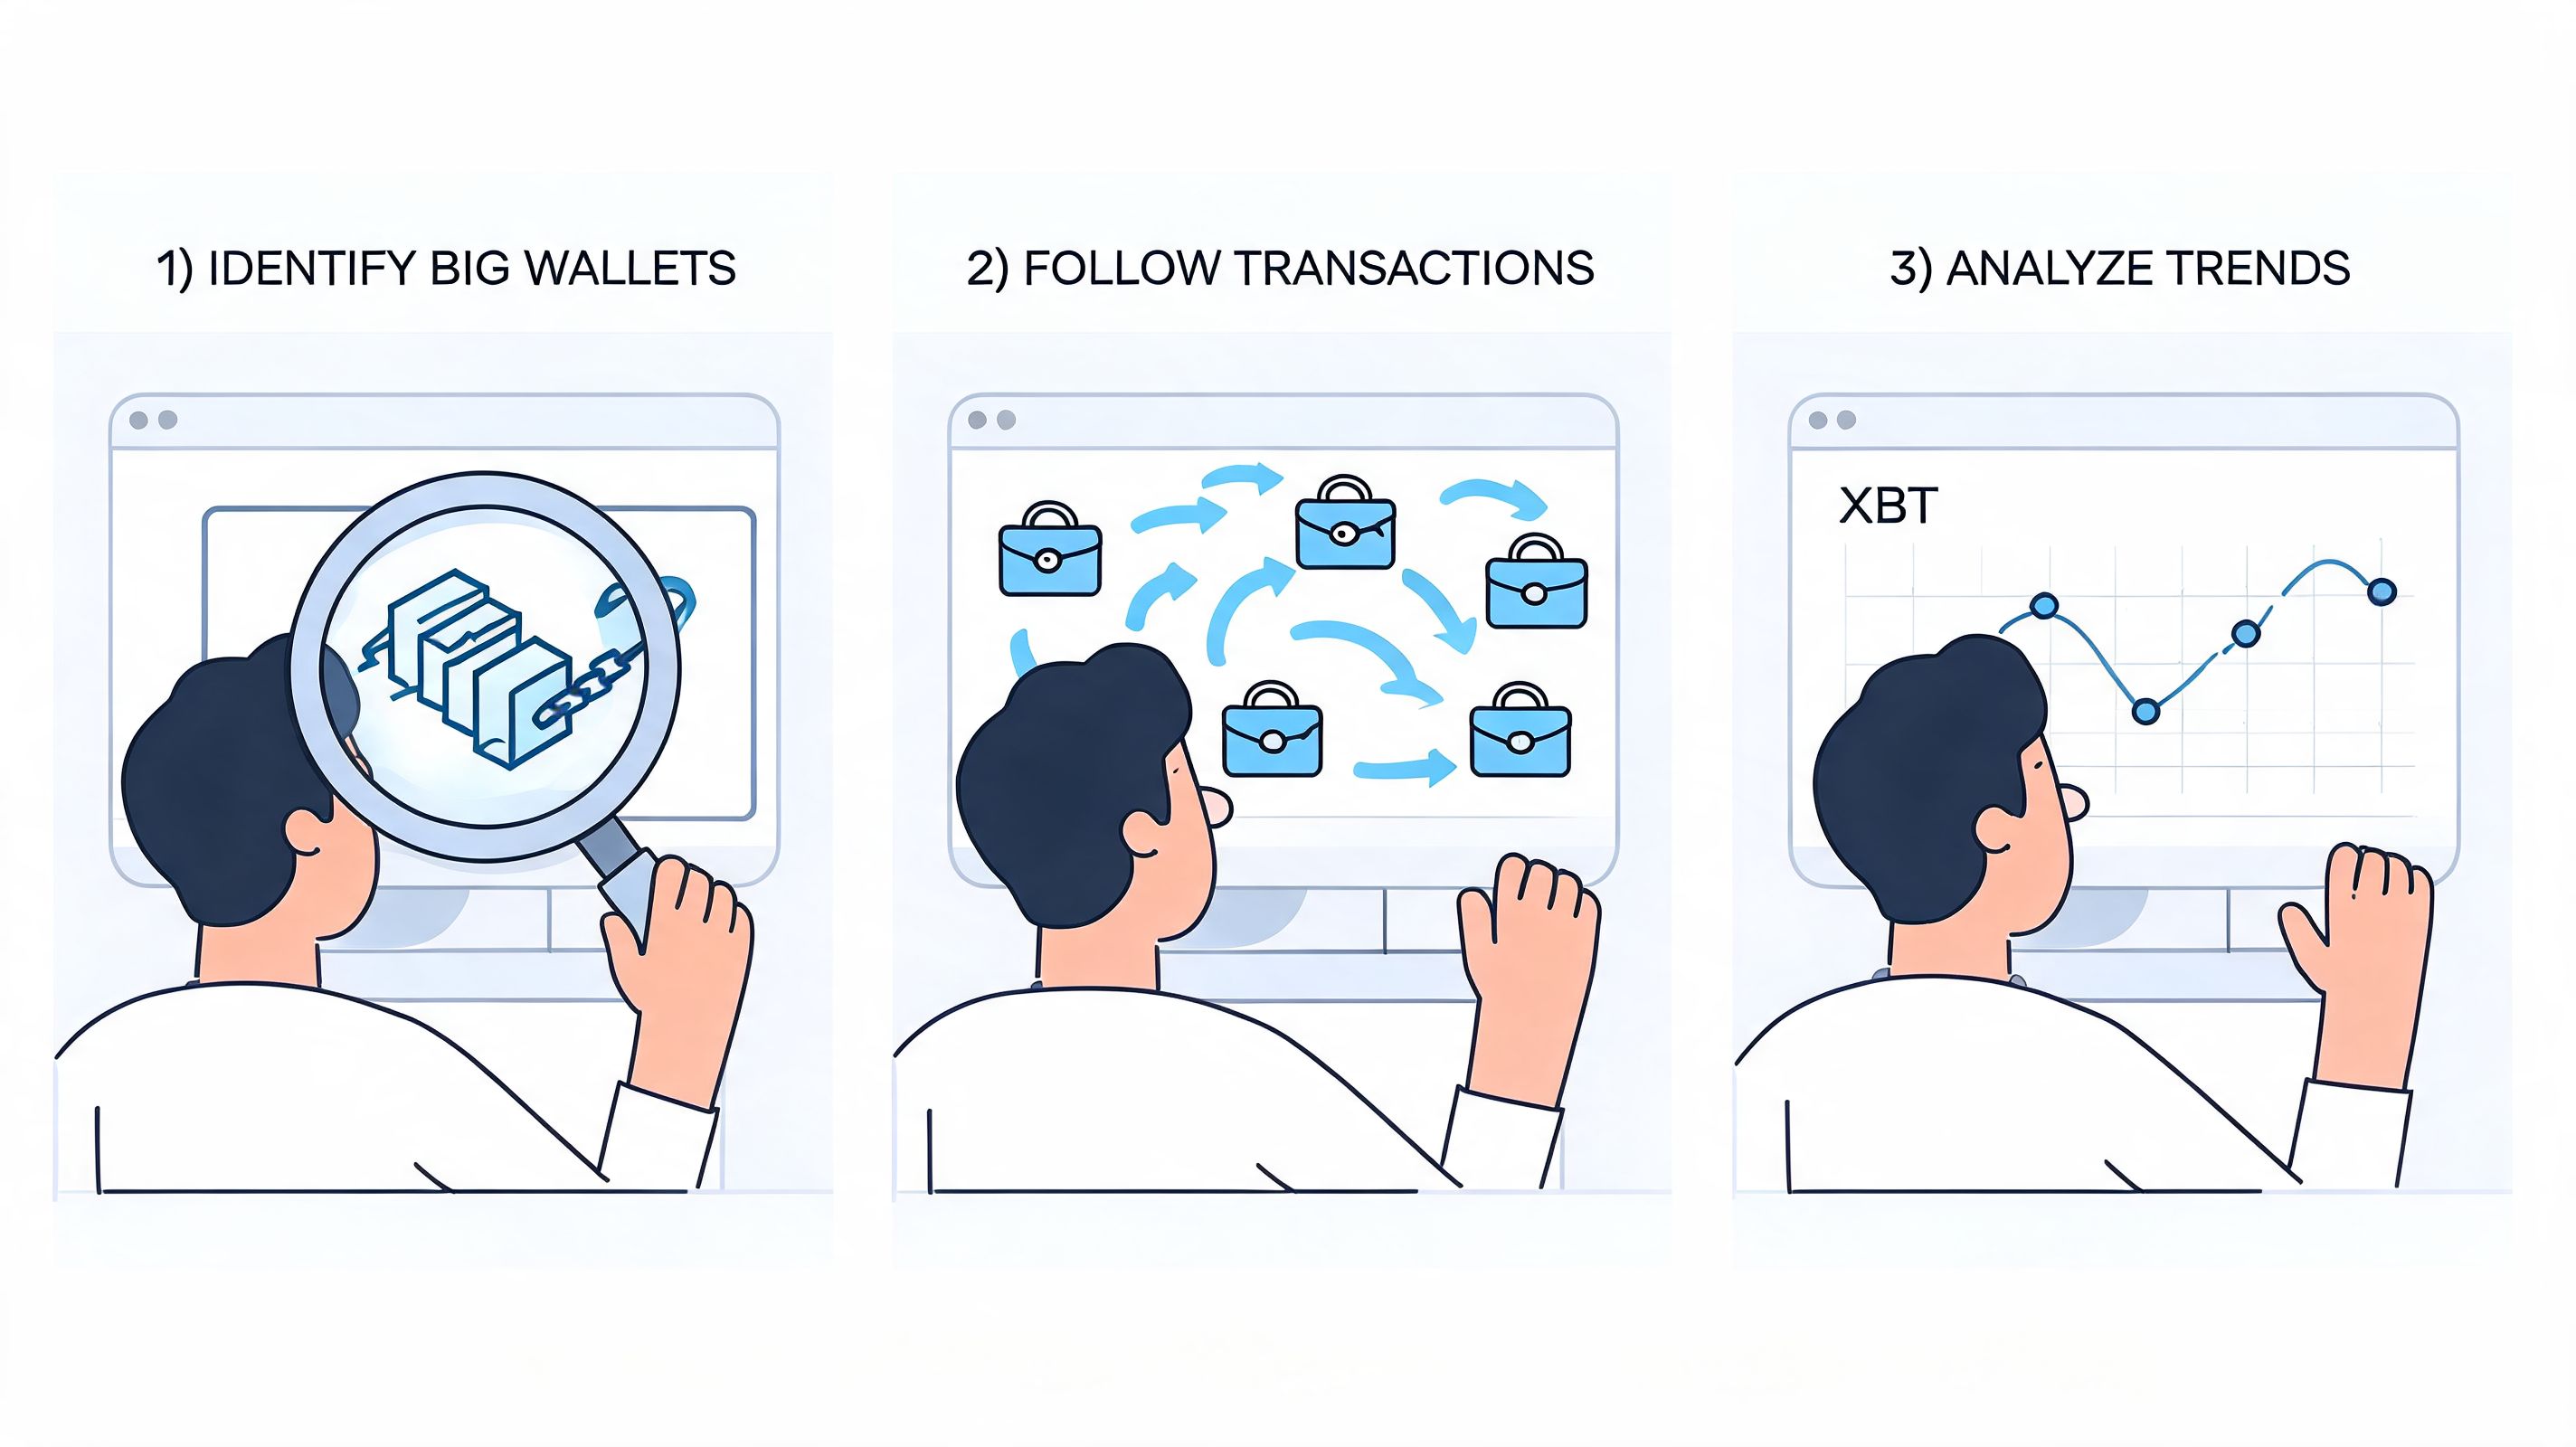
For the altcoin workflow, the sequence matters more than the indicator.
Not every large holder is smart money. Some are early insiders, passive holders, or wallets that can’t exit cleanly.
A useful shortlist includes wallets that show:
That distinction matters. In thin markets, an impressive unrealized gain can disappear before the wallet exits.
Here’s the operational mindset I prefer:
Track wallets that can both enter and leave well. Entry skill without exit discipline is just temporary screenshot PnL.
Once you've found a credible wallet cluster, convert that information into constraints:
After you’ve built the watchlist, it helps to review a live demonstration of wallet-tracking workflow and alert logic:
What works in markets like this is process. What fails is reacting to candles without knowing which wallets are driving them.
The most important XBT price USD reference for professional participants is usually not spot. It is the CME futures curve, and most retail content either ignores it entirely or describes it in a way that strips out the parts that actually matter for reading market conditions.
CME Bitcoin futures are quoted under the XBT label and cash-settled in USD against the CME CF Bitcoin Reference Rate, a composite benchmark derived from aggregated spot data across major venues. That benchmark structure is not incidental. It means the futures price is anchored to a time-specific aggregation of real market activity, not a single exchange's last print. For traders, this creates a more reliable valuation anchor than a single spot tick — but it also means the futures and spot prices can and regularly do diverge, and that divergence carries information.
When CME XBT futures trade above spot, the market is in contango. In practical terms this means participants are willing to pay more for future Bitcoin exposure than they would for immediate delivery. That premium reflects a combination of factors: financing costs, balance sheet preferences, demand for capital-efficient leverage, and general bullish positioning by institutions that access Bitcoin through regulated futures rather than direct ownership. A persistent and widening contango in the XBT futures curve is one of the cleaner signals that institutional demand for Bitcoin exposure is growing — not because the price is up, but because the cost of carrying that exposure into the future is increasing.
Backwardation is the reverse. When futures trade below spot, participants are either paying up for immediate coins, de-risking aggressively, or both. This structure showed up during sharp corrections and liquidation cascades in prior cycles, and it tends to precede or accompany periods of real volatility rather than just chart noise. Neither condition is automatically a trading signal on its own. Both become more meaningful in combination with volume, open interest trends, and cross-venue flow. A trader reading cross-venue demand signals like the Coinbase Premium Index alongside CME basis is asking a materially more precise question than someone watching spot alone.
CoinShares XBT Provider products — exchange-traded products listed in Europe under the XBT brand — add a third pricing layer that retail traders rarely account for. These instruments allow investors to hold Bitcoin exposure through a regulated wrapper, but they trade on stock exchanges with their own supply and demand dynamics. The price of the ETP can drift above or below the underlying Bitcoin value for extended periods because the creation and redemption mechanism is not frictionless, and because regional investor demand for a regulated wrapper can differ from the broader spot market's direction.
When XBT Provider ETPs trade at a premium to net asset value, it usually signals that demand for regulated Bitcoin access in that investor base is running ahead of the ETP's issuance pace. When they trade at a discount, the opposite condition applies. Neither is predictive on its own, but both are observable, and they round out the picture of how institutional demand is actually expressing itself under the XBT label — which is the question that matters when xbt price usd means something more than a chart on your phone.
The phrase xbt price usd looks simple, but it hides two completely different trading problems.
One is Bitcoin under the XBT ticker, where a key advantage comes from understanding venue structure, benchmarks, derivatives, and basis. The other is the altcoin XBT, where price can be driven by thin liquidity, concentrated holders, and short-lived momentum.
That distinction is not semantic. It changes how you source data, how you define fair value, and how you control risk.
For the altcoin, long-range forecasting should be treated carefully. Verified projection data from CoinDataFlow’s XBT prediction page shows how wide the dispersion is. Some models project the token could reach $0.002715 by 2031, while another model cited in the verified dataset projects $0.005920 by 2050, implying a 222.51% increase from current levels. Those projections don't create certainty. They show how speculative the asset remains.
The better takeaway is practical. If you're dealing with institutional XBT, think like a market-structure trader. If you're dealing with altcoin XBT, think like a risk manager first and a speculator second.
That’s the durable edge. Not a hotter prediction. A cleaner distinction.
The altcoin XBT's price history is short, violent, and more instructive than most commentary around it acknowledges. Understanding what actually happened — and why — is more useful than any forward projection based on a fixed growth rate attached to a year.
The token reached its all-time high of $0.03015 on May 17, 2025. By June 21, 2025 — roughly five weeks later — it had fallen to an all-time low of $0.0006932. That is a 97.7% decline in approximately 35 days. To put that in context, that is not a correction. That is a market structure collapse. The kind of move that happens when a token's price was never supported by real buy-side depth to begin with, when the holders who pushed it to the peak had no interest in holding it there, and when the only participants left after the exit are those who either didn't notice in time or couldn't get out cleanly.
According to verified market data, the top 10 holders of the altcoin XBT control 65% of total supply. That single statistic explains the price chart better than any technical pattern. When 65% of a token's supply is concentrated in 10 addresses, the printed price is not the result of broad market consensus. It is the result of what those 10 holders are willing to bid, ask, or hold at any given moment. When a significant portion of that group decides to exit — for any reason, coordinated or not — there are not enough natural buyers in the remaining 35% of supply to absorb the pressure without the price breaking down.
This is not a fringe concern or a theoretical risk. It is the documented behavior of the asset's actual price history. The move from ATH to ATL in 35 days is the on-chain fingerprint of concentrated supply meeting zero liquidity support.
The only framework that gives a trader a real edge in an asset with this ownership structure is wallet-level analysis, not chart analysis. Pattern recognition works when price formation reflects broad, distributed market activity. In a concentrated market, price can gap through support levels before a candle even closes, because the holder who was providing support is the same holder now selling.
What actually works is watching the wallets that matter before they move, not after. That means identifying the top holder addresses, monitoring whether they are accumulating, holding, or distributing, and treating any position in the altcoin XBT as contingent on what that small cluster is doing. A wallet that has been consistently selling into minor bounces while the price holds flat is a far more important data point than an RSI reading or a moving average crossover. Wallet Finder.ai is built exactly for this workflow — tracking wallet behavior across chains, filtering for wallets with repeatable profitable patterns, and setting alerts when the addresses that drive these markets actually move. In a token where 3 wallets have documented 200%+ realized PnL, knowing when those wallets are active is the entire edge. You can go deeper on building this kind of monitoring routine in the crypto wallet tracking guide.
For Bitcoin, XBT and BTC refer to the same underlying asset, but they appear in different naming conventions. XBT is the standardized ticker used in some institutional contexts, while BTC is the label most retail traders are used to seeing.
Because some search results refer to the altcoin named XBT, not Bitcoin. If the quoted price looks like a micro-cap token, you are not looking at institutional Bitcoin pricing.
Institutional and professional venues may use XBT in market labels, derivatives, or pricing references. The important point isn't the letters alone. It's the venue context and instrument definition.
No. It is a separate asset with a different risk profile, different liquidity conditions, and different drivers.
Sometimes, but not automatically. A visible gap only matters if you can execute both sides cleanly and the market structure doesn't introduce extra risk through slippage, settlement friction, or wrapper-specific behavior.
Usually not. In a concentrated micro-cap market, chart analysis without wallet and liquidity context can be misleading. Ownership concentration and execution conditions matter as much as pattern recognition.
They should be treated as speculative scenarios, not dependable valuation anchors. The verified forecast range is wide, which tells you uncertainty is high.
If you want to turn wallet activity into something actionable instead of just watching it after the move, Wallet Finder.ai helps you identify profitable wallets, inspect trade histories, filter for stronger performers, and set alerts when tracked wallets buy or sell. For traders navigating confusing symbols, thin liquidity, and fast on-chain rotations, that kind of workflow is far more useful than staring at a single price chart.

A premier DeFi analytics platform empowering traders to discover and analyze profitable blockchain wallets, trades and tokens.

