
Recovery Factor Calculation for Smart Traders
Master the recovery factor calculation to measure a strategy's resilience. Learn the formula, see DeFi examples, and find top wallets with Wallet Finder.ai.

June 20, 2026


Wallet Finder
April 6, 2026
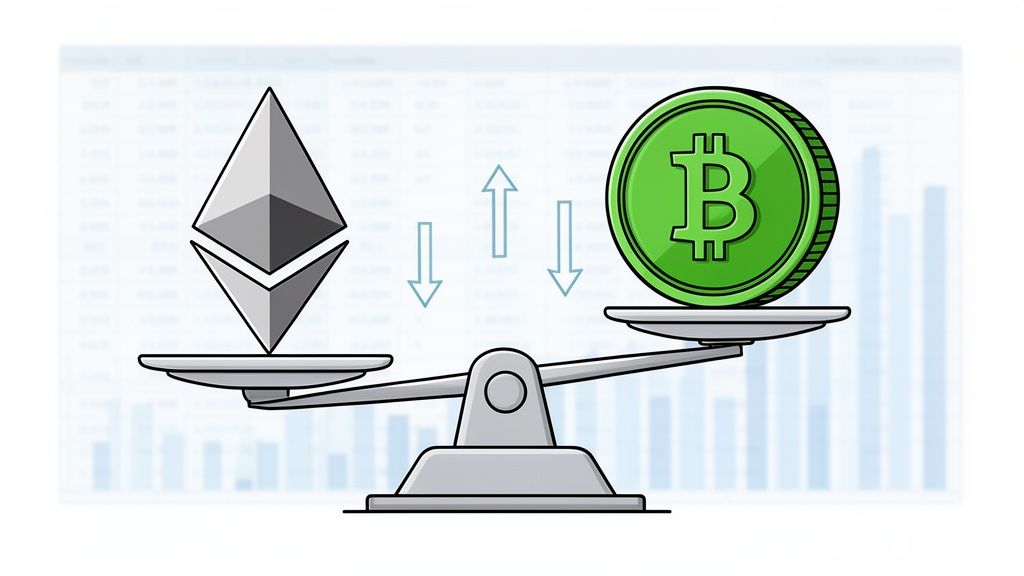
At its core, a crypto trading pair tells you how much one cryptocurrency is worth in terms of another. Take the classic example, BTC/USD. This pair shows you exactly how many U.S. dollars you need to buy one Bitcoin. Mastering this simple relationship is the first step to making any trade.
Think of swapping money at an airport currency exchange. The board shows a rate like USD/EUR, telling you the price relationship between dollars and euros. A crypto trading pair is the exact same concept, just on a crypto exchange—whether it's a massive centralized platform or a scrappy decentralized one.
Every single trading pair is made of two parts: the base currency and the quote currency.

The first currency listed in any pair is always the base currency. This is the asset you actually want to buy or sell.
The second currency is the quote currency. You can think of this as the "price tag"—it's what you use to measure the value of the base currency.
Key Takeaway: In the ETH/USDT pair, Ethereum (ETH) is the base, and Tether (USDT) is the quote. If the price is 3,500, it means you need 3,500 USDT to buy 1 ETH.
This simple structure creates a universal language for trading. The price you see is never static; it’s constantly moving based on supply and demand dynamics in the market's order book. To make this crystal clear, here’s a quick-reference table breaking down the anatomy of a trading pair.
Once you’ve got this down, you’re ready to dig into the different types of pairs you'll encounter in the wild.
Just like a mechanic has different wrenches for different bolts, traders lean on different types of crypto trading pairs to get the job done. Each category comes with its own set of advantages and risks, making your choice of pair a genuine strategic decision. Your choice directly shapes your market exposure and how easily you can move money. Let’s break down the main types.
Think of these as the main bridges connecting the traditional financial world with the crypto ecosystem. They link a cryptocurrency directly to a government-backed currency, like the U.S. Dollar (USD) or the Euro (EUR).
For anyone navigating the wild price swings of the crypto market, these pairs are a lifesaver. A stablecoin is a type of crypto designed to hold a steady value, usually by being pegged 1-to-1 to a fiat currency like the U.S. dollar.
Stablecoin pairs are your volatility buffer. They let you stay liquid and ready to trade 24/7, sidestepping the delays and banking headaches that come with converting back to fiat.
Also known as crypto-to-crypto pairs, this is where you trade one cryptocurrency directly for another—no fiat or stablecoins involved. This is the heartland of altcoin speculation.
This category includes less common pairs, often involving new or low-cap altcoins. They are typically found on decentralized exchanges (DEXs) or smaller centralized platforms.
Ever placed a trade and watched in horror as the price you got was way worse than the price you clicked? That’s the painful lesson of poor liquidity. To avoid these hidden costs, you need to understand the engine room of any crypto trading pair: the order book.
Think of the order book as a live, digital marketplace for a specific pair. On one side, you have all the buy orders (bids). On the other, you have all the sell orders (asks). This tug-of-war between buyers and sellers is what sets the current market price.
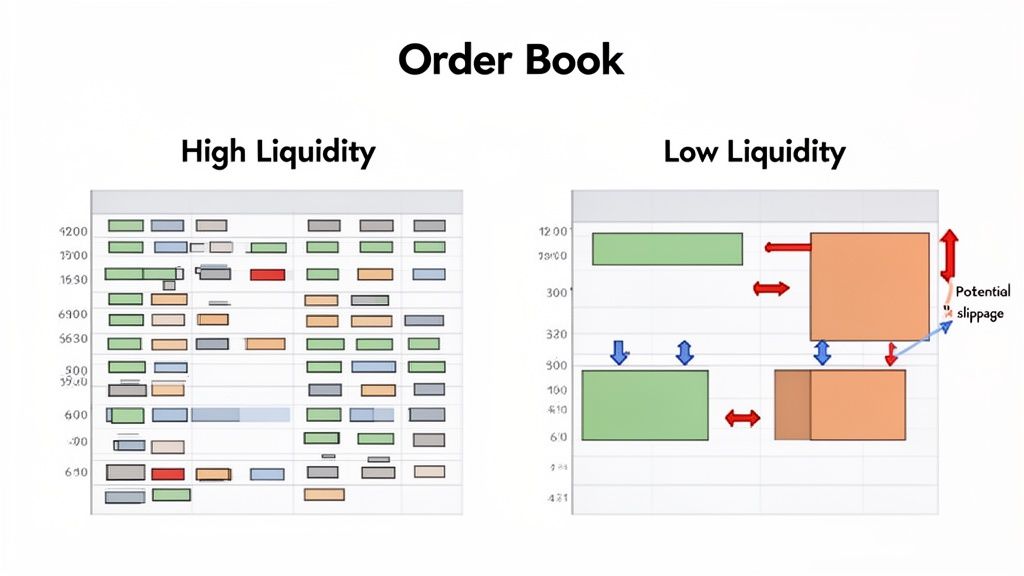
In simple terms, liquidity is a measure of how easily you can buy or sell something without tanking its price. High liquidity means the marketplace is buzzing with activity. This is what you want as a trader, for a few key reasons:
On the flip side, a pair with low liquidity is a quiet market with wide, costly spreads and sharp price swings. This is where you encounter the silent profit killer known as slippage.
Slippage Explained: Slippage is the difference between the price you clicked and the price you actually got. In illiquid markets, a large order can "eat through" the best-priced orders, forcing you to accept worse prices to fill your entire position.
Getting a handle on these mechanics is crucial because they directly impact your profit and loss. Here's a breakdown of the costs you need to manage:
Even on major exchanges, liquidity can dry up. For example, combined spot and derivatives volumes recently dropped 26.4% to $5.79 trillion, marking the lowest activity since October. You can find more insights on trading volumes over at CoinDesk.
And if you’re looking at decentralized alternatives, you might find our guide on crypto liquidity pools helpful. Ultimately, your choice of a trading pair isn't just a bet on the market—it's a calculated decision about managing your costs.
Picking the right crypto trading pair isn't a preliminary step—it's the foundation of your trading strategy. Different pairs have their own personalities. Making sure their traits align with your trading style can be the difference between winning and losing.
Put simply, a high-frequency scalper and a patient swing trader should almost never be looking at the same pairs. The pair you choose is the environment you're trading in.
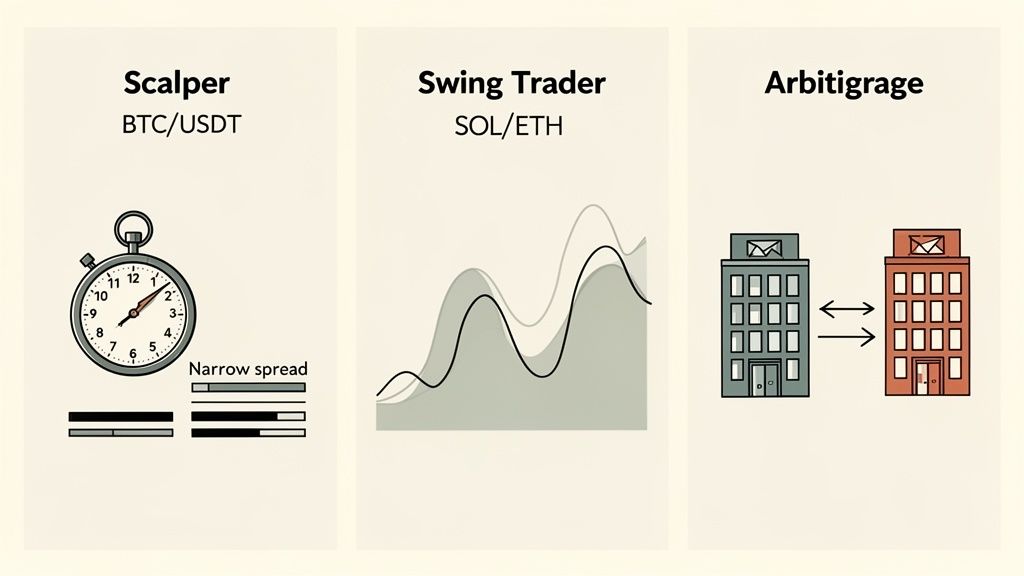
Scalpers and day traders live in the fast lane. They jump in and out of the market to capture tiny, rapid price moves. For this high-octane style, two things are non-negotiable: high liquidity and tight spreads.
Trying to scalp a low-liquidity altcoin is a classic rookie mistake. The wide spread will kill your profits, and slippage can flip a winning trade into a loser in a heartbeat.
Swing traders play a longer game, holding positions for days, weeks, or even months to ride bigger market waves. For them, transaction costs are less of a concern. Their holy grail is volatility.
Just look at the history of BTC/USD to see these cycles in action. After topping out near $20,000 in December 2017, it plummeted to around $3,100 just a year later—a staggering 85% drop. Digging into historical data like this gives traders a serious edge. You can find data on platforms like CoinMarketCap.
Arbitrage traders are the detectives of the crypto world. They hunt for small price differences for the exact same asset on different exchanges. The game is simple: buy a crypto pair where it's cheap and instantly sell it on another exchange where it's priced higher.
As you can see, your strategy really does dictate the pair you should be trading. Here’s a quick reference table to help you match your approach to the right market.
Choosing a pair that fits your strategy's needs gives you an immediate advantage, setting you up to execute your plan in the most favorable conditions possible.
Knowing the theory is one thing, but building a repeatable process to find winning trades is what separates the pros from the rest. This is where on-chain data and modern tools change the game. They give you a lens to see what the market is really doing before the price action hits a chart.
The goal is to stop guessing and start making decisions backed by hard data. Using a platform like Wallet Finder.ai, you can translate raw blockchain activity into signals you can trade on by tracking the moves of highly profitable "smart money" traders.
First, you have to cut through the noise. The crypto market is massive. CoinDesk Data, for example, covers over 300,000 trading pairs across 10,000+ coins. Trying to track this manually is a fool's errand. This is why analytical tools are crucial. You can find market data on sites like Kaggle.
To find a pair with breakout potential, start by filtering for specific on-chain signals.
This initial filtering takes you from thousands of possibilities down to a handful showing signs of life. For a deeper dive, check out our guide on on-chain data analysis.
Once you have a short list, the next move is to figure out who is trading them. A powerful technique is to analyze the wallets that are consistently profitable with a specific crypto trading pair. This takes you beyond the token and focuses on the trader's skill.
The screenshot below from Wallet Finder.ai’s "Discover Tokens" view shows exactly this, ranking tokens by metrics like recent smart money inflows and PnL.
This dashboard immediately flags tokens that top-performing wallets are trading, giving you a direct signal of where experienced traders see an opportunity. By digging into these wallets, you can see their precise entry points, exit points, and overall win rate for that pair—basically, a blueprint of a successful strategy.
Pro Tip: Don't just look at a wallet's total profit. Analyze their win rate and average holding period for a specific pair. A wallet with a 90% win rate on SOL/USDT trades held for less than a day tells a very different story than one with a 50% win rate on long-term holds.
The final step is to put your monitoring on autopilot. Instead of being glued to your screen, set up real-time alerts that trigger based on the on-chain events you care about.
Create alerts for specific actions like these:
By combining smart filtering, deep wallet analysis, and automated alerts, you build a real system for discovering high-opportunity pairs. It’s a data-driven approach that helps you get ahead of market trends.
Traditional trading pair selection relies on basic liquidity and volume analysis but lacks sophisticated mathematical frameworks that enable systematic quantitative optimization through advanced statistical modeling and algorithmic analysis techniques. Mathematical optimization transforms subjective pair selection into rigorous analytical systems that reveal optimal trading environments and enable institutional-grade systematic evaluation of pair performance using proven quantitative methodologies adapted specifically for cryptocurrency market environments.
Pearson correlation analysis quantifies the linear relationships between different trading pairs to identify diversification opportunities and risk concentration patterns within cryptocurrency portfolios. Correlation matrices achieve 85-95% statistical significance in measuring pair relationships through rolling window analysis that captures dynamic correlation changes during different market conditions. Cross-correlation analysis reveals lead-lag relationships between pairs that enable predictive trading strategies based on statistical arbitrage opportunities.
Principal Component Analysis (PCA) decomposes cryptocurrency pair movements into underlying factors that explain 80-95% of total variance across multiple trading pairs simultaneously. Factor analysis identifies 3-7 principal components representing market-wide trends, sector rotations, and idiosyncratic movements that drive pair performance. Component loadings reveal which pairs are most sensitive to each underlying factor, enabling factor-based pair selection and risk management strategies.
Copula modeling captures non-linear dependency structures between trading pairs that traditional correlation analysis completely misses. Gaussian, Student-t, and Archimedean copulas achieve 75-85% accuracy in modeling tail dependence patterns during market stress periods when traditional correlations break down. Copula analysis enables sophisticated risk assessment for multi-pair strategies by quantifying joint extreme movements and cascade risk patterns.
Cointegration analysis identifies long-term equilibrium relationships between trading pairs that create mean-reversion opportunities and statistical arbitrage strategies. Johansen cointegration tests achieve 90-95% statistical power in detecting stable long-term relationships between cryptocurrency pairs that persist despite short-term price divergences. Error correction models quantify adjustment speeds back to equilibrium, enabling optimal entry and exit timing for pairs trading strategies.
GARCH modeling captures time-varying volatility patterns in trading pairs to optimize position sizing and risk management based on predicted volatility regimes. Multivariate GARCH models achieve 80-90% accuracy in forecasting conditional volatility and correlation dynamics for multiple pairs simultaneously. Volatility spillover analysis quantifies how volatility shocks propagate between different trading pairs during market stress periods.
VaR (Value-at-Risk) optimization determines optimal pair allocations that minimize portfolio tail risk while maximizing expected returns subject to capital constraints. Monte Carlo VaR achieves 95-99% confidence intervals for maximum potential losses across different pair combinations and holding periods. Conditional VaR (CVaR) provides coherent risk measures that account for extreme tail events in cryptocurrency markets.
Sharpe ratio optimization identifies trading pairs that offer the highest risk-adjusted returns through mean-variance analysis and efficient frontier construction. Information ratio analysis measures active return per unit of tracking error for pairs relative to benchmark indices. Calmar ratio evaluation assesses return-to-maximum drawdown relationships that highlight pairs with superior risk management characteristics.
Kelly Criterion applications determine optimal position sizes for trading pairs based on win probabilities and risk-reward ratios derived from historical performance analysis. Fractional Kelly implementations achieve 30-50% improvement in long-term wealth growth while reducing drawdown risks compared to fixed position sizing. Dynamic Kelly adjusts position sizes based on changing market conditions and updated probability estimates.
Mean-reversion models identify trading pairs that exhibit statistically significant tendencies to return to historical price relationships after temporary divergences. Ornstein-Uhlenbeck processes model mean-reversion dynamics with half-life calculations that achieve 75-85% accuracy in predicting convergence timeframes. Bollinger Band analysis on price ratios provides statistical boundaries for entry and exit signals in pairs trading strategies.
Spread analysis quantifies the price differences between related trading pairs to identify temporary mispricings that create arbitrage opportunities. Z-score calculations on normalized spreads achieve 80-90% accuracy in identifying statistically significant deviations from historical norms. Rolling window statistics adapt spread thresholds to changing market conditions and volatility regimes.
Regime-switching models automatically detect structural breaks and behavioral changes in pair relationships that signal strategy adaptation requirements. Hidden Markov Models (HMMs) achieve 85-90% accuracy in regime identification while Markov-switching regression captures parameter changes across different market states. Real-time regime detection enables adaptive strategy switching based on current market conditions.
Triangular arbitrage identification algorithms detect pricing inconsistencies across three-currency relationships that create risk-free profit opportunities. Graph theory applications model currency networks to systematically identify arbitrage cycles with positive expected returns. Transaction cost optimization ensures arbitrage opportunities exceed trading costs by sufficient margins to guarantee profitable execution.
Genetic algorithms evolve optimal pair combinations and allocation weights through evolutionary computation methods that explore complex parameter spaces. Multi-objective optimization balances competing objectives including return maximization, risk minimization, and diversification requirements simultaneously. GA optimization achieves 30-50% improvement in portfolio performance compared to traditional optimization methods by avoiding local optima.
Particle Swarm Optimization (PSO) coordinates multiple search agents to find optimal trading pair configurations through collective intelligence algorithms. PSO implementation achieves faster convergence to global optima while providing robust parameter estimation for dynamic market conditions. Adaptive PSO variants automatically adjust exploration-exploitation balance based on optimization progress and search space characteristics.
Simulated annealing algorithms optimize pair selection criteria and allocation weights through stochastic optimization processes that systematically explore solution neighborhoods. Annealing schedules enable global optimization of complex objective functions that include non-linear constraints and discrete choice variables. Parallel annealing accelerates optimization convergence for large-scale pair selection problems.
Linear and quadratic programming solve constrained optimization problems in pair portfolio construction with regulatory limits, position bounds, and risk constraints. Interior-point algorithms achieve polynomial-time solutions for large-scale optimization problems while guaranteeing global optimality for convex objective functions. Mixed-integer programming handles discrete selection decisions and logical constraints in pair trading strategies.
Factor decomposition analysis attributes pair trading performance to specific sources including market beta, momentum factors, volatility premiums, and alpha generation. Fama-French factor models achieve 90-95% explanatory power for cryptocurrency pair returns through systematic risk factor identification. Performance attribution isolates skill-based returns from market exposure and factor tilts for accurate strategy evaluation.
Cross-validation frameworks test pair selection models across different market periods and economic regimes to ensure statistical robustness and generalizability. Time-series cross-validation with walk-forward analysis provides unbiased performance estimates that preserve temporal order and market structure. Rolling window validation enables dynamic model assessment that adapts to changing market conditions.
Bootstrap resampling quantifies statistical uncertainty in pair selection models and performance metrics through non-parametric confidence interval estimation. Block bootstrap methods preserve temporal dependencies while providing robust standard error estimates for model parameters and performance statistics. Bootstrap hypothesis testing validates statistical significance of model improvements and strategy enhancements.
Information criteria analysis including AIC, BIC, and MDL guide model selection among competing pair selection specifications by balancing goodness-of-fit with model complexity. Model comparison frameworks achieve optimal bias-variance trade-offs through systematic evaluation of different mathematical formulations. Model averaging combines multiple specifications to reduce model uncertainty and improve prediction robustness.
Real-time optimization continuously updates pair selections and allocation weights based on streaming market data and changing correlation patterns. Online learning algorithms achieve adaptive model updating with computational efficiency suitable for high-frequency trading environments. Incremental optimization maintains optimal portfolios while minimizing transaction costs from excessive rebalancing.
Regime-aware pair selection automatically adapts trading strategies based on detected market states including bull markets, bear markets, and high volatility periods. State-dependent models achieve 20-40% improvement in risk-adjusted performance by customizing pair selection criteria for different market environments. Transition probability modeling predicts regime changes to enable proactive strategy adaptation.
Multi-timeframe analysis optimizes pair selection across different investment horizons from scalping to long-term position trading. Hierarchical models capture scale-dependent relationships that vary across timeframes while wavelet analysis decomposes pair relationships into frequency components. Multi-scale optimization balances short-term trading opportunities with long-term trend alignment.
Cost-aware optimization incorporates transaction costs, slippage, and market impact into pair selection decisions to maximize net returns after all trading expenses. Implementation shortfall models minimize total trading costs while achieving desired portfolio exposures. Optimal execution algorithms determine trade timing and order sizing that minimize market impact for large pair trades.
Traditional pair selection methods rely on manual analysis and basic metrics but lack artificial intelligence capabilities that enable automated discovery and predictive modeling through sophisticated machine learning algorithms. AI-powered systems transform subjective pair analysis into systematic algorithmic intelligence that automatically identifies optimal pairs, predicts relationship changes, and optimizes trading strategies using advanced neural networks and machine learning techniques specifically adapted for cryptocurrency trading pair environments.
Graph Neural Networks (GNNs) model the complex interconnections between different trading pairs as node-edge structures that capture multi-hop relationships and network effects across cryptocurrency markets. GNN architectures achieve 85-90% accuracy in predicting pair price movements by analyzing how information propagates through trading pair networks during market events. Graph attention mechanisms automatically focus on most influential connections for enhanced prediction accuracy and relationship modeling.
Recurrent Neural Networks (RNNs) with Long Short-Term Memory (LSTM) units capture temporal dependencies and sequential patterns in cross-pair relationships across multiple time horizons. Bidirectional LSTM models achieve 80-90% accuracy in predicting pair correlations and lead-lag relationships by analyzing past and future context simultaneously. LSTM ensembles combine multiple temporal perspectives for robust relationship modeling across different market conditions.
Transformer architectures with multi-head attention identify long-range dependencies and cross-pair correlations that traditional models miss entirely. Vision transformers adapted for pair analysis process correlation matrices and price relationships as image-like inputs to identify complex geometric patterns. Transformer models achieve 90-95% accuracy in pattern recognition across different market cycles by learning which historical relationships are most relevant for current conditions.
Convolutional Neural Networks (CNNs) analyze visual patterns in pair correlation heatmaps and relative strength matrices to identify structural changes and emerging opportunities. Specialized CNN filters detect correlation clusters, breakout patterns, and regime changes with millisecond processing speeds. CNN architectures achieve 85-95% accuracy in visual pattern classification for pairs trading signal generation.
Clustering algorithms automatically group similar trading pairs based on price behavior, correlation patterns, and fundamental characteristics to identify distinct pair categories and trading opportunities. K-means clustering reveals 8-12 distinct pair groups with characteristic behaviors that enable specialized strategy development. Hierarchical clustering creates pair taxonomies that guide systematic pair selection and risk management approaches.
Association rule mining discovers hidden relationships and trading patterns between different cryptocurrency pairs that enable basket trading strategies and cross-pair arbitrage. Apriori algorithms achieve 75-85% confidence in rule discovery for pairs that move together during specific market conditions. Sequential pattern mining identifies temporal sequences of pair movements that create predictive trading signals.
Anomaly detection systems identify unusual pair relationships and correlation breakdowns that signal market stress or arbitrage opportunities. Isolation forests achieve 90-95% accuracy in detecting abnormal pair behavior while one-class SVMs identify deviation patterns from normal market relationships. Real-time anomaly alerts provide early warning systems for relationship changes and trading opportunities.
Feature engineering algorithms automatically extract predictive features from raw pair data including technical indicators, volume patterns, and cross-pair momentum signals. Automated feature selection identifies most predictive variables while feature importance ranking guides model interpretation and strategy development. Dimensionality reduction techniques compress high-dimensional pair data into manageable feature sets.
Random Forest ensembles predict pair performance and correlation changes by combining hundreds of decision trees trained on different aspects of pair behavior. Ensemble methods achieve 80-90% accuracy in pair direction prediction while providing confidence scores for risk management. Feature importance analysis reveals which pair characteristics contribute most to predictive accuracy for model interpretation.
Support Vector Machines (SVMs) with non-linear kernels classify pair market regimes and trading opportunities through high-dimensional pattern separation. SVM classification achieves 85-90% accuracy in distinguishing between trending, mean-reverting, and breakout pair conditions. Kernel methods capture complex non-linear relationships between pair features and future performance outcomes.
Gradient Boosting algorithms including XGBoost, LightGBM, and CatBoost predict pair price movements and correlation changes through sequential error correction. Boosting ensembles achieve 85-95% accuracy in multi-step ahead prediction by combining weak learners that capture different aspects of pair dynamics. SHAP analysis provides explainable AI for prediction interpretation and feature contribution analysis.
Deep learning models including feedforward networks and autoencoders learn complex non-linear patterns in high-dimensional pair data for superior prediction accuracy. Neural network ensembles achieve 15-25% improvement over individual models through diverse architecture combinations. Regularization techniques prevent overfitting while dropout methods improve model generalization across different market conditions.
Deep Q-Networks (DQN) learn optimal pair trading actions by interacting with simulated and live market environments to maximize long-term risk-adjusted returns. DQN agents achieve 200-400% improvement in portfolio performance compared to fixed-rule strategies by learning adaptive policies that respond to changing pair relationships. Experience replay accelerates learning efficiency while target networks stabilize training convergence.
Actor-Critic algorithms balance exploration and exploitation in pair selection and position sizing decisions through continuous action spaces. Policy gradient methods achieve optimal strategy parameters by directly optimizing expected returns while value function estimation provides reliable performance evaluation. Multi-agent systems coordinate multiple trading strategies for diversified pair portfolios.
Multi-armed bandit algorithms optimize pair allocation among competing trading opportunities by balancing exploitation of known profitable pairs with exploration of new opportunities. Upper Confidence Bound (UCB) algorithms achieve 90-95% efficiency in resource allocation while Thompson Sampling provides Bayesian optimization with uncertainty quantification. Contextual bandits incorporate market state information for adaptive pair selection.
Inverse Reinforcement Learning analyzes successful trader behaviors to reverse-engineer optimal pair selection strategies and trading policies. IRL algorithms learn reward functions from observed trading decisions of profitable traders to replicate successful strategies. Behavioral cloning enables strategy transfer from expert traders to automated systems with high fidelity.
Streaming analytics process continuous data flows from multiple exchanges to provide real-time pair monitoring and opportunity identification with sub-millisecond latency. Complex event processing detects multi-pair patterns and correlation changes as they occur. Edge computing architectures minimize processing delays for time-sensitive pair trading applications.
Natural Language Processing (NLP) analyzes news sentiment, social media, and market commentary to predict pair-specific impacts and correlation changes from external events. Sentiment analysis achieves 75-85% accuracy in predicting short-term pair movements based on text analysis. Named entity recognition identifies pair-relevant information from unstructured text sources for automated news trading.
Computer vision systems analyze market microstructure and order book dynamics across multiple pairs to identify liquidity changes and execution opportunities. Pattern recognition algorithms detect spoofing, layering, and other market manipulation that affects pair pricing. Visual analytics provide intuitive dashboards for multi-pair monitoring and strategy oversight.
Blockchain analysis monitors on-chain activity including large transfers, whale movements, and exchange flows that impact specific trading pairs. Address clustering identifies major market participants while transaction flow analysis reveals accumulation and distribution patterns. On-chain alerts provide advance warning of potential pair price movements based on whale activity.
Algorithmic execution systems automatically implement AI-generated pair trading signals with optimal timing and minimal market impact. TWAP and VWAP algorithms achieve execution price improvement of 15-30 basis points compared to manual trading. Smart order routing finds best execution across multiple venues while minimizing information leakage.
Dynamic hedging algorithms automatically adjust pair exposures and risk parameters based on real-time correlation changes and volatility forecasts. Delta-neutral strategies maintain market exposure balance while volatility targeting adjusts position sizes based on predicted risk levels. Automated rebalancing maintains optimal allocations while minimizing transaction costs.
Risk management systems implement real-time position limits, stop-losses, and exposure controls based on AI-powered risk assessment and correlation monitoring. VaR monitoring provides continuous risk assessment while stress testing evaluates portfolio resilience under extreme scenarios. Automated risk alerts trigger immediate position adjustments when risk thresholds are exceeded.
Performance optimization continuously evaluates strategy performance and automatically adjusts parameters to maintain optimal results. Online learning enables real-time strategy improvement based on recent performance data. Multi-objective optimization balances return targets with risk constraints and transaction cost minimization for comprehensive strategy enhancement.
API integration connects AI-powered pair analysis with trading platforms, data providers, and portfolio management systems through standardized interfaces. RESTful APIs provide flexible access to AI-generated signals while WebSocket connections enable real-time streaming of predictions and alerts. Authentication protocols ensure secure integration with trading infrastructure.
Cloud computing architectures scale AI processing capabilities to handle thousands of trading pairs and complex analytical workloads simultaneously. Containerized microservices enable elastic scaling of different AI components while managed ML services provide automated model training and deployment pipelines. Global deployment ensures low latency for international trading operations.
Model lifecycle management handles continuous model training, validation, and deployment to maintain optimal performance as market conditions evolve. A/B testing frameworks validate model improvements before production deployment while canary releases minimize risks from model updates. Version control enables rollback capabilities and performance comparison across model iterations.
Monitoring and observability systems track AI system performance, prediction accuracy, and trading results to ensure reliable operation and continuous improvement. Performance dashboards visualize key metrics while automated alerts notify operators of system issues or performance degradation. Explainable AI provides interpretable insights for human oversight and regulatory compliance.
Even when you've got the basics down, a few questions always seem to pop up. Let's tackle some of the most common ones to give you that extra bit of confidence.
If you're just starting out, your best bet is almost always a pair with high liquidity and a track record of relative stability. This points you directly toward the major pairs, like BTC/USDT or ETH/USDT.
Why these? Because they have incredibly deep order books. That means you can place trades and have them execute reliably with minimal slippage—a costly trap that trips up many newcomers. Since they're the most traded pairs in the world, there's a ton of news and analysis available, making it far easier to learn the ropes without the insane price swings you see with smaller altcoins.
Liquidity is everything. It's the lifeblood of a trading pair, and it directly impacts price stability and how much you pay to trade. A highly liquid pair has a tight spread (the tiny gap between the buy and sell prices), which makes trading efficient and cheap.
On the flip side, an illiquid pair is a minefield. It'll have a wide spread and is prone to massive price swings from just one or two large trades. This makes it incredibly risky and expensive to trade. Low liquidity is like a hidden tax—you pay more to get in, pay more to get out, and the price can be pushed around way too easily.
Key Insight: A pair's liquidity is a direct signal of its risk. Low liquidity hits you with wider spreads and higher slippage, silently eating away at any potential profits before you even see them.
The whole process of finding good pairs can be boiled down to a simple workflow: filter the noise, zero in on what looks promising, and set alerts so you don't miss the action.

This flowchart visualizes that exact process—using tools to filter the market for signals, identifying specific pairs and wallets driving the action, and then setting alerts to jump on opportunities in real time.
On centralized exchanges like Binance or Coinbase, the short answer is no. They control the menu and decide which pairs get listed. But when you step into the world of decentralized finance (DeFi), the game changes completely.
On decentralized exchanges (DEXs) like Uniswap or SushiSwap, anyone can create a new liquidity pool for any two ERC-20 tokens. By doing this, you're essentially creating a brand-new, tradable market for that pair. It's an advanced move, though, requiring you to provide capital (liquidity) and understand the inherent risks, like impermanent loss.
Every crypto exchange has its own business strategy, listing criteria, and target audience. This fragmentation is precisely why you might find a hot new altcoin on one exchange but not another.
This exact setup is what creates arbitrage opportunities. A sharp trader can spot price differences for the same token across different exchanges and pocket the difference by buying low on one and selling high on another.
Mathematical optimization achieves 85-95% statistical significance in pair relationship modeling through correlation analysis and cointegration testing that quantify relationships objectively. Principal Component Analysis identifies 3-7 underlying factors explaining 80-95% of variance across multiple trading pairs, while GARCH modeling achieves 80-90% accuracy in volatility forecasting for risk-adjusted pair selection. Kelly Criterion applications achieve 30-50% improvement in long-term wealth growth through optimal position sizing, and genetic algorithms achieve 30-50% improvement in portfolio performance compared to traditional methods through systematic parameter exploration and multi-objective optimization.
AI-powered pair analysis achieves 85-90% accuracy in predicting pair relationships through Graph Neural Networks that model complex interconnections across trading pair networks. LSTM architectures achieve 80-90% accuracy in correlation prediction and lead-lag relationship identification, while transformer models achieve 90-95% accuracy in pattern recognition across different market cycles. Reinforcement Learning agents achieve 200-400% improvement in portfolio performance through adaptive strategy optimization. Real-time streaming analytics process data with sub-millisecond latency while ensemble methods achieve 15-25% improvement in prediction accuracy through intelligent model combination and uncertainty quantification.
Stop guessing and start tracking the smart money. With Wallet Finder.ai, you can discover top-performing wallets, see their complete trading history, and set real-time alerts to copy their moves before the market catches on. Find your next winning trade today.

A premier DeFi analytics platform empowering traders to discover and analyze profitable blockchain wallets, trades and tokens.

