
Recovery Factor Calculation for Smart Traders
Master the recovery factor calculation to measure a strategy's resilience. Learn the formula, see DeFi examples, and find top wallets with Wallet Finder.ai.

June 20, 2026


Wallet Finder
February 13, 2026

Pair trading is a slick, market-neutral strategy that zeros in on the relative price movement between two related crypto assets, instead of trying to guess the direction of the entire market. Forget betting on whether Bitcoin will go up or down. With pair trading, you’re betting that Bitcoin will outperform Ethereum, or the other way around. This lets you hunt for profit in any market—bull, bear, or even when things are painfully sideways.
Think of two professional runners who almost always finish a marathon within minutes of each other. If one suddenly pulls way ahead mid-race, you might bet the other will catch up, closing the gap before the finish line. That's the heart of crypto pair trading.
The whole strategy pivots on finding two crypto assets that historically move in sync. When their prices temporarily drift apart—one shoots up while the other stalls or dips—a trading opportunity is born.
The mechanics are pretty straightforward:
Your profit doesn't come from the market soaring or crashing. It comes from the price relationship between those two assets snapping back to its historical average, a concept traders call "reversion to the mean." This is a world away from typical directional trading, where you're just gambling on an asset's absolute price change. You can dive deeper into what makes a good crypto trading pair in our detailed guide.
To get a clearer picture, let's look at how this stacks up against the way most people trade crypto.
This quick comparison highlights the fundamental differences in strategy, risk exposure, and profit generation.
As you can see, pair trading is built on a completely different foundation, designed to insulate you from the market's wild swings.
The biggest draw of pair trading is its market-neutral nature. Because you're holding both a long and a short position simultaneously, your direct exposure to the whims of the market is slashed.
A well-executed pair trade can actually make money even if the entire crypto market tanks. If both assets fall, but the one you shorted falls more than the one you went long on, you still walk away with a net gain.
This makes it an incredibly powerful tool for generating returns that aren't tied to a raging bull market. It shifts your focus from guessing broad market sentiment to analyzing the specific, statistical relationship between two assets. This allows for far more controlled and data-driven decisions.
Let's walk through a simple example. Say you've identified that Solana (SOL) and Avalanche (AVAX) have a strong, historical price relationship. Then you spot something unusual: SOL's price has suddenly ripped 10% higher than AVAX's, creating a much wider gap between them than normal.
Here’s how you’d play it:
This methodical process strips a lot of the emotion and guesswork out of trading, replacing it with a cool, data-informed strategy.
To get pair trading right in crypto, you have to dig deeper than surface-level price charts. Too many traders fall into the same trap: confusing correlation with cointegration. They sound similar, but knowing the difference is often what separates a winning strategy from a losing one.
Correlation just means two assets are moving in the same general direction. A big market event, like a surprise regulatory announcement, could make both Bitcoin and some random altcoin tank together. That's correlation, but it's often a temporary fluke—not something you want to bet your money on.
Cointegration is the real deal. It points to a much deeper, more stable economic link between two assets. It means that even if their prices drift apart for a bit, the spread—the difference between them—is stable and always snaps back to its long-term average. For pair traders, this is the holy grail.
Imagine you're walking a dog on a leash. You're one asset, the dog is the other. Both of you wander around the park—sometimes you move apart as the dog chases a squirrel, other times you move closer together.
But no matter how much you both wander, the leash makes sure you never drift too far from each other. If the dog bolts ahead, the leash pulls it back. If you start walking too fast, you'll eventually have to slow down so it can catch up. That leash is the cointegrating relationship—an invisible force that keeps pulling the two prices back toward their natural balance.
In trading, cointegration is the statistical "leash" that ties two assets together. High correlation without cointegration is just two dogs running wild in the same park. They might head in the same direction for a while, but nothing is stopping them from suddenly running off in opposite directions.
When you find a genuinely cointegrated pair, you gain a statistical edge. You're essentially betting that the "leash" will do its job when the spread between the two assets gets a little too stretched.
Leaning only on correlation is a classic and costly mistake. A high correlation number, like +0.85, might look great on paper, but it's often a smokescreen. Here's why it's a trap:
This is exactly why pro traders never risk their capital without first running statistical tests to confirm cointegration.
So, how do you know if a pair's connection is real or just a coincidence? You don't have to guess. Traders use specific statistical tests to measure the stability of the spread between two assets over time. The go-to tool for this job is the Augmented Dickey-Fuller (ADF) test.
Here’s the simple version of how it works, no complex math needed:
By running an ADF test, you're graduating from just eyeballing charts to mathematically proving that a relationship is stable and tradable. This data-first approach is the bedrock of any solid pair trading cryptocurrency strategy.
Alright, now that we've got the theory down—the difference between correlation and the all-important cointegration—it's time to roll up our sleeves and put it into practice. Building a solid crypto pair trading strategy isn't about gut feelings or chasing pumps. It’s a systematic process, a clear workflow that turns market noise into a repeatable trading plan.
Here is a five-step, actionable checklist to build a robust strategy.
First things first, you need to decide which pool of assets—your "universe"—you're going to hunt in. Casting your net too wide is a classic mistake. A focused approach is always better.
The best universes are made up of assets that have a real economic or tech link. This seriously boosts your chances of finding genuinely cointegrated pairs.
By narrowing your focus, you're not just saving time; you're concentrating your efforts where you're most likely to strike gold.
With your universe defined, the real hunt begins. This is where data takes the driver's seat. You'll be mathematically testing pairs to see if they share that stable, long-term bond we talked about. And remember, just eyeballing a price chart for correlation won't cut it.
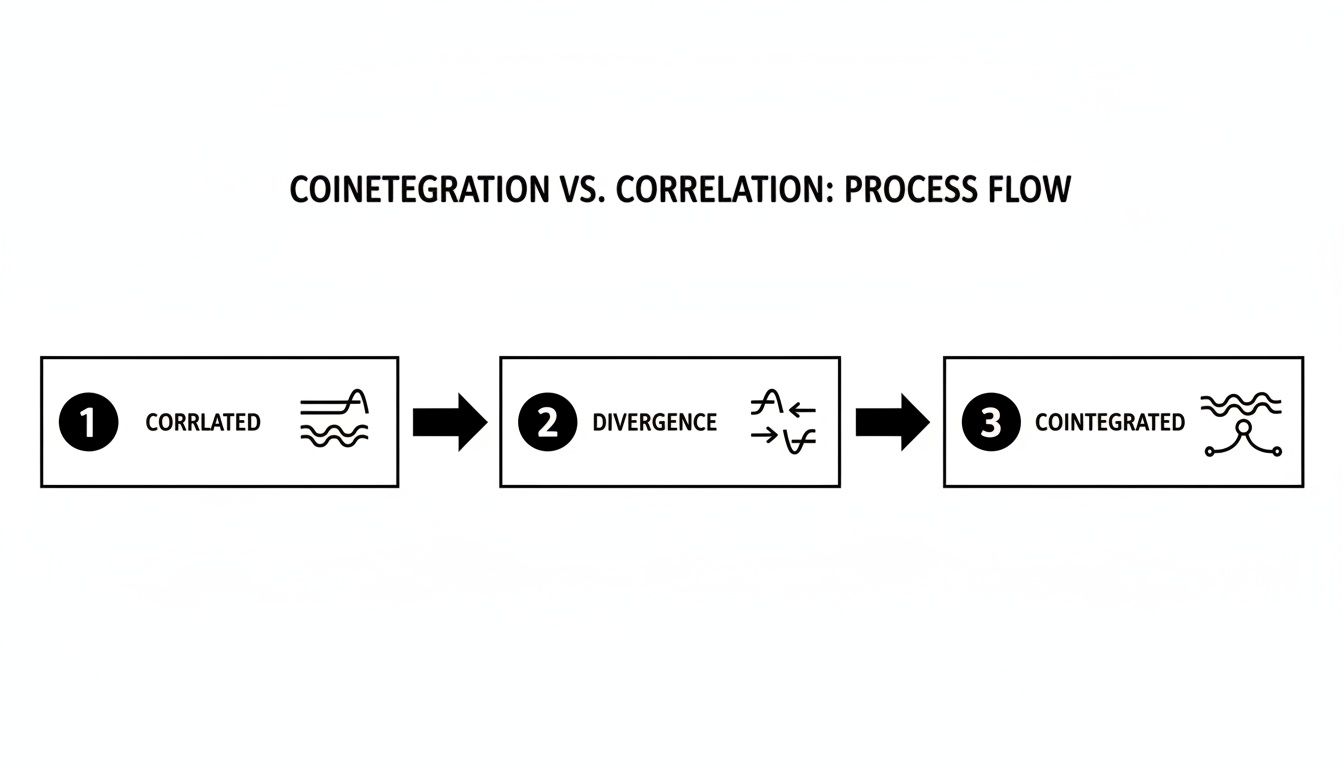
The image perfectly shows what we're after. Two assets can drift apart for a bit, but a true cointegrated relationship acts like a rubber band, eventually snapping them back toward their average.
The main tool for this job is the Augmented Dickey-Fuller (ADF) test. You run this test on the price spread (the ratio or difference) between every possible pair in your universe over a set historical period. A low p-value, typically <0.05, is your green light. It suggests the spread is stationary, making the pair a strong candidate for your strategy.
Once you've found a cointegrated pair, you need dead-simple rules for when to get in and when to get out. This is how you take emotion out of the equation. The most common method here is calculating the Z-score of the pair's price spread.
The Z-score simply tells you how far away the current spread is from its historical average, measured in standard deviations.
Think of the historical average spread as a river's normal water level. The Z-score is like a marker on the riverbank telling you how unusually high or low the water is. A Z-score of +2.0 means the river is swelling far above its banks, while a -2.0 means it's nearly dried up.
Your trading signals are then based on these Z-score levels:
Finding the right pair is only half the battle; structuring the trade correctly is just as important. The goal here is a dollar-neutral position. This means you invest the exact same dollar amount into both the long and short sides of the trade.
For instance, if you're putting $1,000 into a pair trade, you would short $1,000 worth of the outperforming asset and, at the same time, buy $1,000 worth of the underperforming one. This keeps your position balanced and helps maintain that market-neutral quality we're aiming for.
This is also a great time to look at what the pros are doing. Tools like Wallet Finder.ai let you peek over the shoulder of elite traders to see how they're executing these kinds of strategies right now. By watching top wallets, you can see their real-world entries, exits, and position sizes, giving you a powerful template for your own trades.
This is the final—and most critical—step. Backtesting is where you apply your strategy's rules to historical data to see how it would have performed. This isn't optional. It's the only way to know if your strategy actually has a statistical edge.
A real backtest has to include real-world costs like transaction fees and slippage. A strategy that looks amazing on paper can quickly turn into a money pit once you factor in these frictions. The results, when done right, can be eye-opening. For instance, good research on crypto pairs trading strategies shows that these methods often outperform simple buy-and-hold strategies, with some models achieving high reward-to-risk ratios.
Only after a strategy has proven itself in a tough, realistic backtest should you even think about putting real money on the line.
Building a statistical model from scratch is a heavy lift. It demands serious data science chops and constant upkeep. But what if you could skip all that and see what’s already working for the most profitable traders on the blockchain?
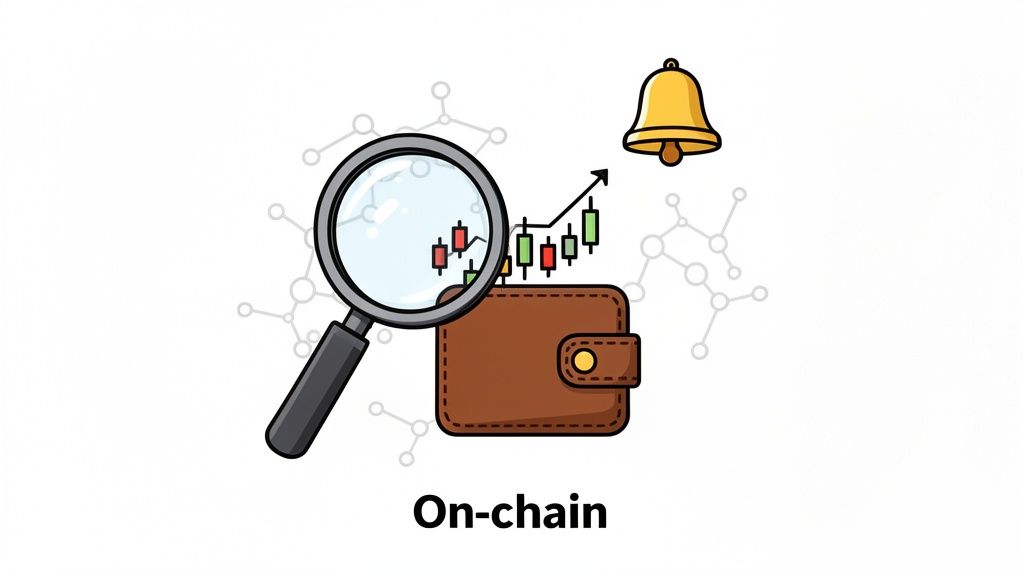
This is where on-chain data analysis completely changes the game for pair trading cryptocurrency.
Instead of getting lost in historical price charts, you can look directly at the blockchain to watch how elite wallets execute these strategies in real-time. It’s a massive shortcut, letting you mirror proven strategies without needing a PhD in statistics. Tools like Wallet Finder.ai are built for exactly this, turning the blockchain’s transparency into your personal trading playbook.
The rewards for getting this right can be huge. One study on crypto pairs trading found that a solid strategy could yield extraordinary results. An in-depth analysis of 33 major cryptocurrencies discovered that a correlation-based pairs trading method pulled in abnormal returns of a jaw-dropping 12% per month. Over the entire three-year study, the portfolio's total return hit 43.4%, proving its strength even when the market was in crisis.
The first move is to stop guessing and start following the "smart money" that’s actively crushing it with pair trades. On-chain analysis platforms let you sift through millions of wallets to find the ones with a high profit-and-loss (PnL) record, a killer win rate, and a history of consistent returns.
You’re no longer wondering which pairs might be cointegrated; you’re watching which pairs the top traders are exploiting right now.
Instead of asking, "Is ETH cointegrated with WSTETH?" you can now ask, "Which top-performing wallets are consistently making money swapping between ETH and WSTETH, and how are they doing it?"
This approach validates a pair's relationship through the demonstrated success of other traders. When you see multiple high-PnL wallets hitting the same pair over and over, that's a blinking neon sign that a profitable arbitrage opportunity is there for the taking.
Once you’ve tagged a promising wallet, the real education starts. Tools like Wallet Finder.ai let you pull apart a trader’s entire history, giving you a granular view of their playbook. This isn't just about seeing what they bought; it’s about understanding the how and the why.
Here’s a checklist of what to look for to reverse-engineer their success:
This deep dive turns on-chain data from a messy transaction ledger into a clear, actionable trading blueprint. You can learn more about these methods in our complete guide to on-chain data analysis.
The final piece of the puzzle is turning these insights into fast action. The best on-chain tools give you real-time alerts, pinging you the second a wallet you're watching makes a move.
This is the secret sauce for effective copy trading. You can set up notifications through platforms like Telegram that go off the moment one of your targeted traders executes a swap.
Actionable Workflow for Mirror Trading:
This on-chain approach effectively outsources the heavy statistical lifting to the market's most successful players.
Finding a profitable pair is temporary. Knowing how to protect your capital is what builds a lasting career. The whole "market-neutral" idea can lull traders into a false sense of security, but let's be real—this is crypto. Volatility is the name of the game. Without ironclad rules, even the most promising strategy can get wiped out.
Mastering risk controls is what separates the pros from the gamblers. Here are the three pillars of risk management.
In regular trading, you set a stop-loss at a specific price. In pair trading, your stop is based on the behavior of the spread. This is your first and most important line of defense. You must define your "point of no return" before entering a trade.
Here are two types of stops to use:
These rules have to be mechanical and non-negotiable.
The single biggest threat to any pair trader is the structural break. This is when the fundamental relationship holding your two assets together doesn't just bend—it shatters completely. The invisible leash connecting them snaps.
A structural break means the spread is never going back to its average. What you thought was a temporary detour is now the new reality. If you don't have a stop-loss, a manageable loss can spiral into an account-ending disaster.
What causes this? A major protocol hack, a sudden regulatory crackdown that only hits one asset, or a new piece of tech that makes one of the tokens obsolete. Your stop-loss is your only real defense against these black swan events.
How much you bet on a single trade is just as critical as your entry and exit points. A solid rule of thumb is to risk no more than 1-2% of your total trading capital on any single trade. This discipline ensures that a string of losses stings, but it doesn't knock you out of the game. For a deeper dive, check out our guide on position sizing for high-volatility trades.
Beyond that, don't put all your chips on one pair. Diversify by trading multiple, uncorrelated pairs at the same time. If you're trading an ETH/WSTETH pair, maybe add something completely different from the Solana ecosystem. This spreads out your risk, so if one pair's relationship implodes, it doesn't take your entire portfolio down with it.
When done right, these strategies can be incredibly robust. For instance, recent deep learning trading findings showed an enhanced pair trading model achieving a 71.68% win rate over nearly eight years of brutal crypto market swings.
Diving into pair trading cryptocurrency can feel a little different from your standard spot trading, so it's natural to have a few questions. The strategy has its own quirks, and getting a handle on them is what separates the winners from the rest. Here are some straightforward answers to the most common questions I hear from traders just starting out.
The most robust pairs—the ones you can really rely on—almost always share a deep, fundamental link. Just picking two assets because their charts look similar for a week is a surefire way to get burned.
The best candidates usually fall into a few key buckets:
You can actually get started with less money than you think. With the rise of low-fee networks like Solana and Ethereum Layer-2s, crazy high gas fees aren't the barrier they used to be. On these platforms, you can absolutely get your feet wet with just a few hundred dollars.
The real key isn't how much you start with; it’s your position sizing.
There's a golden rule in trading: never risk more than 1-2% of your total capital on a single trade. Following this rule means a bad run of trades won’t knock you out of the game. It gives you the staying power to let your strategy's edge actually work.
A small account managed with discipline will always beat a large, reckless one in the long run.
Yes, you can! And honestly, this is one of the biggest perks of pair trading in DeFi. You can create a market-neutral position without needing to mess with traditional shorting, which is often a huge headache or just flat-out unavailable for most crypto assets. The process is much simpler—it's often just a basic swap.
Let's say your numbers tell you Solana (SOL) is looking a bit rich compared to Ethereum (ETH). You don't have to find a platform to formally short SOL. You can just sell your SOL and roll the funds into ETH. You're making the same bet on their relative value—that the ETH/SOL ratio will go up—but without all the complexity.
It’s even simpler with liquid staking pairs. If you think the WSTETH/ETH spread has gotten too wide and is due to snap back, you can execute that whole trade in a single click on a DEX, swapping the overvalued one for the undervalued one. Tools like Wallet Finder.ai are perfect for watching how top traders pull off these "synthetic" shorts with simple, efficient swaps.
Everyone loves the idea of market-neutral profits, but a lot of new traders trip over the same few costly mistakes. Just knowing what these pitfalls are is half the battle.
Here are the four most common blunders to keep on your radar:
Ready to stop guessing and start seeing what the smartest traders are doing? With Wallet Finder.ai, you can uncover elite wallets, analyze their exact pair trading strategies, and get real-time alerts to mirror their moves. Start your free trial today and turn on-chain data into your unfair advantage.

A premier DeFi analytics platform empowering traders to discover and analyze profitable blockchain wallets, trades and tokens.

