
Recovery Factor Calculation for Smart Traders
Master the recovery factor calculation to measure a strategy's resilience. Learn the formula, see DeFi examples, and find top wallets with Wallet Finder.ai.

June 20, 2026


Wallet Finder
March 18, 2026

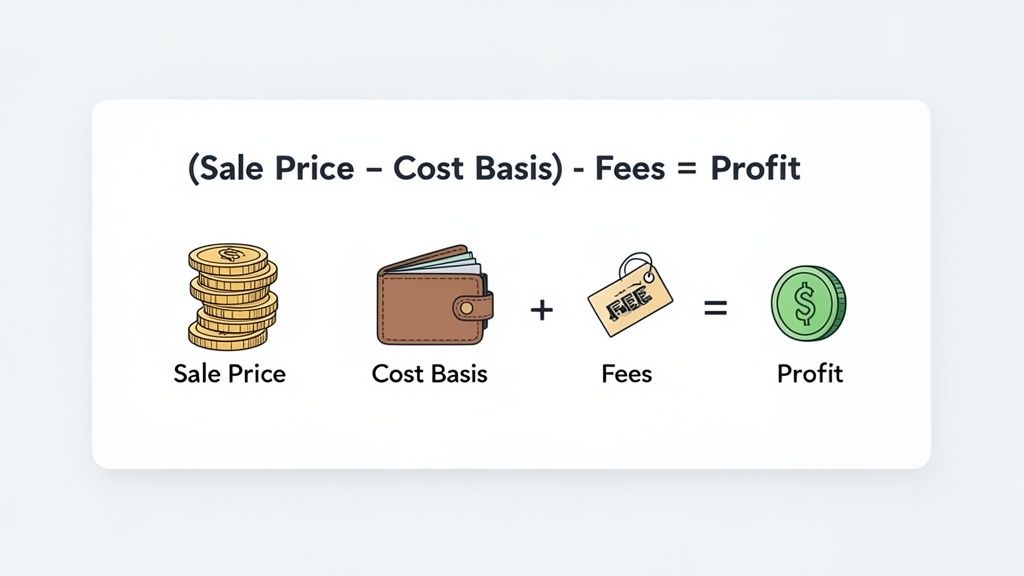
At first glance, the formula for calculating crypto profit looks simple: (Sale Price - Cost Basis) - Fees = Profit. This equation is the foundation for understanding your portfolio's true performance. But its simplicity is deceiving; the real challenge lies in accurately determining the cost basis and accounting for every single fee.
Mastering this is the first step to accurate, tax-friendly crypto accounting.
On the surface, it’s basic math. You take what you sold an asset for and subtract what you paid for it. However, the fast-moving, decentralized world of DeFi adds layers of complexity that can trip up even experienced traders.
Every transaction matters. Whether it's a straightforward buy on a centralized exchange or a complex swap on a DEX, it must be tracked. A single missed fee or miscalculated cost can throw off your entire P&L statement.
Understanding the difference between realized and unrealized profit is non-negotiable for smart portfolio management and tax compliance.
Here is an actionable breakdown:
Let's say you buy 1 ETH for $2,000. A few months later, the price shoots up to $3,000. At that moment, you have a $1,000 unrealized profit. That profit only becomes realized when you sell or trade that ETH for USD, another token, or an NFT.
Key takeaway: You don't pay taxes on gains until you realize them. An asset can 10x in value, but as long as you HODL, that profit is just on paper and isn't a taxable event in most jurisdictions.
This distinction is why the term "HODL" (Hold On for Dear Life) is so prevalent. Long-term investors often delay realizing profits to defer tax obligations until a more strategic time.
This table provides a clear, actionable comparison to help you manage your portfolio and tax liabilities effectively.
This table shows why the distinction is critical: one impacts your tax bill, and the other is simply a measure of your portfolio's potential.
In traditional finance, your stockbroker sends a tidy annual statement with all costs and proceeds calculated for you. In DeFi, you are the broker and the accountant. Precise, personal tracking isn't just good practice; it's essential.
The core formula—(Sale Price - Cost Basis) - Fees—requires three perfectly accurate numbers. The sale price is usually clear, but calculating the true cost basis and accounting for every fee is where most people go wrong. The following sections will break down how to master these components for spot-on profit calculations.
The basic profit formula is a starting point, but the real work—and accuracy—is in the details. The two areas where most traders trip up are cost basis and fees. Get these wrong, and a trade that looked profitable on paper can quickly become a mediocre win or even an unexpected loss.
Your cost basis is the total price you paid to acquire an asset, including the purchase price plus any transaction fees. It's the "Cost" in your P&L equation and the benchmark for all future gains or losses.
But what if you've been dollar-cost averaging into a token, buying at different times and prices? How do you determine your cost basis when you sell only a portion of your holdings? This requires a clear accounting method.
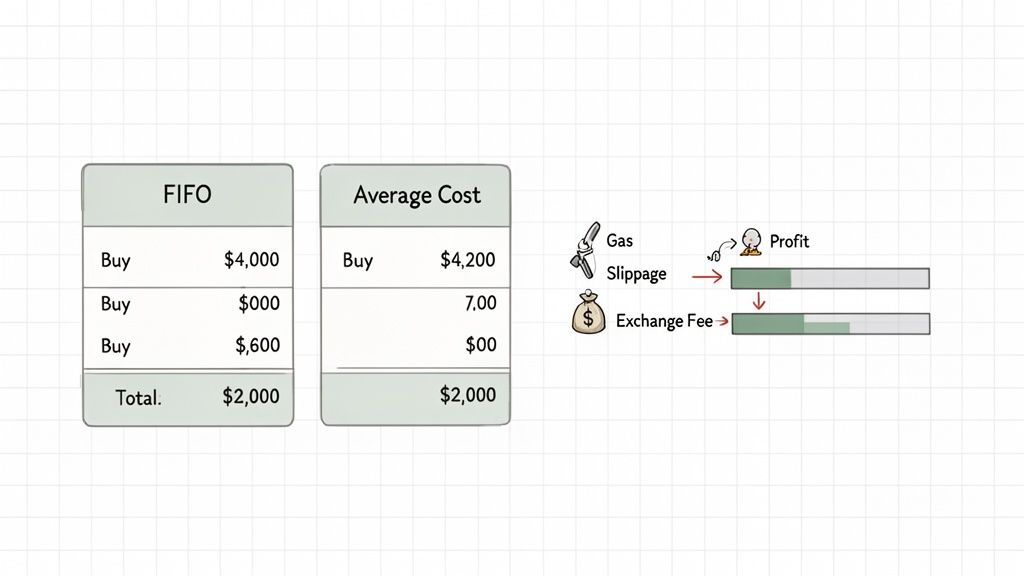
The accounting method you choose can dramatically alter your reported profit, directly impacting your tax liability. The two most common methods are First-In, First-Out (FIFO) and Average Cost.
Let's run through a practical example. Say you bought 1 ETH at $2,000 and another 1 ETH later at $4,000. The market is now at $3,500, and you decide to sell 1 ETH.
As you can see, your choice has a real financial impact. FIFO is often easier to track manually, while the Average Cost method can smooth out volatility. The key is to pick a method and use it consistently.
Beyond your initial cost, a swarm of fees is waiting to reduce your returns. Ignoring them is the fastest way to get an inaccurate picture of your profitability.
The real profit calculation looks more like this: PnL = (Current Value - Cost Basis) - Fees - Taxes. We all hear about Bitcoin's legendary returns—its ROI hit an incredible 1.5 million percent over 14 years. But the investors who captured those gains were the ones who meticulously tracked every cost. Forgetting about taxes of up to 37% on short-term gains or transaction fees would have massively cut into the net profit from bull runs, like Bitcoin's 156% jump in 2023.
Trader's Tip: Always treat fees as part of your cost basis when you buy, and as a reduction from your proceeds when you sell. This way, you'll never forget to account for them in your final P&L.
To avoid flying blind, you must track these common expenses:
A trade can look great on the surface. Buying a token for $1,000 and selling it for $1,100 seems like an easy $100 profit. But if you paid $30 in gas to buy, $40 in gas to sell, and lost $15 to slippage, your actual net profit is just $15. Mastering these details is what separates pros from amateurs.
Simple buy-and-sell trades are one thing; DeFi is a different beast entirely.
Calculating crypto profit in DeFi involves staking rewards, airdrops, and liquidity pools, which make basic formulas feel inadequate. Let's break down how to handle these situations.
Tracking DeFi profit requires a systematic approach to manage the constant flow of transactions, rewards, and fees across multiple protocols and blockchains.
Treat staking rewards and airdrops as new assets. The key to calculating profit on them is to establish the correct cost basis the moment they arrive in your wallet.
For tax purposes in most jurisdictions, income from staking and airdrops is recognized at the fair market value of the tokens on the day you receive them. That market value becomes their cost basis.
Pro Tip: Keep a meticulous log of the date and market price for every reward or airdrop. A spreadsheet can work, but an automated tool like Wallet Finder.ai can save you significant time and prevent errors.
This method ensures that when you sell, you only pay capital gains tax on the appreciation since you took ownership.
Providing liquidity is a core DeFi activity, but it introduces a unique concept called Impermanent Loss (IL). IL isn't a realized loss but an opportunity cost—the value difference between holding two assets in a liquidity pool versus simply holding them in your wallet.
Impermanent loss occurs when the price ratio of the two tokens in the pool changes. The more their prices diverge, the greater the IL.
To accurately calculate profit from a liquidity pool (LP) position, you must account for three things:
Let's walk through a simplified scenario to see it in action.
In this case, the impermanent loss is $102. However, if you earned $150 in trading fees while in the pool, your net profit from the LP position would be $48 ($150 fees - $102 IL). This shows why LP profit calculation is not a simple P&L formula. For a deeper look, learn more about how crypto liquidity pools work in our detailed guide.
DeFi operates across multiple chains like Ethereum, Solana, and Base. Smart money moves assets between them using bridges to chase yield or find new opportunities, adding another layer of tracking complexity.
When you bridge an asset, you are not selling it; it's a transfer. Your cost basis for that asset remains unchanged. The primary cost to track here is the bridge fee.
For example, if you bridge 1 ETH from Ethereum to Base:
The goal is to maintain a unified view of your portfolio, regardless of where your assets are. A proper P&L dashboard follows an asset's journey—and its associated costs—from its initial purchase on one network to its final sale on another, providing one true profitability number for your entire portfolio.
Knowing the formulas is one thing; applying them to the chaotic reality of DeFi is another. Let's walk through a few real-world examples to demonstrate how these profit calculations play out.
These breakdowns will account for every fee, value change, and on-chain cost to uncover the true net profit or loss.
This is the most fundamental trade. Let's say you buy Chainlink (LINK) on a centralized exchange, hold it, and sell it a few months later.
The profit calculation is straightforward: Net Sale Proceeds - Total Cost Basis = Realized Profit.
For this trade, that's $998 - $701.40 = $296.60 Net Profit.
Now for a more complex DeFi scenario: flipping a new memecoin on the Base network. This involves swapping ETH for the token on a DEX like Uniswap, which introduces gas fees and potential slippage.
Keeping a close eye on these on-chain costs is non-negotiable for an accurate P&L. As the diagram below shows, your DeFi profit picture is often bigger than just a single trade.
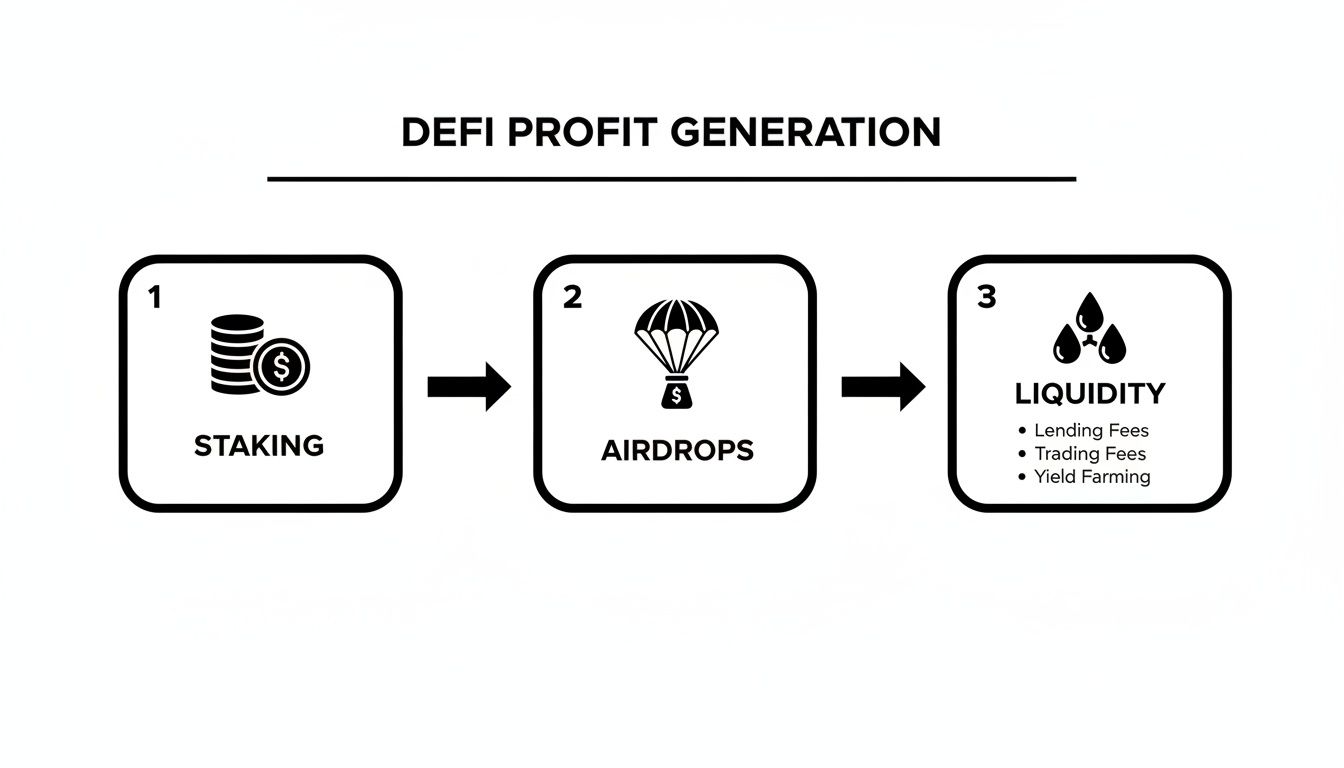
This flow highlights that real DeFi profit is an ecosystem. Staking rewards, airdrops, and liquidity fees all contribute to your bottom line, and each needs to be tracked.
Let's break down a typical memecoin flip.
The table below provides a step-by-step look at a realistic memecoin trade, accounting for all the small costs that eat into your gains.
Now, let's tally up the costs and subtract them from the final sale value to find our profit.
If we hadn't tracked the $40 in total gas fees, we would have overestimated our profit by nearly 6%. Those small fees add up quickly.
Let's tackle a liquidity position. You provide 1 ETH and $2,000 USDC to a liquidity pool and withdraw after 90 days.
This situation requires accounting for both impermanent loss and the trading fees earned.
Key Insight: A liquidity position's profitability comes down to a simple question: did the trading fees you earned outweigh the impermanent loss you experienced?
The final profit calculation is Fees Earned - Impermanent Loss.
In this scenario, that's $150 - $29 = $121 Net Profit. The position was profitable because the fees more than covered the impermanent loss. This underscores how vital precise calculations are. Think about Bitcoin's mind-boggling 30,203% return in 2010—only the traders who obsessively tracked every single fee captured those gains. You can read more about Bitcoin’s wild price journey to see why this level of detail has always mattered.
Manually tracking hundreds of DeFi transactions across different wallets and chains in a spreadsheet is tedious and prone to costly errors. After digging into the complexities of cost basis, fees, and DeFi scenarios, it's clear a manual approach doesn't scale.
Stop fighting with spreadsheets and start making smarter, data-driven decisions.
Wallet Finder AI was built to solve this exact problem. Instead of you chasing down transaction hashes and hunting for gas fee records, the platform automatically syncs with your wallets. It pulls your entire on-chain history into one clean dashboard, giving you a crystal-clear picture of your actual performance.
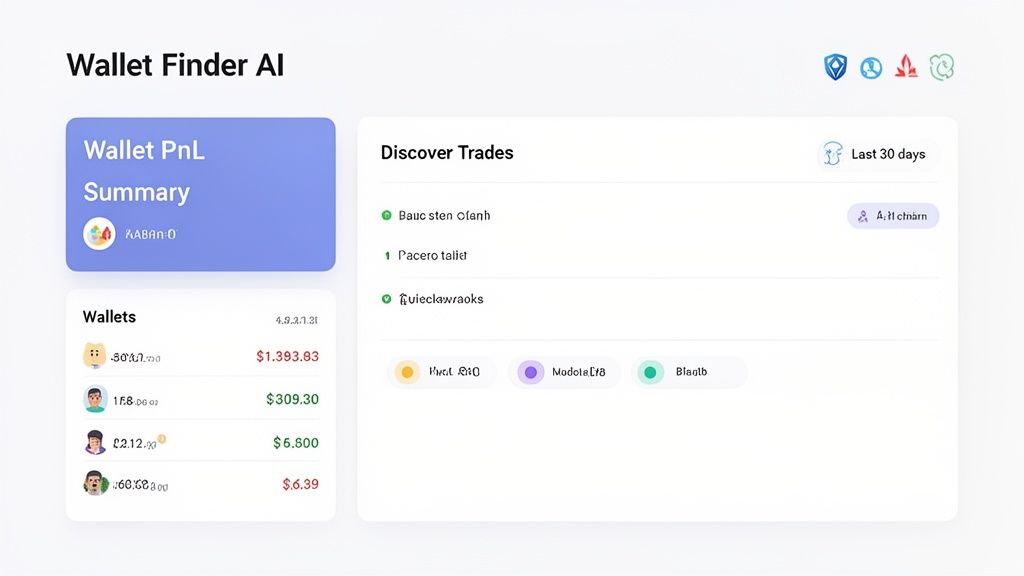
The main dashboard instantly visualizes a wallet's total profit and loss, current holdings, and latest trades. The platform transforms a messy web of transactions into a simple financial summary, making the process of calculating crypto profit practically effortless.
Forget fumbling with complex formulas. Wallet Finder AI provides tools designed for immediate clarity, turning raw blockchain data into actionable insights.
This automation frees you from the soul-crushing admin work of P&L tracking, allowing you to focus on what matters: finding your next winning trade. See a more detailed walkthrough in our complete guide to DeFi PnL tracking.
Trader Takeaway: Consistent profits aren't just about making good trades—they're about knowing the exact financial outcome of every move. Automated tracking eliminates guesswork, revealing which strategies work and which are silently bleeding capital.
A complete transaction history is great, but the real edge comes from slicing and dicing that data. Wallet Finder AI includes powerful filtering and export functions to help you sharpen your strategies and simplify tax reporting.
Historical data shows Bitcoin's monthly returns were positive only 56% of the time between 2011 and 2026, making consistent profit tracking crucial. For DeFi traders, this stat highlights the need for consistency over moonshots.
It's no surprise that top Ethereum wallets we track have 70% win rates—they do it by filtering for trades with a 30-day ROI over 50%. By analyzing winning wallets on Base, you can see how many averaged 3x returns on new tokens by getting in under $0.01 and taking profit within 48 hours. This is how pros compound growth: by studying winning patterns and avoiding losing ones.
The tools inside Wallet Finder AI are built for this kind of deep-dive analysis.
By automating everything from data collection to final analysis, Wallet Finder AI turns the daunting task of calculating crypto profit into a seamless, insightful, and powerful strategic advantage.
Mathematical precision and artificial intelligence transform crypto profit calculation from reactive accounting into proactive strategy optimization. While basic profit formulas serve everyday trading needs, sophisticated frameworks enable professional traders to maximize returns while minimizing exposure to market volatility. These advanced approaches combine statistical modeling, machine learning algorithms, and predictive analytics to create comprehensive profit optimization systems.
Modern trading operations rely on mathematical rigor and AI-driven insights to evaluate performance, validate strategies, and predict future profit potential. These frameworks extend far beyond simple buy-sell calculations, incorporating complex statistical distributions, correlation analysis, portfolio optimization theory, and neural network predictions. The mathematical models developed for traditional finance adapt remarkably well to crypto markets, enhanced by machine learning capabilities that continuously improve accuracy and adapt to changing conditions.
Modern Portfolio Theory provides a mathematical framework for optimizing crypto profit through strategic asset allocation. The core principle involves maximizing expected returns for a given level of risk, using statistical measures of correlation and variance. In crypto markets, this mathematical approach proves especially valuable due to the diverse range of uncorrelated assets available across different blockchains and use cases.
The fundamental optimization equation balances expected returns against portfolio variance through the efficient frontier calculation. For a portfolio of crypto assets, the expected return equals the weighted sum of individual asset returns, while portfolio variance incorporates both individual asset volatility and cross-correlation coefficients. Mathematical optimization seeks the allocation weights that maximize the Sharpe ratio, defined as excess return per unit of risk.
Practical implementation begins with historical return data collection across chosen crypto assets, typically using daily or weekly price changes over 252 trading periods to capture annual volatility patterns. Correlation matrix construction reveals the statistical relationships between different cryptocurrencies, DeFi tokens, and layer-1 protocols. Assets with correlation coefficients below 0.3 provide meaningful diversification benefits, while those above 0.7 offer limited portfolio optimization value.
Research indicates that mathematically optimized crypto portfolios consistently outperform equal-weight allocations by 15-25% annually when properly rebalanced. Advanced practitioners employ Black-Litterman optimization to incorporate forward-looking market views into the mathematical framework, adjusting expected returns based on specific insights about upcoming protocol upgrades or regulatory developments.
Rigorous statistical analysis distinguishes between genuine alpha generation and random market luck. Professional crypto traders employ hypothesis testing, confidence intervals, and statistical significance measures to validate their profit generation capabilities. The t-test framework evaluates whether average trading profits exceed expected market returns with statistical significance, with successful strategies typically achieving t-statistics above 2.0 with p-values below 0.05.
Value-at-Risk mathematical modeling quantifies potential losses under adverse market conditions, providing essential risk management insights for crypto profit optimization. VaR calculations employ statistical distributions to estimate maximum expected losses at specified confidence levels, typically 95% or 99% probability thresholds. These mathematical frameworks prove especially critical in crypto markets due to extreme volatility and tail risk events.
Monte Carlo VaR simulation provides robust mathematical modeling through random sampling techniques, generating thousands of potential portfolio outcomes using historical return distributions, correlation patterns, and volatility clustering characteristics. Mathematical algorithms simulate various market scenarios, including extreme events and correlation breakdowns, producing more reliable risk estimates than parametric methods.
Conditional Value-at-Risk extends traditional VaR analysis by quantifying expected losses beyond the VaR threshold, providing crucial insight into tail risk characteristics. CVaR calculation averages all portfolio losses exceeding the VaR cutoff, revealing the severity of worst-case scenarios. Research demonstrates that crypto portfolios with CVaR optimization achieve 20-30% better risk-adjusted returns than VaR-only approaches.
Mathematical modeling of statistical arbitrage opportunities across different blockchain networks reveals systematic profit potential through mean reversion and correlation trading strategies. Pairs trading frameworks identify statistically related cryptocurrency pairs that occasionally deviate from their historical price relationships. Cointegration testing employs Augmented Dickey-Fuller statistics to verify long-term statistical relationships, with successful pairs typically exhibiting test statistics below -3.5.
Cross-exchange arbitrage modeling employs statistical analysis to identify price differences for identical crypto assets across different trading venues, calculating transaction costs, slippage impact, and execution timing to determine net arbitrage profit potential. Mathematical analysis indicates that triangular arbitrage opportunities in liquid crypto markets typically last 15-30 seconds, requiring automated execution systems for profitable implementation.
Advanced machine learning algorithms transform historical trading data into accurate profit prediction systems. Supervised learning models train on extensive datasets of past trades, market conditions, and resulting outcomes to predict future profitability with remarkable accuracy. These AI systems identify complex patterns in market behavior that traditional statistical analysis often overlooks, providing traders with significant competitive advantages.
Random Forest algorithms prove particularly effective for crypto profit prediction due to their ability to handle non-linear relationships and feature interactions. These ensemble methods combine hundreds of decision trees to generate robust predictions while avoiding overfitting to historical data. Training datasets typically include price movements, volume patterns, volatility measures, and technical indicators across multiple timeframes, enabling models to capture both short-term opportunities and longer-term trends.
Neural network architectures designed specifically for financial time series analysis excel at identifying subtle patterns in crypto market data. Long Short-Term Memory networks process sequential price and volume information to predict future profit potential, while Convolutional Neural Networks analyze chart patterns and technical formations. Research indicates that properly trained LSTM models achieve 65-70% accuracy in predicting profitable trade directions over various timeframes.
Gradient boosting frameworks like XGBoost and LightGBM deliver exceptional performance in crypto profit prediction tasks through iterative model improvement techniques. These algorithms sequentially build prediction models, with each iteration focusing on correcting errors from previous models. Feature engineering proves critical for optimal performance, incorporating technical indicators, market microstructure variables, and sentiment metrics derived from social media and news sources.
Support Vector Machine algorithms excel at identifying optimal profit-taking and stop-loss levels by analyzing historical trade outcomes under similar market conditions. SVM models classify market states and recommend appropriate exit strategies based on learned patterns from successful trades. Cross-validation techniques ensure model robustness, with successful implementations achieving 15-20% improvement in risk-adjusted returns compared to static profit-taking rules.
Deep learning architectures revolutionize crypto profit optimization by automatically discovering complex market patterns without human feature engineering. Convolutional neural networks prove especially powerful for analyzing price charts and identifying technical patterns that correlate with profitable outcomes, while attention mechanisms in transformer architectures enable AI systems to focus on the most relevant market information when making profit predictions.
Generative Adversarial Networks create sophisticated market simulation environments for testing profit optimization strategies. The generator network creates realistic market scenarios while the discriminator network evaluates their authenticity, resulting in highly realistic market simulations for strategy testing. These AI systems enable comprehensive backtesting under thousands of simulated market conditions, improving confidence in profit prediction accuracy.
Reinforcement learning algorithms transform crypto trading into autonomous profit optimization systems that continuously learn and improve performance through interaction with live markets. These AI agents develop optimal trading strategies by receiving rewards for profitable actions and penalties for losses, gradually learning to maximize long-term profitability rather than short-term gains.
Q-Learning implementations for crypto trading employ value function approximation to estimate the expected future rewards of different trading actions under various market states. State representations typically include technical indicators, market sentiment metrics, and portfolio positions, while action spaces encompass buy, sell, and hold decisions along with position sizing parameters. Successful Q-learning agents achieve consistent profitability by learning to balance risk and reward over extended time horizons.
Deep Q-Network architectures combine the pattern recognition capabilities of deep neural networks with the decision-making framework of reinforcement learning. These systems process high-dimensional market state information through convolutional and recurrent layers while learning optimal action selection through trial-and-error interaction with historical or simulated market data.
Natural Language Processing algorithms extract valuable profit-relevant insights from social media, news articles, regulatory announcements, and technical documentation across the crypto ecosystem. These AI systems process unstructured text data to identify sentiment trends, market catalysts, and potential profit opportunities that traditional technical analysis might overlook.
Transformer-based language models like BERT and GPT architectures excel at understanding context and nuance in crypto-related text content. Fine-tuning these models on crypto-specific datasets enables accurate sentiment classification and event detection that correlates strongly with future price movements and profit opportunities. Topic modeling algorithms identify emerging themes and trends in crypto discussions that often precede significant market movements.
Real-time sentiment scoring systems process streaming social media and news feeds to generate dynamic sentiment indicators for individual cryptocurrencies and DeFi protocols. Machine learning algorithms weight sentiment sources based on historical correlation with price movements, improving signal quality and reducing noise from irrelevant or manipulated content. These systems typically achieve 60-65% accuracy in predicting short-term price direction based on sentiment alone.
AI-driven algorithmic optimization continuously refines trading strategies based on changing market conditions and performance feedback. Genetic algorithms evolve trading strategies through simulated natural selection processes, combining successful strategy components while discarding underperforming elements. Population-based optimization explores vast strategy spaces more effectively than traditional parameter sweeping, discovering novel approaches that human traders might never consider.
Bayesian optimization frameworks efficiently search parameter spaces for optimal trading strategy configurations using probabilistic models to guide exploration. AutoML platforms automatically discover optimal feature engineering, model selection, and hyperparameter configurations for crypto profit prediction tasks, reducing the expertise requirements for implementing sophisticated AI-driven trading strategies.
Meta-learning algorithms enable AI systems to quickly adapt to new market conditions or asset classes by leveraging knowledge gained from previous learning experiences. These approaches prove especially valuable in crypto markets where new protocols, tokens, and trading venues continuously emerge, requiring rapid adaptation of existing strategies. Few-shot learning techniques enable profitable strategy deployment with minimal historical data for new assets.
Even with the best formulas, crypto profit calculations can be tricky. This section tackles some of the most common questions and hurdles traders face.
Think of it as your quick reference for those "what if" situations. Getting these details right is the difference between having a clear picture of your portfolio's health and flying blind.
Almost always, yes. In most countries, swapping one crypto for another is a taxable event. The moment you trade ETH for a new memecoin, you've technically "disposed" of that ETH, crystallizing any capital gain or loss on it.
Tax agencies like the IRS view crypto as property, so trading it is treated like selling one asset and immediately buying another. You are required to calculate the gain or loss on the crypto you traded away.
Flipping an NFT follows the same basic formula: (Sale Price - Cost Basis) - Fees = Profit. The main difference is that "fees" can be much larger and come from multiple sources.
Your total cost basis for an NFT includes:
When you sell, subtract the gas fees for the sale plus any marketplace commission from your final sale price. The remainder, minus your total cost basis, is your net profit.
Important Note: Airdrops aren't "free money" to the taxman. They are often treated as ordinary income based on their fair market value on the day you receive them. That value becomes your cost basis. Never assume a "free" airdrop has a zero-dollar cost basis.
Failed on-chain transactions are a nuisance. While you didn't buy or sell anything, you did lose the gas fees paid for the attempt. The good news is these lost gas fees are generally considered a capital loss.
It's crucial to keep a record of these failed attempts. While one failed transaction fee might seem insignificant, they can add up over a year and impact your overall P&L.
Wrapped tokens like Wrapped ETH (WETH) or Wrapped BTC (WBTC) are simpler than they seem. Wrapping or unwrapping a token is typically not a taxable event. You are not selling your original asset; you are just changing its format to work in a DeFi protocol.
Your cost basis for the original asset (e.g., ETH) carries over directly to the wrapped version (WETH). The only new cost to track is the small gas fee you paid for the wrap or unwrap transaction. Log it as a minor asset management cost.
Statistical validation of AI profit models requires rigorous out-of-sample testing using walk-forward analysis, where models train on historical data and predict future periods they have never seen. Bootstrap confidence intervals around performance metrics help distinguish genuine predictive skill from random variation, while cross-validation techniques like time series splits prevent data leakage. Monte Carlo permutation tests establish statistical significance by comparing actual results against randomly shuffled data. Professional implementations achieve Sharpe ratios above 1.2 with p-values below 0.01, indicating robust predictive capability that extends beyond market noise and random fluctuations.
Advanced performance attribution requires decomposing returns into alpha sources, factor exposures, and interaction effects across different protocols and blockchain networks. The Fama-French multi-factor model adapts well to crypto by incorporating momentum, size, and volatility factors specific to digital assets. Information ratio analysis proves most reliable when calculated using tracking error relative to a diversified crypto benchmark rather than absolute returns. Modified Sharpe ratios using Cornish-Fisher expansion account for skewness and kurtosis in crypto return distributions, providing more accurate risk assessment for strategies with significant tail risks or asymmetric payoffs.
Machine learning models address crypto market challenges through specialized preprocessing techniques and adaptive architectures designed for high-frequency, volatile data streams. LSTM networks with attention mechanisms maintain memory of long-term patterns while adapting to sudden market regime changes, while ensemble methods combine multiple models to reduce prediction variance during volatile periods. Feature engineering incorporates volatility clustering, momentum indicators, and market microstructure variables that capture the unique characteristics of continuous trading. Advanced implementations use online learning techniques that continuously update model parameters as new data arrives, enabling real-time adaptation to changing market conditions without requiring complete retraining cycles.
AI-driven portfolio rebalancing optimizes profit extraction through dynamic allocation algorithms that respond to changing market conditions and correlation structures. Reinforcement learning agents learn optimal rebalancing frequencies by balancing transaction costs against drift from target allocations, typically discovering that crypto portfolios benefit from more frequent rebalancing than traditional assets due to higher volatility. Machine learning models predict optimal rebalancing triggers based on momentum signals, volatility regimes, and correlation breakdowns, often achieving 10-15% improvement in risk-adjusted returns compared to calendar-based rebalancing. Advanced systems incorporate transaction cost models and market impact estimates to ensure rebalancing decisions account for execution costs and slippage, maximizing net profit after all fees and market friction.
Ready to stop wrestling with spreadsheets and get instant clarity on your DeFi performance? Wallet Finder.ai automates the entire process of calculating crypto profit, from tracking fees to analyzing individual trades. Discover your true P&L today.

A premier DeFi analytics platform empowering traders to discover and analyze profitable blockchain wallets, trades and tokens.

