
Recovery Factor Calculation for Smart Traders
Master the recovery factor calculation to measure a strategy's resilience. Learn the formula, see DeFi examples, and find top wallets with Wallet Finder.ai.

June 20, 2026


Wallet Finder
June 10, 2026
Investors often lose money with buy the dip crypto because they follow a slogan, not a process.
A red candle hits. They buy because the chart looks “cheap.” Then price drops again, support breaks, panic takes over, and they either average down blindly or sell the bottom. The mistake isn't buying weakness. The mistake is buying weakness with no framework for trend, confirmation, sizing, or risk.
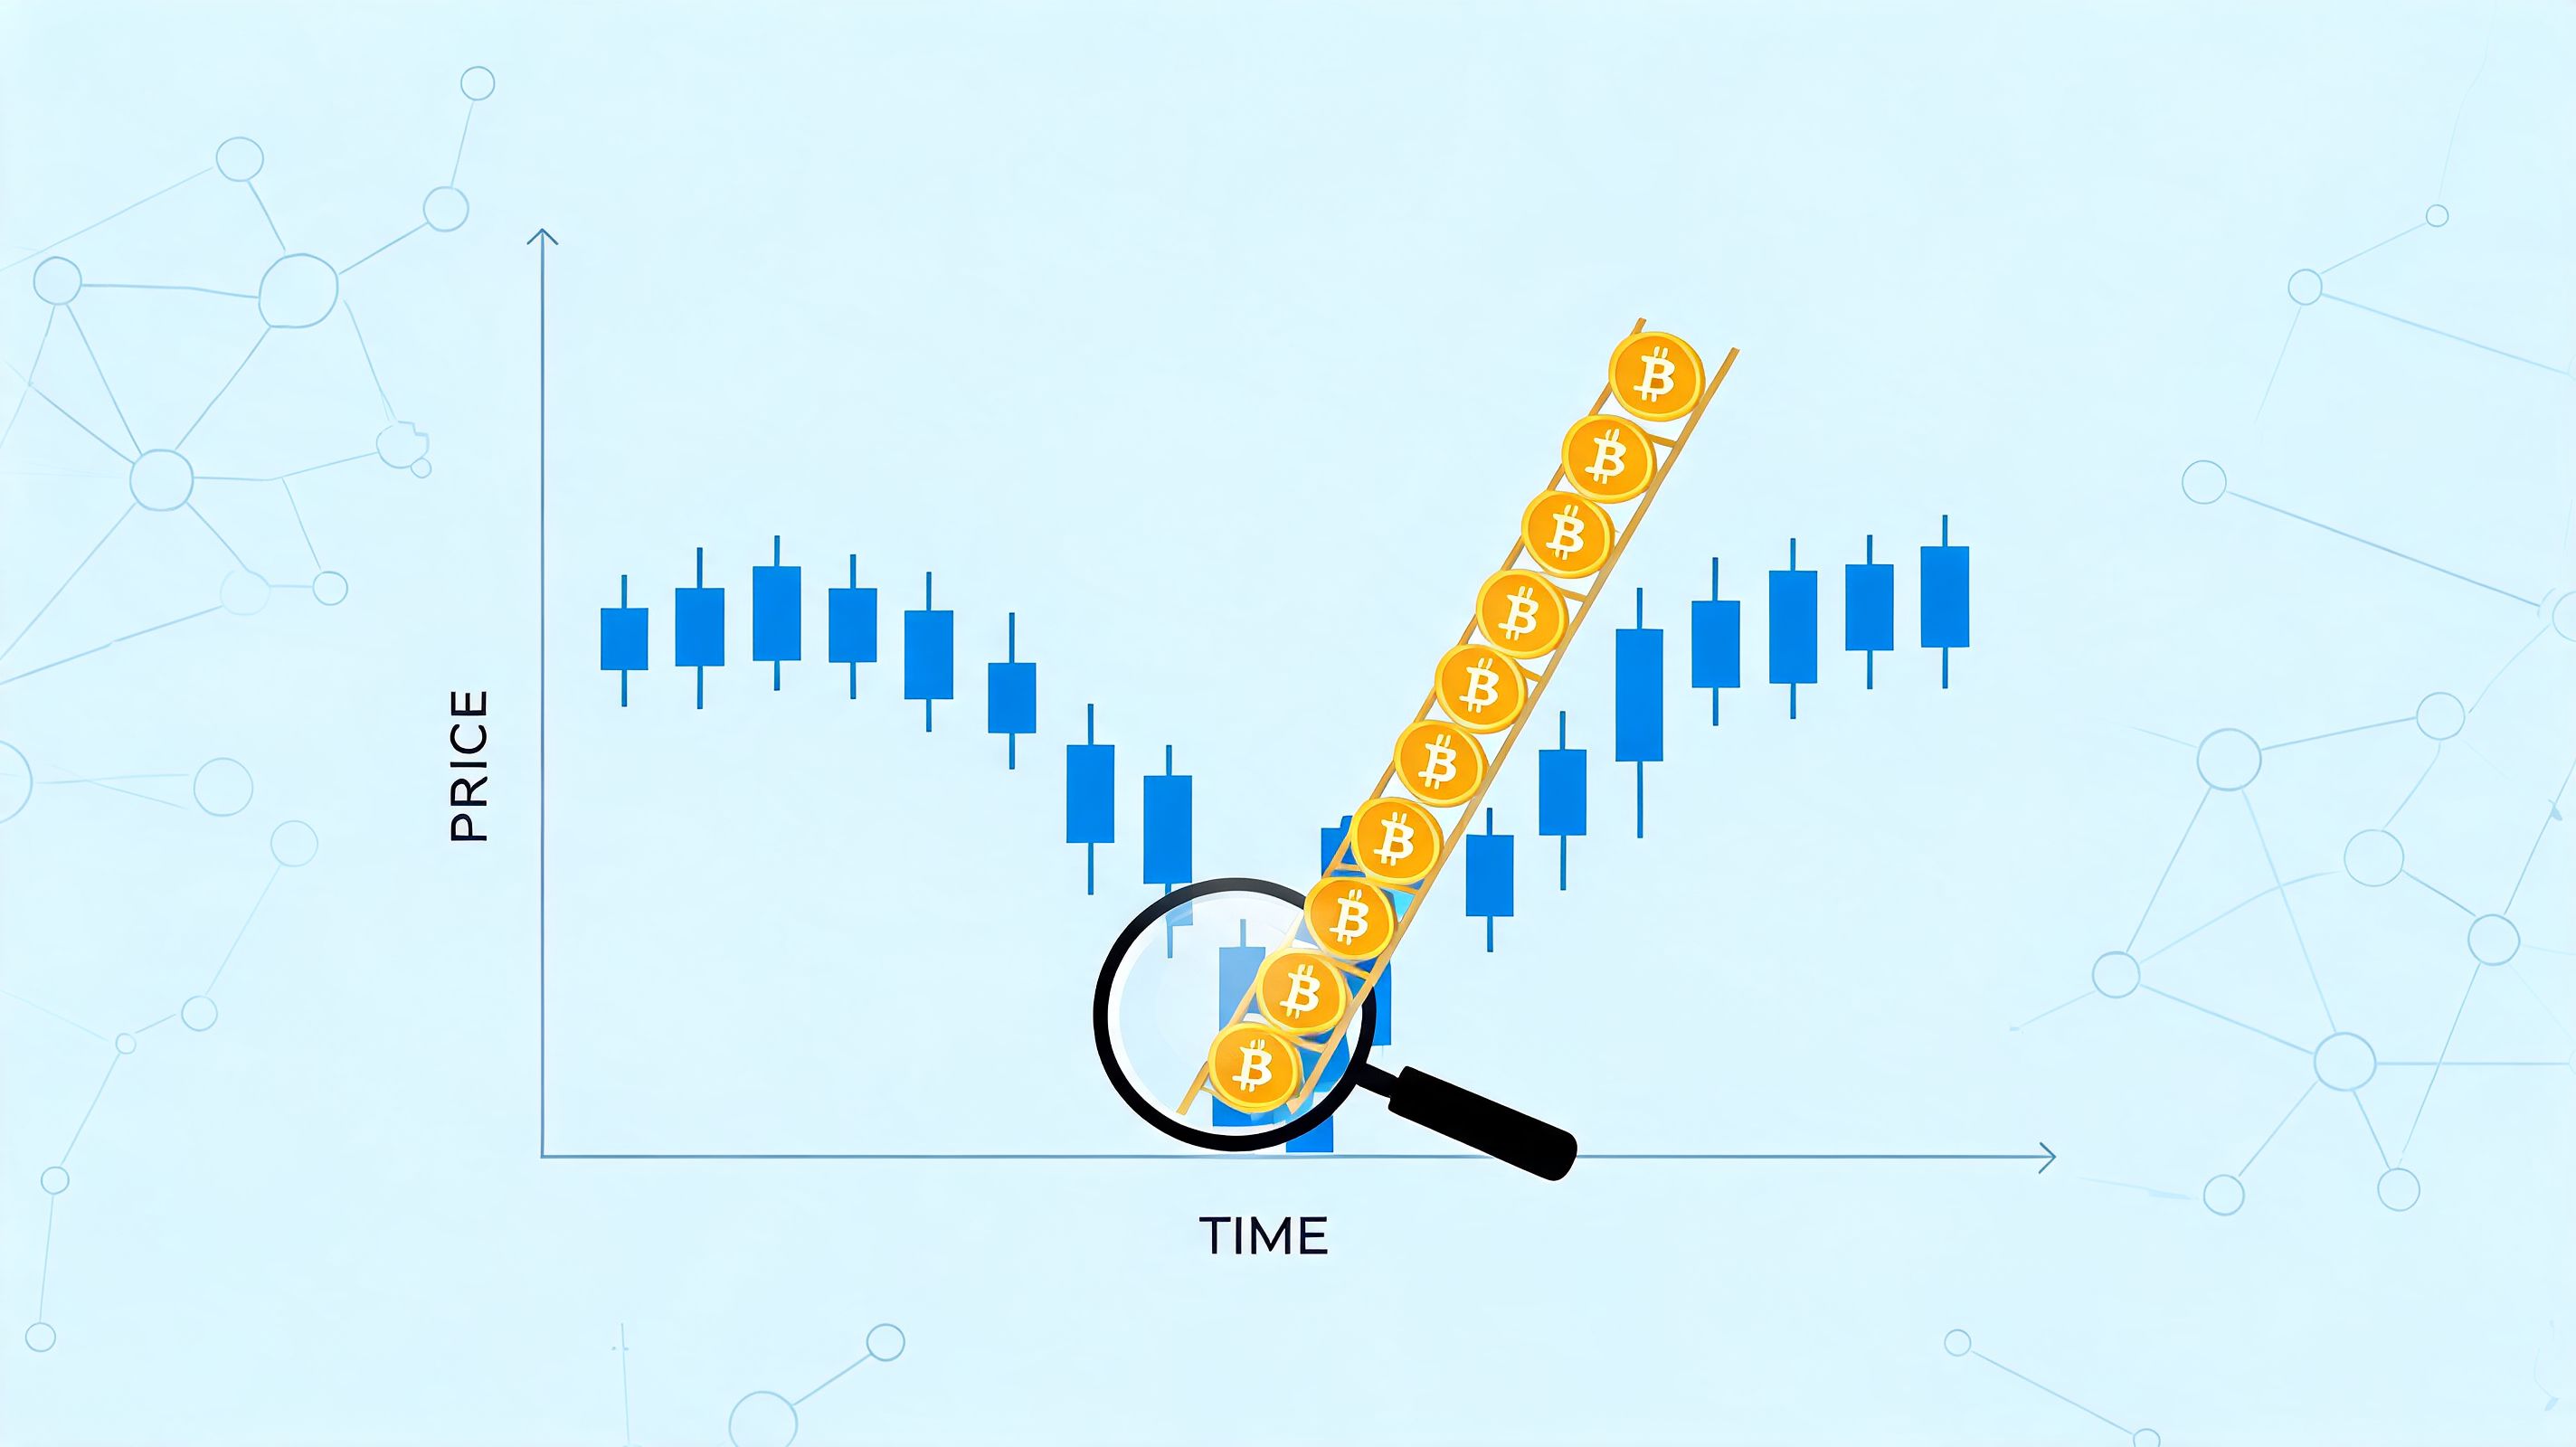
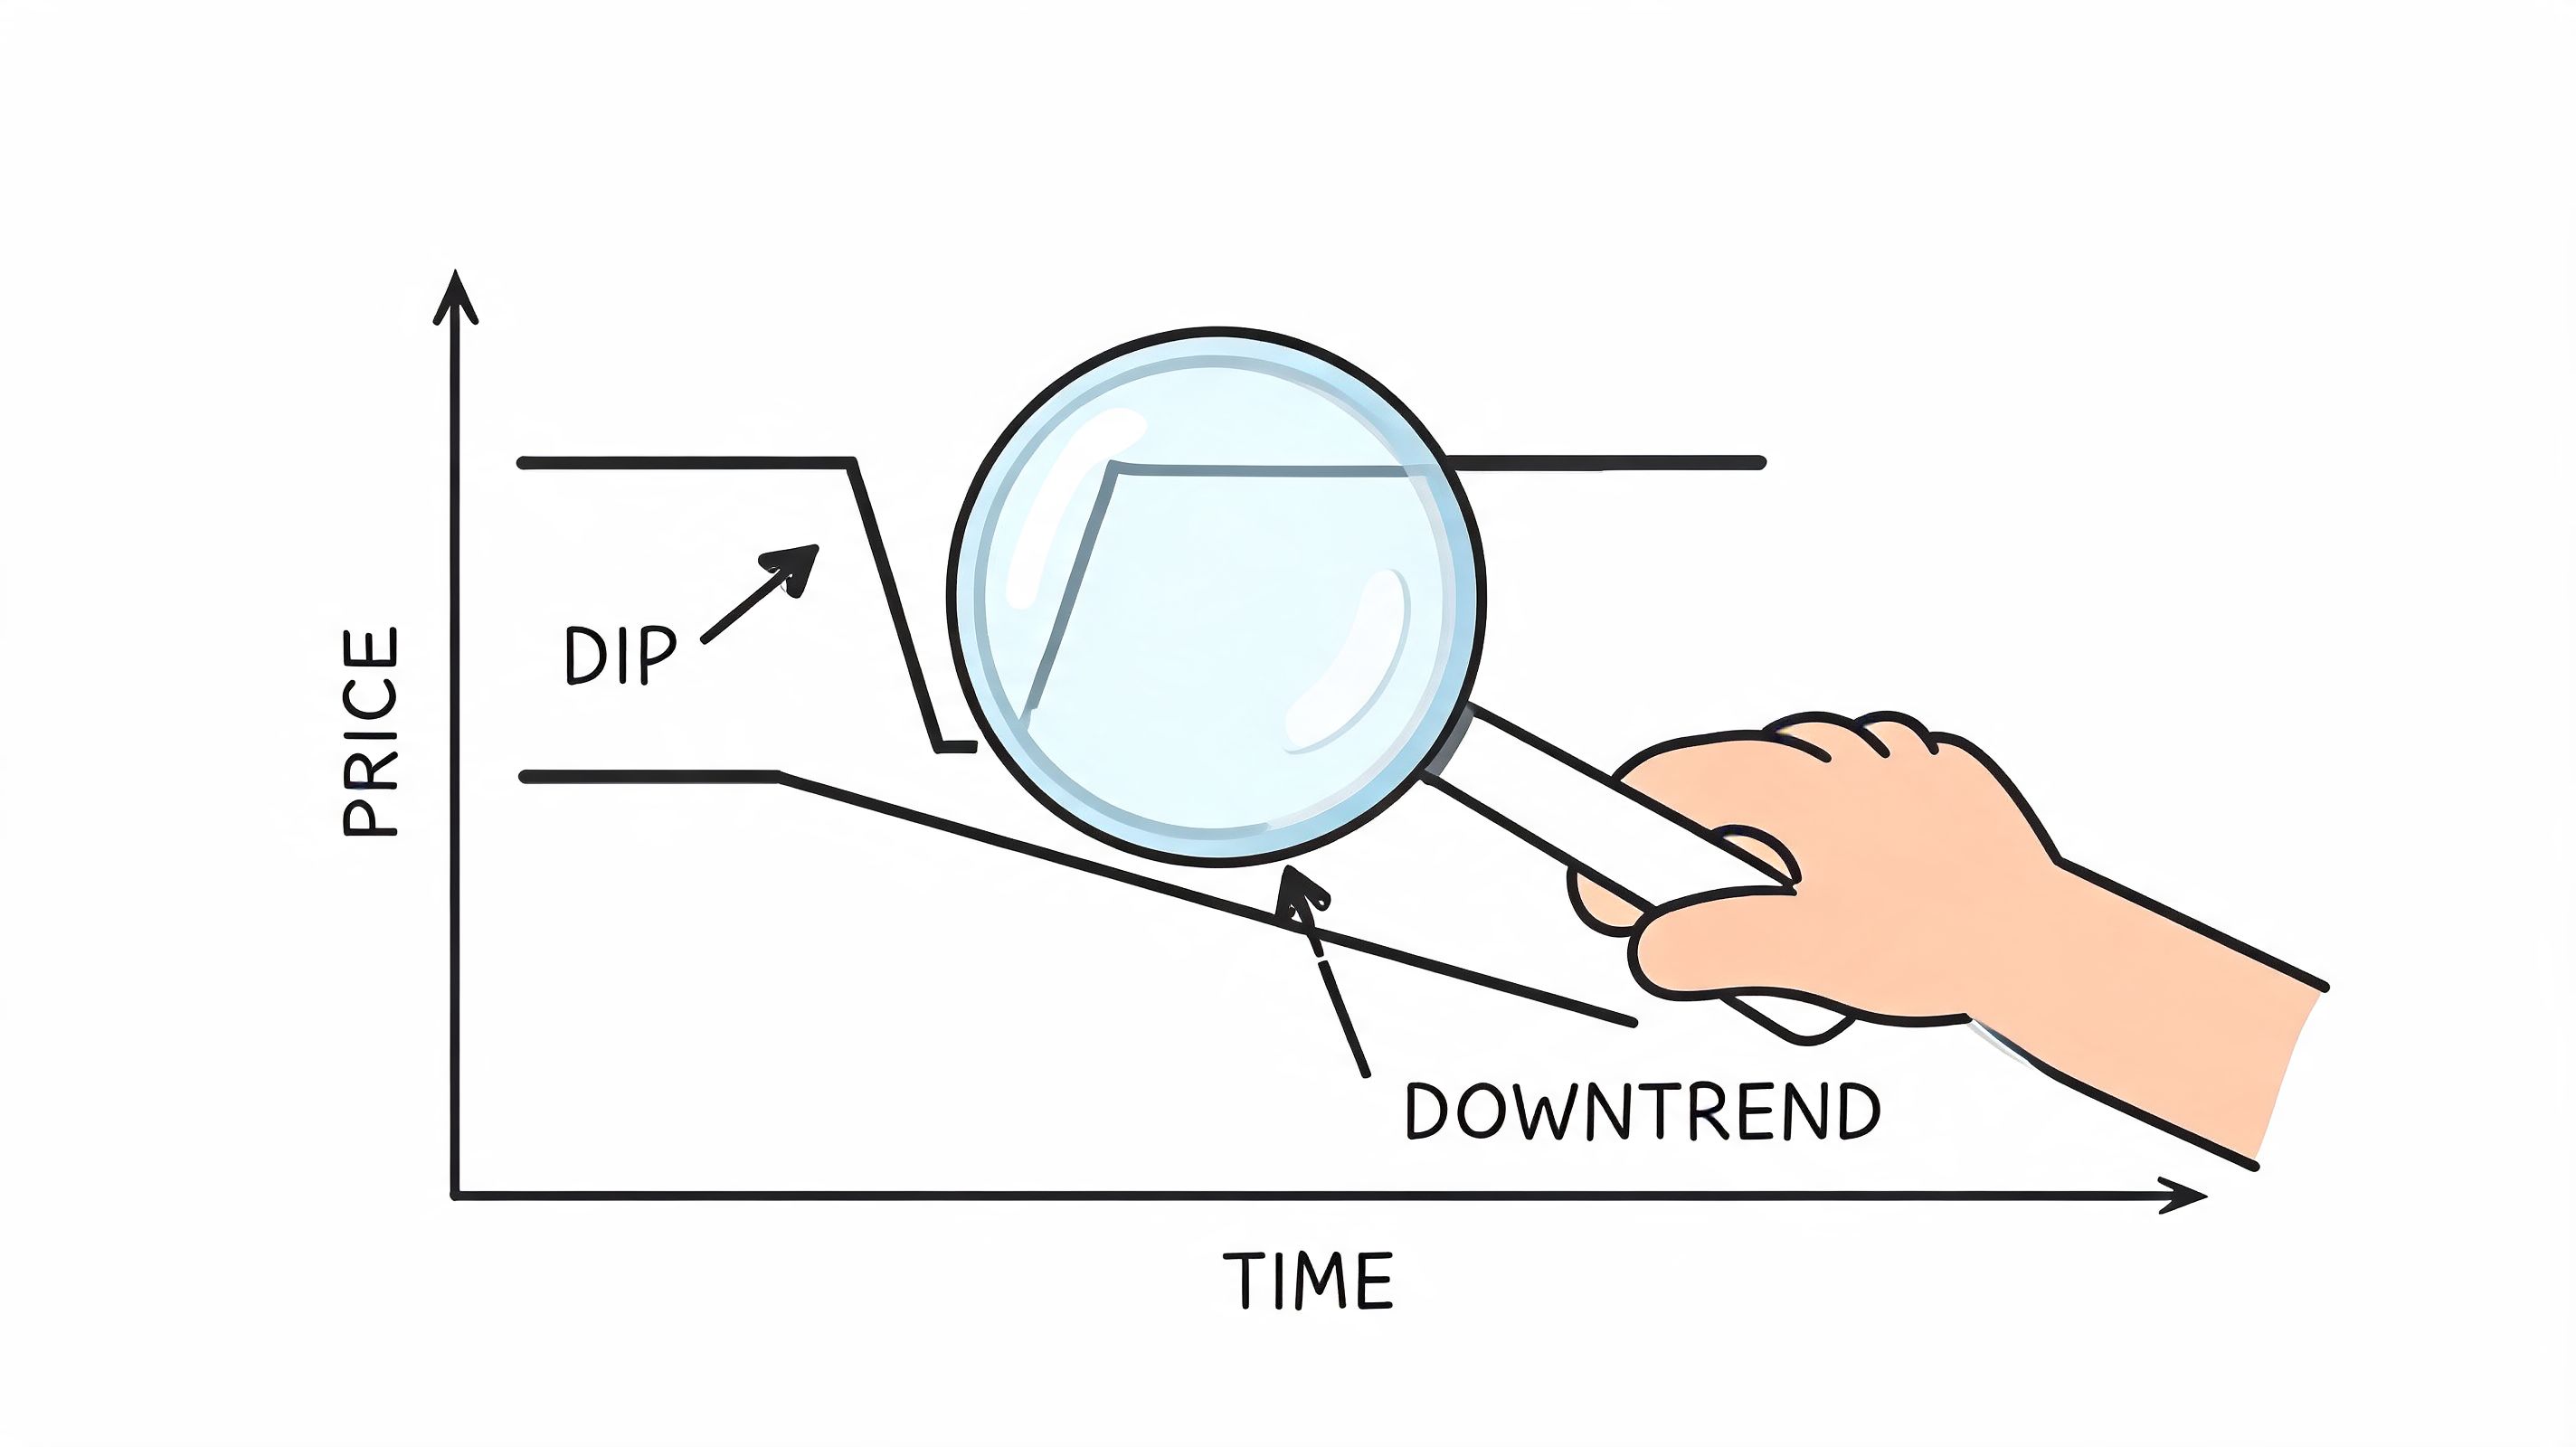
A real dip is a pullback inside a broader uptrend. A bad trade is a collapsing market dressed up as a bargain. The difference usually shows up in the same places: trend structure, momentum, support, and whether serious buyers are stepping in.
The mechanics of buying a dip in crypto have not changed. The market environment in which you apply those mechanics has — and understanding what changed in 2026 helps you calibrate how aggressively to buy support levels that would have been far more ambiguous in prior cycles.
The most significant structural change is the presence of US spot Bitcoin ETFs as a persistent institutional demand layer. Before ETF approval, Bitcoin's dip behavior was driven almost entirely by retail sentiment, futures positioning, and whale accumulation — all of which could reverse quickly and produce the deep 70-80% drawdowns that characterized the 2018 and 2022 bear markets. The ETF structure changed that dynamic because institutional buyers who access Bitcoin through a regulated wrapper typically have much longer rebalancing horizons than retail traders. When Bitcoin fell from its October 2025 all-time high above $125,000 to around $63,000 in early February 2026, ETF inflows did not reverse. They remained net positive through the drawdown, which was the observable signal that this correction had a different character than the 2022 bear market — institutional demand was absorbing selling pressure rather than amplifying it.
The practical implication for dip buyers is that the 200-day moving average in 2026 functions as a more reliably supported level than it did in prior cycles, precisely because ETF-driven institutional capital tends to treat that level as a rebalancing trigger rather than a panic exit. The February 2026 dip to approximately $63,000 reached the 200-day MA vicinity and was followed by one of the strongest single-day recoveries in recent memory, with Bitcoin reclaiming $76,000 and eventually pushing higher. Traders who understood the ETF support structure — and who had pre-planned limit orders at the 200-day MA zone — entered one of the cleanest dip setups the current cycle produced.
The ETF demand floor makes certain levels more reliable supports, but it does not eliminate downside risk or guarantee that dips at the 200-day MA will always recover quickly. Markets can trade through institutional support levels during periods of acute macro stress. The ETF structure also does not apply to altcoins, which remain driven by sentiment and retail flow with the same volatility profiles as prior cycles. The structural change is Bitcoin-specific, and applying it to altcoin dip-buying logic is a category error that leads to oversized positions in assets without the same institutional bid. For the broader cycle context that frames which dip levels are most credible in the current environment, the crypto bull run prediction guide covers the macro and on-chain signals that define whether the broader trend still supports dip buying at all.
The phrase sounds smart because it's simple. In practice, simple is what gets retail traders trapped.
Most losses come from three habits. First, traders assume every sharp drop is temporary. Second, they go too big too early. Third, they confuse hope with confirmation. When price keeps falling, they stop trading and start praying.
A market can be oversold and still go much lower. That's the part newer traders miss.
A dip worth buying usually shows some form of stabilization. A bad setup keeps slicing through support, closes weak, and never attracts committed buyers. Backtests on BTC and ETH from 2021 to 2026 found that laddered entry strategies outperformed lump-sum dip buys, while “falling knife” entries without stabilization failed 62% of the time. That's why pressing the buy button on the first hard flush is usually the wrong move.
Practical rule: Don't buy because price is down. Buy because the market has shown where buyers are defending.
Dip buying punishes ego. Traders want to call the exact bottom because it feels like skill. But bottom-picking usually leads to oversized entries, poor average cost, and ugly exits.
The common emotional traps look like this:
The traders who survive dip buying treat it like a checklist, not a vibe.
They want confluence. Trend still intact. RSI washed out. Support nearby. Buyers showing up. Risk defined before entry. Profit plan mapped before the rebound starts.
That sounds less exciting than calling bottoms on social media. It also keeps you in the game.
If you want a repeatable edge, stop asking whether price is lower than yesterday. Ask whether the market is offering a controlled entry inside a trend that still deserves your capital.
Start with one assumption: price being lower doesn't mean value is better. It only means sellers had control.
The cleanest dip buys happen when multiple signals line up. I keep the framework tight. Trend first, momentum second, support third. If those three agree, I pay attention. If they conflict, I pass.
The 200-day moving average is the first line on my chart when I'm evaluating a larger swing buy.
Historical analysis of Bitcoin showed that dips to the 200-day moving average in bull markets led to an average recovery of over 150% within six months in 70% of cases since 2013, according to Zipmex's review of Bitcoin 200-day MA dip behavior. That doesn't mean every touch is a buy. It means the level matters, especially when the broader trend is still up.
What I want to see:
If price loses the 200-day MA cleanly and can't reclaim it, I stop calling it a dip and start treating it like a possible trend break.
RSI is useful when it confirms stress. It's not useful when traders treat it like a magic buy button.
In practice, an RSI reading below 30 tells you selling has become stretched. That matters more when price is hitting a major moving average or horizontal support at the same time. If RSI is oversold but support keeps breaking, I don't buy just because the indicator says “cheap.”
The better read is context:
A quick visual walkthrough helps if you want to see this logic applied on charts:
Moving averages are dynamic. Support levels are where the market has memory.
I mark obvious zones where buyers stepped in before. Prior range lows, reclaim levels, and old breakout areas matter because traders and larger players tend to react there again. If price reaches support with weak momentum and then starts holding closes above that zone, the setup improves fast.
A dip is a pullback that finds buyers where buyers should logically appear.
Three-signal confluence is the goal:
SignalWhat you want to seeWhat it tells you200-day MAPrice respects or reclaims itLong-term uptrend may still be intactRSIOversold or showing divergenceSelling pressure may be fadingHorizontal supportRepeated defense of a key zoneBuyers are active at a known level
When those line up, the trade becomes interesting. When only one is present, it's usually noise.
Once the chart gives you a valid zone, execution matters more than prediction.
The biggest dip-buying error isn't bad analysis. It's going all-in on the first entry. If price drops further, your average is poor, your stress spikes, and your stop either gets widened or ignored. That's how a controlled setup turns into a mess.
A laddered entry splits your capital across preplanned levels. You don't need to catch the exact bottom. You need a structure that lets you participate if support holds and survive if price probes lower first.
Backtests on BTC and ETH from 2021 to 2026 showed that a laddered entry strategy had a 68% win rate versus 42% for lump-sum dip buying, with 25% lower drawdowns, according to Tech Funding News on laddered dip-buying backtests.
That's the reason I prefer tiers. They reduce emotional decision-making and improve average entry when volatility expands.
This isn't the only ladder structure, but it's a practical one for swing dip buys near established support.
TierPrice Drop from CurrentCapital to DeployRationaleTier 1-5%20%Small probe entry if support reacts earlyTier 2-10%30%Add where fear increases and price reaches deeper supportTier 3-15%+50%Deploy most capital only if the market flushes into a stronger value zone
A few execution rules matter more than the percentages themselves:
For traders who want a broader refresher on averaging entries, Wallet Finder's guide on what DCA means in crypto is a useful companion to this approach.
The ideal ladder doesn't fill all at once. You want price to move into the zone, trigger one or two tiers, then show evidence that selling pressure is fading. If all tiers fill instantly on heavy weakness and there's no sign of demand, that's a warning.
A healthy sequence often includes:
The point of laddering isn't to buy more. It's to buy better while keeping your risk preplanned.
Laddering works because it respects uncertainty. That's the right attitude for crypto.
Your article covers the 200-day moving average and RSI as the primary dip identification signals. Both are price-derived. There is a third signal category — sentiment — that consistently improves dip-buying accuracy when used as a complementary filter rather than a standalone trigger, and the Crypto Fear and Greed Index is the most widely used implementation of it.
The index runs on a scale from 0 to 100, where 0 represents Extreme Fear and 100 represents Extreme Greed. It aggregates inputs including price volatility, market momentum, social media sentiment, Bitcoin dominance, and Google Trends data into a single daily reading. Historically, readings below 20 — deep into Extreme Fear territory — have coincided with some of the strongest medium-term buying opportunities in Bitcoin's history. Not because the index predicts price, but because Extreme Fear readings reflect a market condition where most retail participants have stopped buying and many are actively selling — exactly the condition that precedes the sentiment shift that drives recoveries.
The mistake most traders make with sentiment tools is treating them as precise entry timers. An Extreme Fear reading does not tell you that price will bounce tomorrow. It tells you that the emotional conditions for a dip buy are present — which is a necessary but not sufficient condition. The index becomes most useful when combined with the technical signals your article already covers.
The combination that works consistently is an Extreme Fear reading below 20 coinciding with price at or near a major technical support level — the 200-day moving average, a prior cycle high that has become support, or a clearly defined horizontal zone where buyers have defended before. When sentiment is at capitulation levels and price is at a structurally meaningful level simultaneously, the confluence is far stronger than either signal alone. Conversely, when price hits a support level but the Fear and Greed Index is still reading above 50, it tells you that sentiment has not fully flushed — which means a second leg lower is more likely before a genuine recovery begins.
The February 2026 Bitcoin dip is the clearest recent example. As Bitcoin fell from $80,000 toward $63,000, the Fear and Greed Index dropped into Extreme Fear territory, reaching readings in the low teens at the same time that price was testing the 200-day moving average. Traders who used both signals in combination — not just the technical level, and not just the sentiment reading — had the strongest confluence of evidence that this was a dip worth buying rather than a deteriorating trend worth avoiding. The crypto indicators guide covers the full technical indicator stack alongside sentiment tools for traders who want to build out the complete signal framework.
Charts tell you where price is reacting. On-chain data tells you who is acting.
That distinction matters. A setup can look clean on the chart and still fail if serious capital isn't accumulating. When I'm deciding whether to press a dip buy harder, I want to know whether strong wallets are buying the same weakness or stepping aside.
A few signals matter more than the rest.

The edge comes from watching behavior, not stories. Crypto traders love narratives during selloffs. Wallet activity is harder to fake.
Retail usually reacts late. They buy after the bounce is obvious or sell after the panic is already priced in. On-chain tracking gives you a better way to confirm whether the dip is attracting experienced participants.
That doesn't mean copying every profitable wallet trade blindly. Different wallets trade different timeframes, token classes, and risk profiles. The value comes from pattern recognition.
Look for things like:
For traders who want a primer on reading blockchain behavior properly, this guide on how to check on-chain data is worth studying before you build a workflow around it.
My sequence is simple.
First, mark the technical zone. Second, wait for price to react. Third, check whether strong wallets are accumulating into that reaction. If chart and wallet flow agree, the trade earns more attention. If they disagree, I scale down or skip it.
Good dip buys get support from both sides. The chart shows where the level is. The chain shows who believes in it.
A lot of traders improve fast when they stop guessing whether “smart money” is buying and start verifying it.
A great entry won't save you from bad risk management.
Most dip buyers focus too much on where to buy and not enough on what happens if they're wrong. Crypto punishes that fast. If you size poorly or skip stops, one bad sequence can erase several good trades.
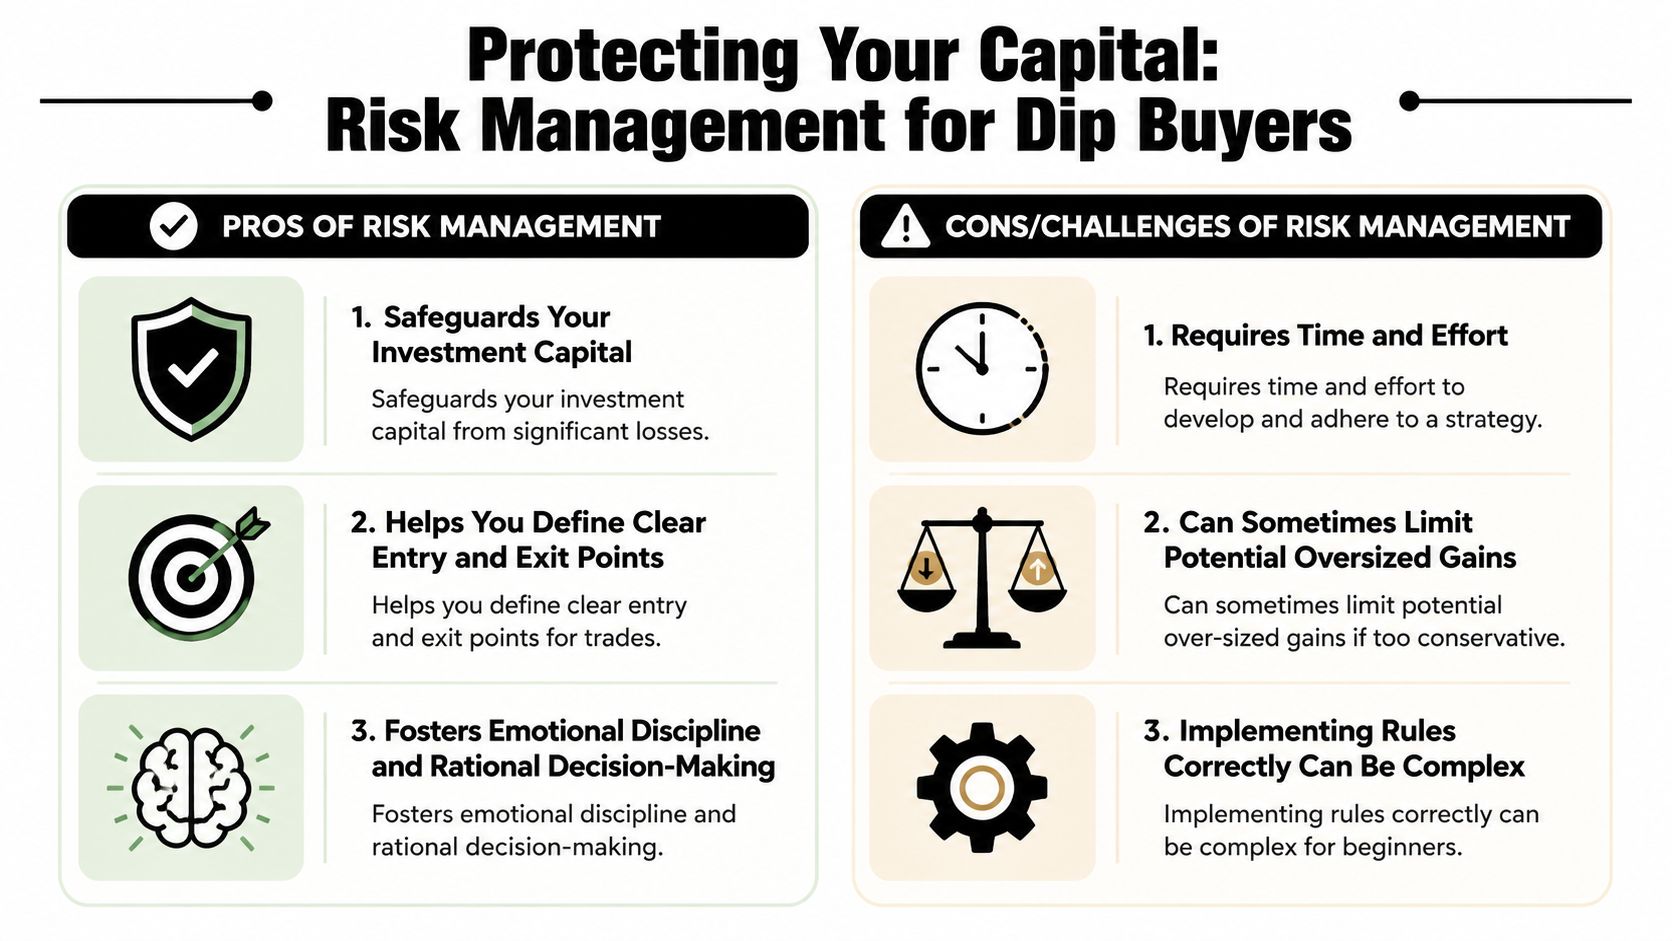
If one trade can do serious damage to your account, the problem isn't the setup. It's the size.
On-chain analysis cited in dip-buying research found that risking more than 2% of capital was a major reason for account failure, wiping out one-third of accounts during multi-dip sequences. The same analysis noted that 40% of dip trades made without a stop-loss eventually turned into a 50%+ loss. Those are ugly numbers, and they match what most experienced traders have already seen in practice.
Use smaller risk when volatility is high, correlations are rising, or support is still unconfirmed. If you need help structuring that mathematically, Wallet Finder's guide on position sizing for high-volatility trades is a solid reference.
A stop-loss should sit below the level that invalidates the idea, not at some random distance that “feels safe.”
That usually means below:
If your stop is too tight, noise takes you out. If it's too loose, the loss becomes unacceptable. The answer isn't guessing. The answer is aligning stop placement with structure and then adjusting position size so the loss stays manageable.
Dip buyers often manage risk on the downside and then become careless on the upside. They hold too long, give back gains, and turn a clean trade into a flat result.
A better approach:
Non-negotiable: If you don't know where you're wrong, you don't have a trade. You have exposure.
Risk management doesn't make dip buying less profitable. It makes it survivable.
In early 2026, Bitcoin gave traders a textbook test of discipline.
During a broader correction, Bitcoin's 200-day moving average held near $89,000 and acted as a macro floor, followed by a rally that exceeded 200% by mid-year. That's useful because it shows what a real buy-the-dip crypto setup looks like when trend, level, and execution line up.
The chart had three things I want to see in a serious dip buy.
First, price was pulling back into a major long-term reference level rather than collapsing in open air. Second, the move was happening during a broader correction, not after a long dead market. Third, the zone had clear significance. Buyers had a logical place to defend.
That doesn't make the trade automatic. It just makes it tradable.
The clean way to approach a setup like this was with staged orders, not a single aggressive entry.
A practical execution looked like this:
The key was patience. If support held, you got a strong average. If support failed, you had a defined exit instead of a portfolio-sized problem.
Once price started reclaiming the level and building higher lows, the job changed. It was no longer about getting in. It was about not mishandling the recovery.
I'd manage a trade like this in layers:
StageActionReasonEntry reactionLet the position prove itselfAvoid trimming too early before confirmationFirst recovery legTake partial profitReduce stress and pay for riskTrend continuationTrail remaining size under structureStay in the move while protecting gains
This is the part traders underestimate. Good dip buying isn't just courage on the way down. It's discipline on the way back up.
The 2026 example worked because it followed a complete playbook. Trend level respected. Entry staged. Risk defined. Profits managed. That's the difference between buying a dip and trading one well.
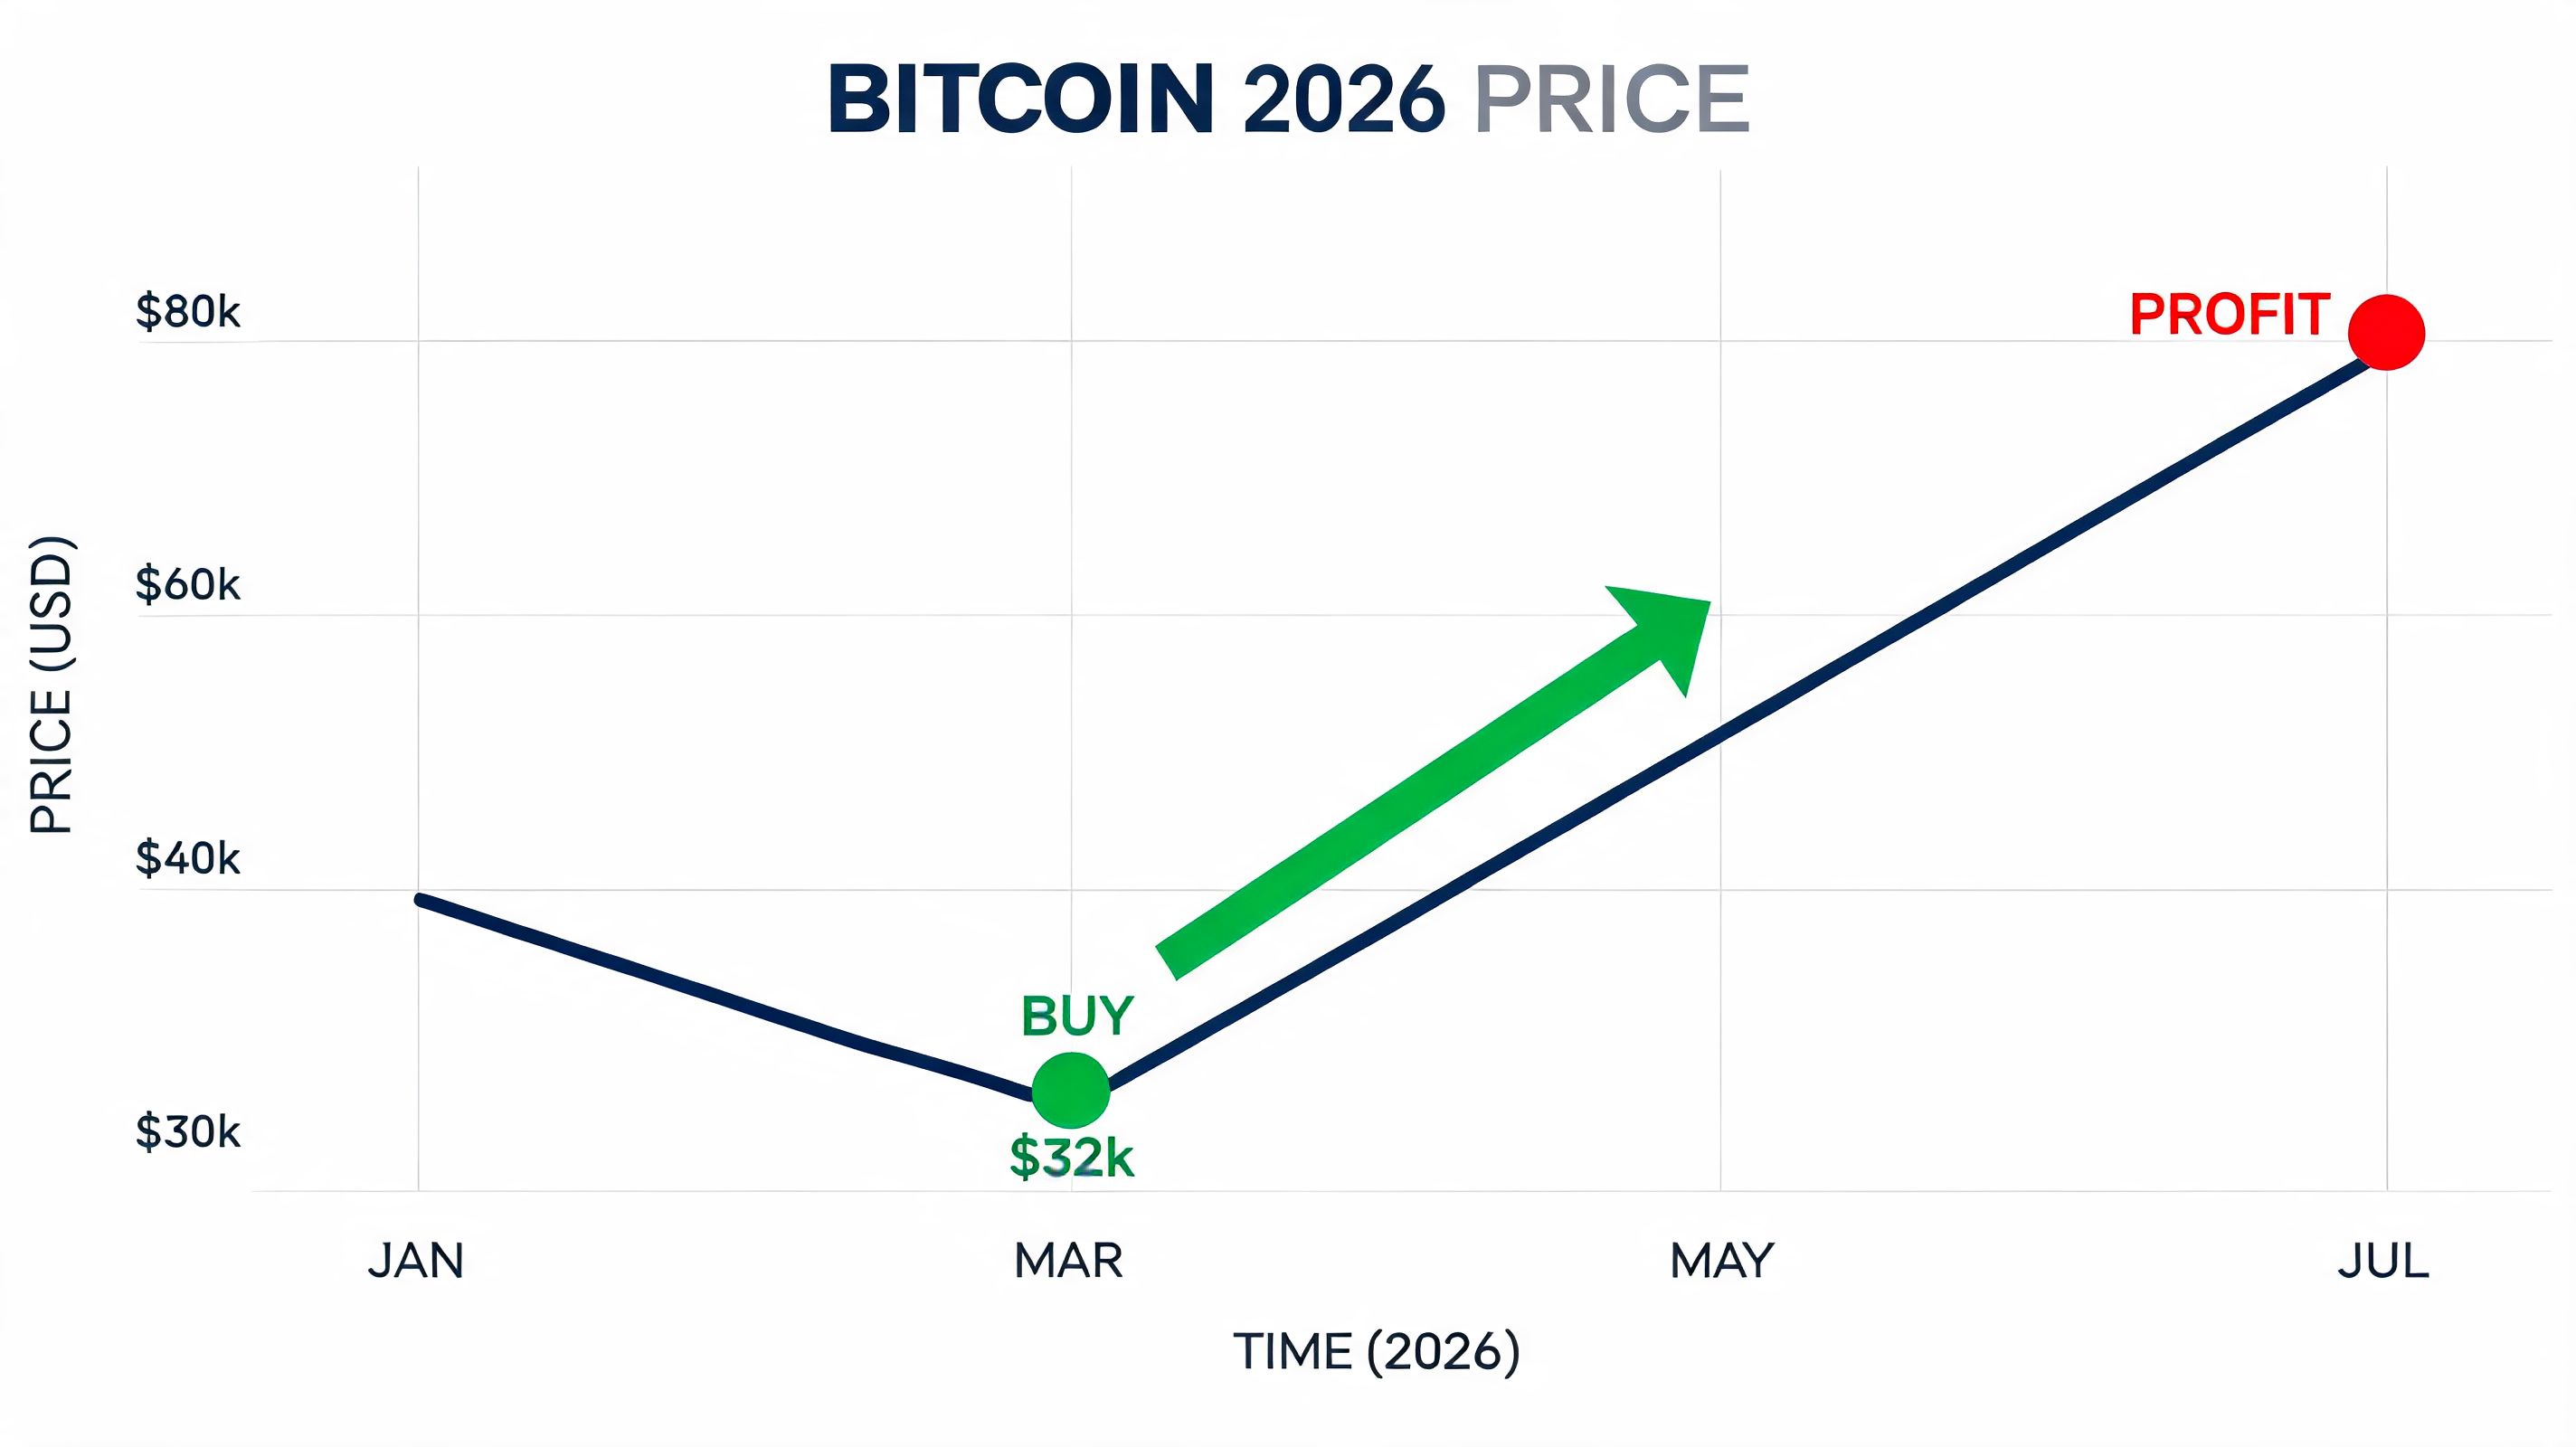
Abstract frameworks for buying dips are useful until the moment a real dip arrives and the emotional pressure to abandon the framework becomes overwhelming. The most instructive way to make this concrete is to walk through the February 2026 Bitcoin correction specifically, because it is the most recent major dip that readers of this article likely experienced — and because it illustrates every principle in this guide playing out in sequence across a period of actual market stress.
Bitcoin reached its all-time high of approximately $122,000 to $126,000 in October 2025. The correction that followed was gradual at first, then accelerated in early February 2026 when broader macro concerns combined with leveraged position liquidations to push Bitcoin down sharply toward the $60,000 to $63,000 range. In a single 24-hour period on February 6, 2026, Bitcoin briefly touched below $60,000 before staging what Reuters described at the time as one of the strongest single-session rebounds in Bitcoin's history, recovering toward the $70,000 level by the close of that day.
The traders who bought that dip profitably — rather than panicking, chasing the first bounce, or averaging into a falling knife — shared a common set of behaviors that the abstract framework describes but which become much clearer in a specific example.
They had pre-defined their buy zone before the drawdown began. The 200-day moving average on Bitcoin's chart had been sitting near $89,000 for most of 2026, but as the correction deepened through January, it became clear that this level was not going to hold as support. Traders who had mapped the next significant structural zone — prior consolidation areas and Fibonacci retracement levels in the $63,000 to $68,000 range — had their limit orders ready. They did not need to make real-time decisions during the fastest part of the selloff because the decision had already been made.
They used laddered entries rather than all-in positions. The traders who sized in gradually across the $68,000 to $63,000 range did not need the exact bottom to hold a profitable position after the recovery. The traders who went all-in at the first sign of weakness in January found themselves averaging down through the entire decline with no capital remaining by the time the strongest support finally held.
While price was still falling, the on-chain signal layer told a different story than the chart. Wallet activity data showed that wallets with documented profitable track records across prior cycles were accumulating during the decline rather than reducing exposure. Exchange inflows — which rise when holders are preparing to sell — did not show the sustained spike that typically accompanies the start of a bear market. ETF holdings remained stable or grew during the drawdown, confirming that institutional demand was absorbing selling pressure rather than adding to it.
Traders who were watching on-chain wallet behavior through a tool like Wallet Finder.ai had access to the confirmation signal that the chart alone could not provide: the buyers showing up at the support level included wallets with track records of buying weakness correctly in prior cycles. That convergence — price at a major support level, Fear and Greed in Extreme Fear, proven wallets accumulating — produced one of the highest-conviction dip setups the current cycle generated. The recovery to $76,000 and beyond validated that convergence, but the confidence to act on it came from the process, not from predicting the outcome.
Wallet Finder.ai helps traders turn this process into something repeatable. You can track proven wallets across major chains, study their entries, sizing, win streaks, and timing, then act when strong wallets start accumulating during real pullbacks instead of guessing from headlines. If you want a faster way to validate dip setups with live on-chain behavior, explore Wallet Finder.ai.

A premier DeFi analytics platform empowering traders to discover and analyze profitable blockchain wallets, trades and tokens.

