
Recovery Factor Calculation for Smart Traders
Master the recovery factor calculation to measure a strategy's resilience. Learn the formula, see DeFi examples, and find top wallets with Wallet Finder.ai.

June 20, 2026


Wallet Finder
April 17, 2026
You’re staring at a chart that’s gone vertical. The token is all over X, Telegram is calling it early, and the price looks like proof that something real is happening. Most traders stop there. They check the quote, maybe glance at market cap, then either ape in or talk themselves out of it.
That’s how people confuse price with value.
If you want to calculate coin value in a way that survives hype cycles, you need more than a spot number from an exchange. You need a layered view: what the market is paying now, what the token structure allows to happen next, and what on-chain participants with real edge are doing with size.
A coin can trade at a clean, simple price and still be badly misread.
That happens constantly in DeFi. A token at a few cents looks “cheap,” even when supply expansions can swamp buyers. Another token looks expensive because the unit price is high, even though the circulating supply is tight and the protocol is capturing value. The quote on your screen tells you where the last trade happened. It doesn’t tell you whether that trade was informed, sustainable, or disconnected from what’s happening under the hood.

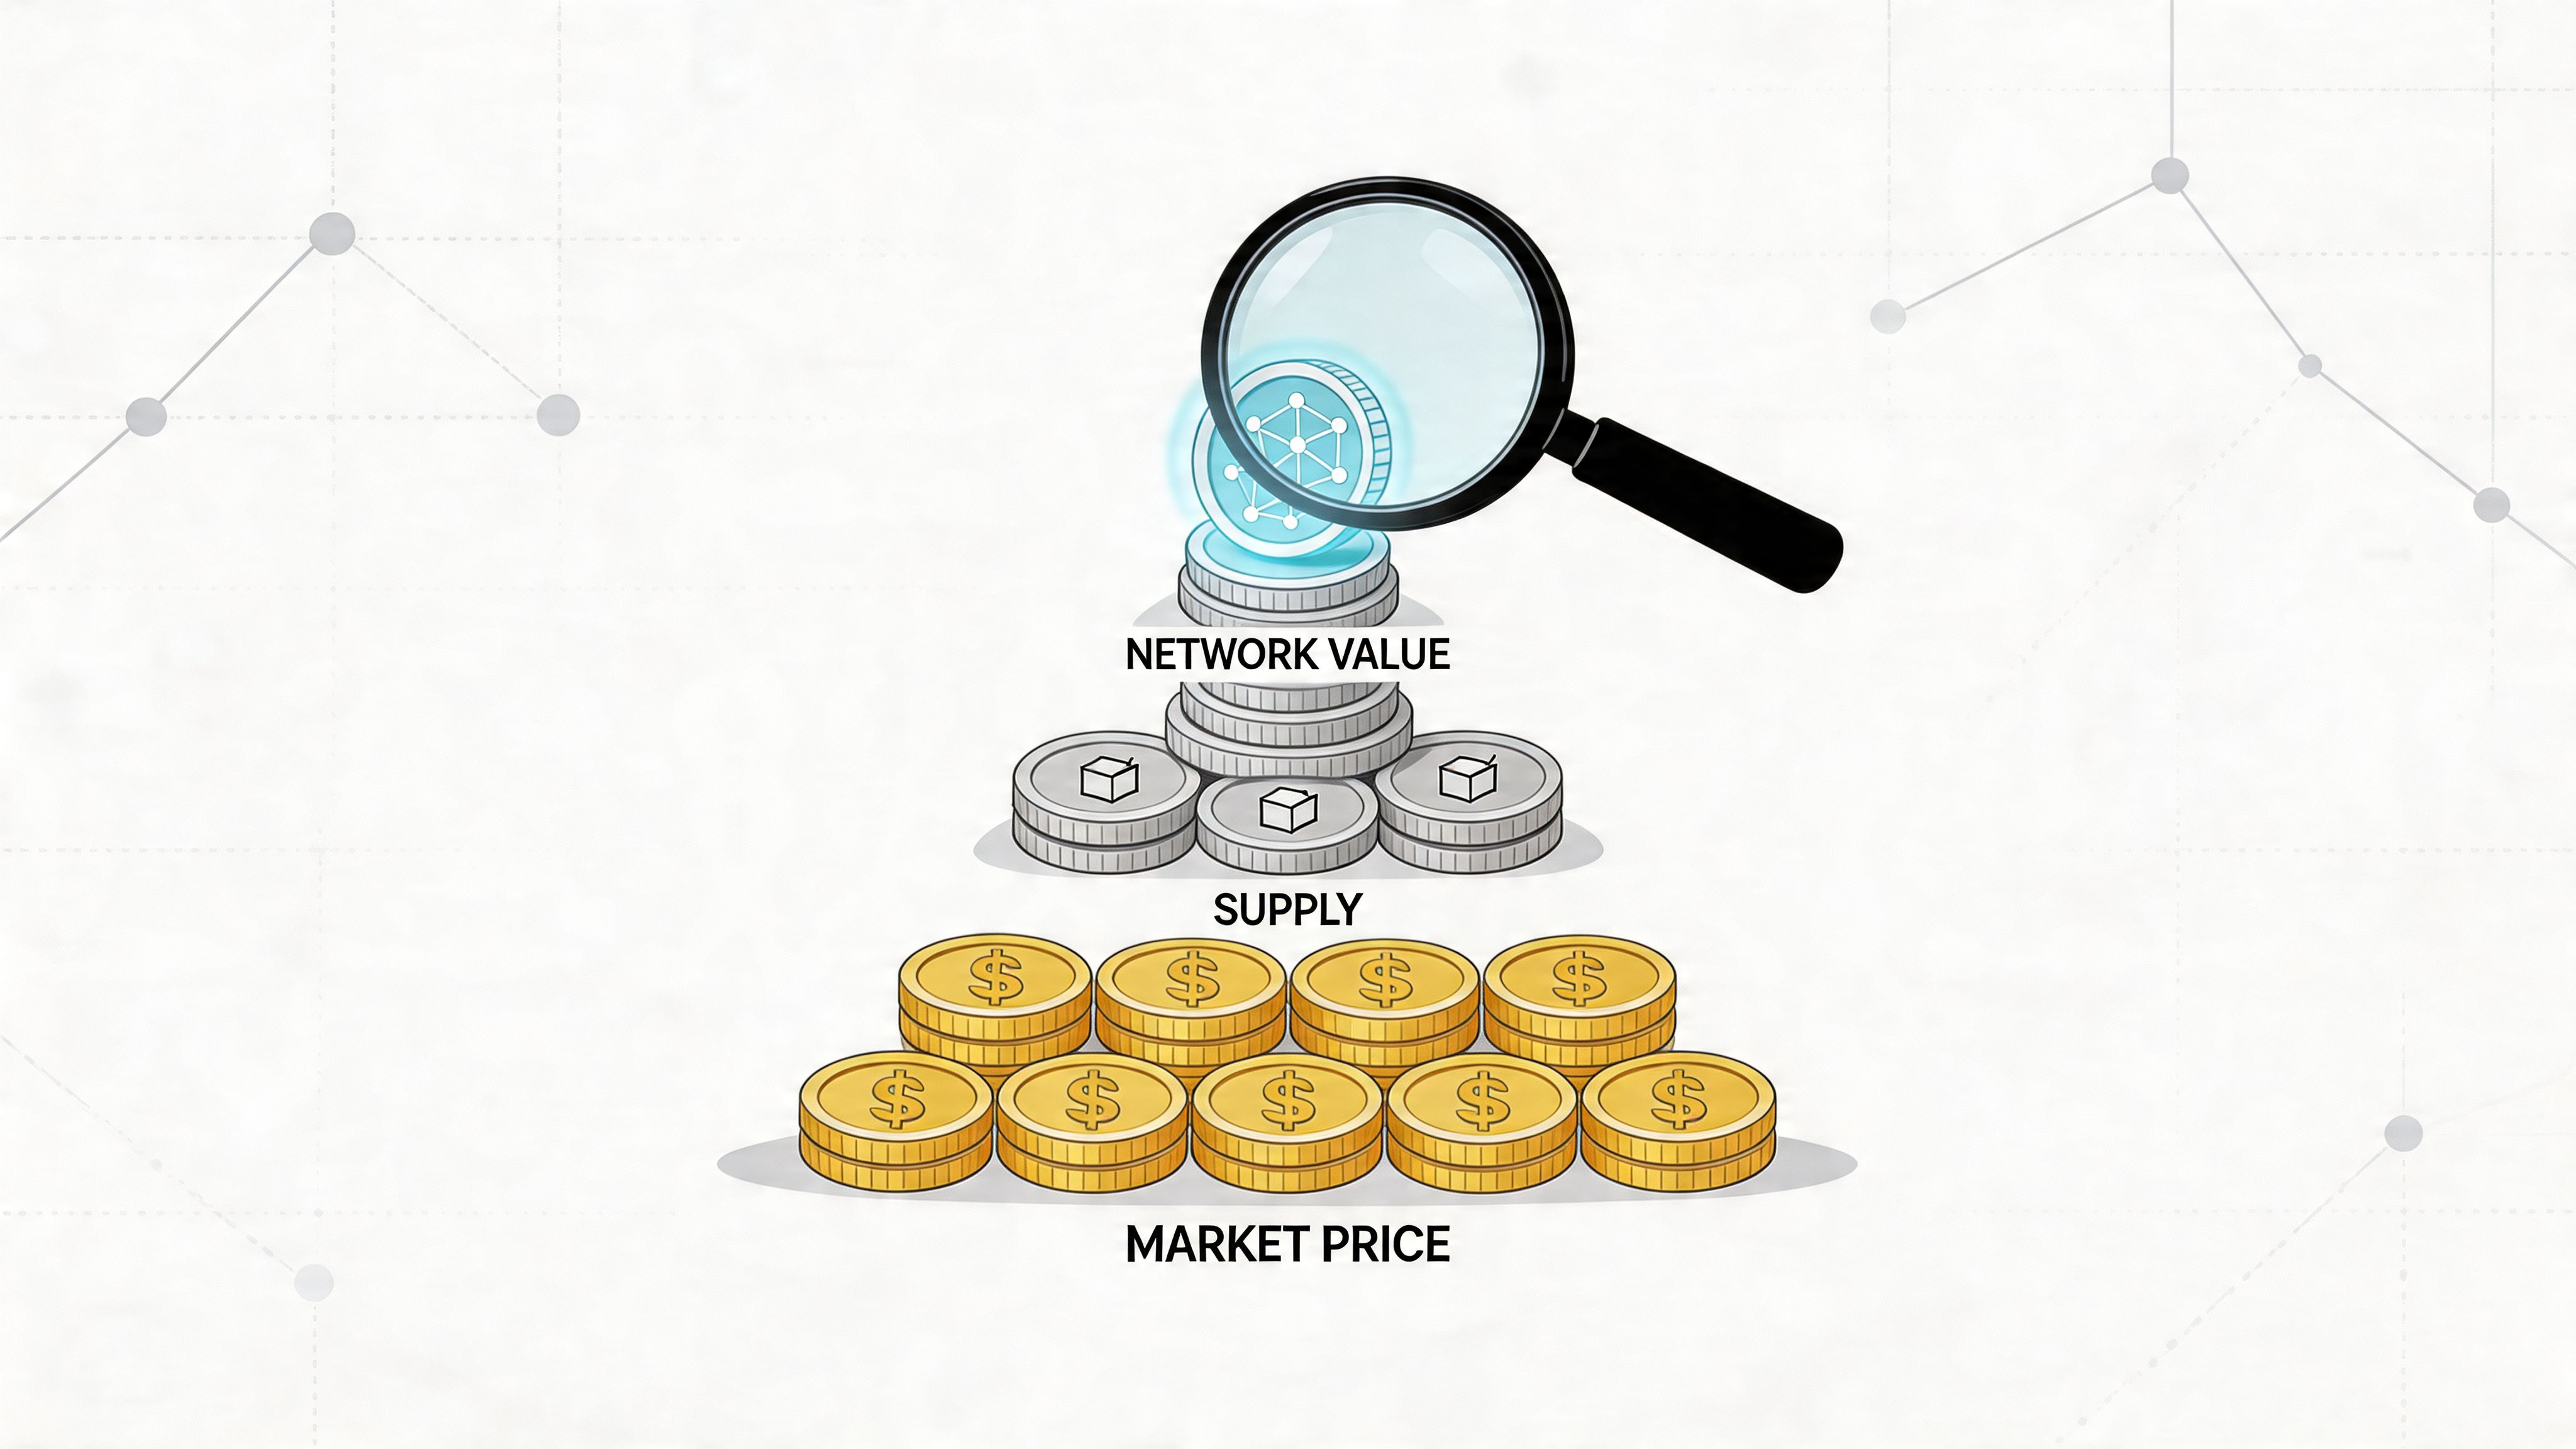
I think of valuation as a stack, not a single metric. At the base is the obvious stuff: spot price, circulating supply, and diluted supply. Above that is token design: emissions, staking, burns, fee capture, governance rights. At the top is the layer most traders skip, which is behavior. Wallet behavior often tells you more than public narratives do.
A trader who wants an edge has to ask better questions:
If you only use market price, you’re valuing a coin the way a tourist reads a city from the airport.
A better starting point is to separate true market price from visible exchange price. This is the gap many traders miss, and it’s why pieces like this breakdown of true market price matter. The number on the chart is real, but it’s incomplete.
Market price is the headline. Coin value is the investigation.
You can do a useful first-pass valuation in under a minute. It won’t tell you everything, but it will stop a lot of bad trades before they start.
The simplest version of calculate coin value is just converting the token’s current price into your base currency. That’s fine for a quote. It’s not fine for analysis.
A token trading at $1 can be massively overvalued. A token trading at $100 can still be attractive. Unit price alone is one of the least helpful signals in crypto because supply structures vary so much.
What matters more is how price interacts with supply.
Use these two formulas immediately:
Market cap tells you what the market is valuing the currently circulating tokens at.
Fully diluted valuation, or FDV, tells you what the network would be worth if all tokens that can exist are already in circulation.
That gap matters. A large gap between market cap and FDV often means future token releases, emissions, or vesting pressure can hit price later, even if the chart looks healthy now.
| Metric | What It Measures | Key Question It Answers | Limitation |
|---|---|---|---|
| Price | Value of one token at the latest trade | What does one unit cost right now? | Ignores supply and token structure |
| Market Cap | Value of circulating tokens | How large is the live market valuation? | Doesn’t show future dilution |
| FDV | Value assuming full supply is circulating | How much valuation is implied after all supply is out? | Can overstate reality if supply won’t unlock for a long time |
| Circulating Supply | Tokens available in the market now | How much of the token is actually tradeable? | Doesn’t explain future issuance |
| Max or Total Supply | Tokens that may eventually exist | How much supply risk remains? | Doesn’t reveal when or how tokens unlock |
Say you’re looking at a hypothetical token called NORTH.
If NORTH trades at the same spot price across multiple screens, that still doesn’t mean traders are seeing the same thing. One trader notices only the chart. Another checks circulating supply and finds that only a portion of tokens is live. A third checks future token releases and realizes there’s significant future issuance. They’re all looking at the same coin, but only one is attempting valuation.
That’s the practical difference between trading price and analyzing value.
Here’s the workflow I use for this first pass:
If the gap is narrow, dilution risk may be less urgent. If the gap is wide, the next question isn’t “can it pump?” It’s “who gets those future tokens, and when do they hit the market?”
Practical rule: If you can’t explain the market cap to FDV gap in one sentence, you don’t understand the token yet.
This fast method is good at spotting obvious issues:
It’s also good for comparisons. Two tokens can have similar communities and similar usage narratives, but very different supply setups. The one with cleaner dilution mechanics often gives you a better risk-adjusted setup.
This screen won’t tell you whether a token has any real value accrual. It also won’t tell you whether a whale cluster is accumulating before a move. And it definitely won’t tell you whether the protocol deserves its current valuation.
That’s where most traders need to go deeper.
The quick checklist below is enough to decide whether a token is worth further research.
A token can trade at $2 and still be expensive. Another can sit at $40 and be cheap. The difference is whether the token has a credible path to capture the value created around it, and whether large holders are likely to treat that path as real or just promotional copy.
That is the point where simple valuation starts to matter. Spot price tells you the latest deal. Tokenomics and intrinsic models tell you what that deal is buying.
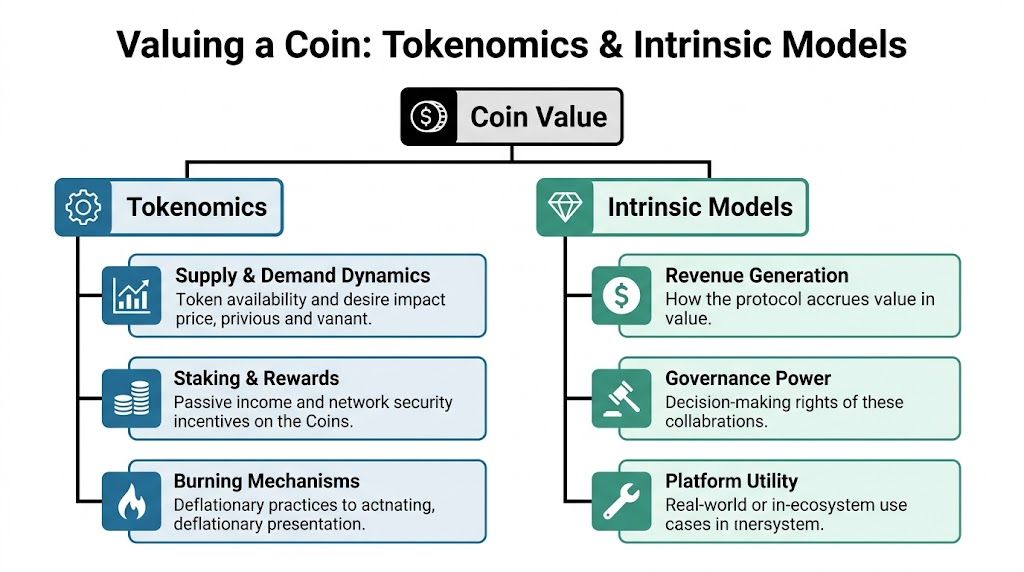
Teams reuse the same labels across very different designs. “Governance,” “utility,” and “ecosystem” often describe marketing position more than economic function.
What matters is simple. Does protocol success increase demand for the token, reduce supply, direct cash flow to holders, or give holders control over something that affects cash flow?
Focus on mechanisms that can be verified:
If those mechanisms are weak, valuation becomes a study of reflexivity and attention. Traders can still make money in that setup. They just should not confuse momentum with intrinsic value.
Discounted cash flow can work in crypto, but only for tokens with claim-like exposure to fees or revenue. Keep the model narrow. The goal is not precision. The goal is to test whether the current valuation already assumes perfect growth, zero governance risk, and clean execution.
A practical framework looks like this:
A DEX token is a good example. If token stakers receive a defined share of trading fees, the model has something real to work with. If fee sharing exists only as a proposal, can be changed by a small multisig, or gets diluted by emissions, the fair value range should come down fast.
I usually care less about the exact number than about the gap between assumptions and reality. If the model only works under top-of-cycle volume, permanent user growth, and zero selling pressure from treasury or investors, the token is already priced for a very clean outcome.
Some tokens do not have direct claims on revenue, but still gain value from network growth. That is common with base layer assets, social tokens, marketplaces, and highly reflexive communities.
Metcalfe-style thinking helps here. More active users, more counterparties, more transactions, and more attention can increase the usefulness of the network and the willingness to hold the token. That does not produce a neat fair value number, but it does give you a way to judge whether user growth is supporting the move or whether price is running far ahead of actual adoption.
The trap is obvious. Vanity metrics are cheap. Airdrop farming, bot activity, and low-quality wallet counts can make a weak network look stronger than it is. Serious traders check active addresses, repeat usage, retention, transaction quality, liquidity depth, and whether larger wallets are building positions into that growth.
That is where tokenomics starts to overlap with wallet intelligence. If a token shows stronger usage trends and profitable smart-money wallets are accumulating instead of distributing, its effective value can be higher than a cash flow model alone suggests. If user metrics look healthy but whale clusters are exiting into strength, the market may be telling you that the headline growth is lower quality than it appears.
Project documents still matter, but only the parts that affect supply, control, and value capture. Marketing sections are mostly noise.
Use the docs to map the economic design, then compare that design with what is happening on-chain. If you want a practical filter for project documentation, this guide to reading crypto white papers is useful because it focuses on the sections that affect capital allocation.
Review these areas closely:
A schedule can look acceptable on paper and still create pressure in practice. Large wallets know when supply will be released. They often position before retail notices.
This process works best for tokens with visible fee generation, recurring usage, and a documented path from protocol activity to holder benefit.
It works poorly for pure narrative assets dressed up with vague utility language.
It works conditionally for network tokens, where adoption matters more than direct cash flow. In those cases, the best valuation work blends token design with wallet behavior. I want to know not just whether the model says the token should be worth more, but whether experienced wallets are treating that thesis as actionable.
That is the practical standard. A good valuation model does not need to predict the exact price. It needs to tell you whether the token has a real claim on success, whether the current market is overpaying for a story, and whether informed capital is confirming or rejecting your view.
You pull up a token that looks cheap relative to the story around it. Spot is flat, sentiment is noisy, and the chart has not broken down. Then you check the wallets that move size. A few high-conviction addresses have been selling into every bounce. That changes the valuation immediately.
Market price shows the latest trade. On-chain analysis shows who is pressing that trade, where they got in, whether they are still committed, and how real the activity is behind the move. That is the layer that helps turn a rough valuation into a usable trading view.

Public commentary is cheap. Wallet behavior is expensive.
A founder can talk up adoption. A KOL can post a thread. A community can insist the market is wrong. None of that carries the same weight as a wallet with a strong history of timing entries, building size early, and defending a position through volatility.
That is why I treat on-chain work as a valuation input, not just a confirmation tool. The question is not only whether the token looks underpriced on paper. The question is whether experienced capital is accumulating at current levels, sitting tight, or using strength to exit.
If you want the mechanics behind that process, this on-chain analysis overview covers how to read wallet and transaction data without getting lost in noise.
A token can screen well on headline valuation and still deserve a discount because the chain activity is weak.
The Network Value to Transactions ratio, or NVT, compares network value with transaction activity. It works best as a quick filter. If valuation keeps rising while transaction activity stalls, the market may be paying for a narrative ahead of actual usage. If activity is improving and valuation has not caught up, the token deserves a closer look.
Three practical reads matter:
NVT is not a trigger. It is a way to avoid paying growth multiples for a chain that nobody is using.
Many token dashboards flatten all holders into one crowd. That is a mistake.
A wallet that repeatedly buys local tops and pukes bottoms should not influence your valuation the same way as a wallet with disciplined sizing, strong realized PnL, and consistent sector rotation. The edge comes from ranking wallet behavior by quality, then checking whether those wallets are building exposure or heading for the exit.
Whale activity matters too, but context matters more. One large buy can be treasury movement, market making, or internal reshuffling. A cluster of skilled wallets buying in the same zone over several days is far more useful. That pattern often marks a price area where informed buyers see favorable risk.
I use effective value to describe the price range implied by informed wallet activity, not just the current quote on the screen.
That estimate comes from five inputs:
Spot price
Start with the live market price. It is the reference point, not the answer.
Entry zones from skilled wallets
Track where high-quality wallets started building. Repeated entries in one range usually matter more than social sentiment.
Holding behavior
A wallet that keeps size through drawdowns is signaling something different from a fast flipper.
Wallet quality
Give more weight to addresses with repeatable PnL, sensible sizing, and a history of rotating early into strength.
Rotation context
Check what capital left to fund the new position. Selling laggards to buy a leader means something very different from a random small-cap punt.
A practical workflow looks like this:
If spot is above the average smart-money entry but those wallets are still adding, the token can still be trading below effective value. If price is strong and the best wallets are distributing into that strength, effective value may already be behind the market.
Single-wallet signals are easy to overrate. Clusters are harder to fake.
The best setups usually share a few traits. Several skilled wallets enter near the same range. The buying happens over time instead of one isolated spike. Position size is meaningful relative to each wallet’s normal behavior. The wallets do not fully exit on the first pop. Network activity is at least stable, and ideally improving.
That combination matters because it ties valuation to behavior you can verify. Price alone cannot show that. Holder count alone cannot show that either.
A short explainer helps if you want to see this logic in action before doing it manually:
Basic coin calculators answer conversion questions. They do not tell you whether strong wallets are defending a level, whether whales are rotating into a sector, or whether a breakout is being sold discreetly by informed holders.
Advanced on-chain work helps you spot:
That is where a trader gets an actual edge. Price is the surface print. Effective value comes from price, activity, and the behavior of wallets with a record worth following.
You don’t need a perfect model. You need a repeatable one.
Good traders don’t calculate coin value by hunting for one magic indicator. They build a stack of evidence. The more layers agree, the better the setup.
Run every token through this sequence:
You can also turn the framework into a quick pass-fail screen.
| Layer | Green flag | Warning sign |
|---|---|---|
| Supply setup | Clean circulation and manageable dilution | Wide gap between live valuation and full dilution without a clear reason |
| Tokenomics | Visible value accrual | Governance or utility language with no economic benefit |
| Network usage | Healthy transaction activity relative to valuation | Valuation running ahead of usage |
| Wallet behavior | Strong wallets entering and holding | Skilled wallets trimming into strength or avoiding the token |
A low FDV token with strong value accrual being accumulated by high-PnL wallets is the trifecta of a high-conviction trade.
This framework won’t remove uncertainty. Crypto doesn’t work that way.
What it does is improve decision quality. You stop buying because a chart is loud. You start buying when valuation structure, token design, and on-chain behavior point in the same direction.
And when they don’t align, you pass.
That restraint matters as much as entry timing.
If you want to apply this framework with live wallet intelligence instead of guessing from public noise, try Wallet Finder.ai. It helps you track profitable wallets, study entry and exit timing, monitor token accumulation, and turn on-chain behavior into a clearer view of what a coin may be worth before you copy the trade.

A premier DeFi analytics platform empowering traders to discover and analyze profitable blockchain wallets, trades and tokens.

