
Recovery Factor Calculation for Smart Traders
Master the recovery factor calculation to measure a strategy's resilience. Learn the formula, see DeFi examples, and find top wallets with Wallet Finder.ai.

June 20, 2026


Wallet Finder
June 20, 2026
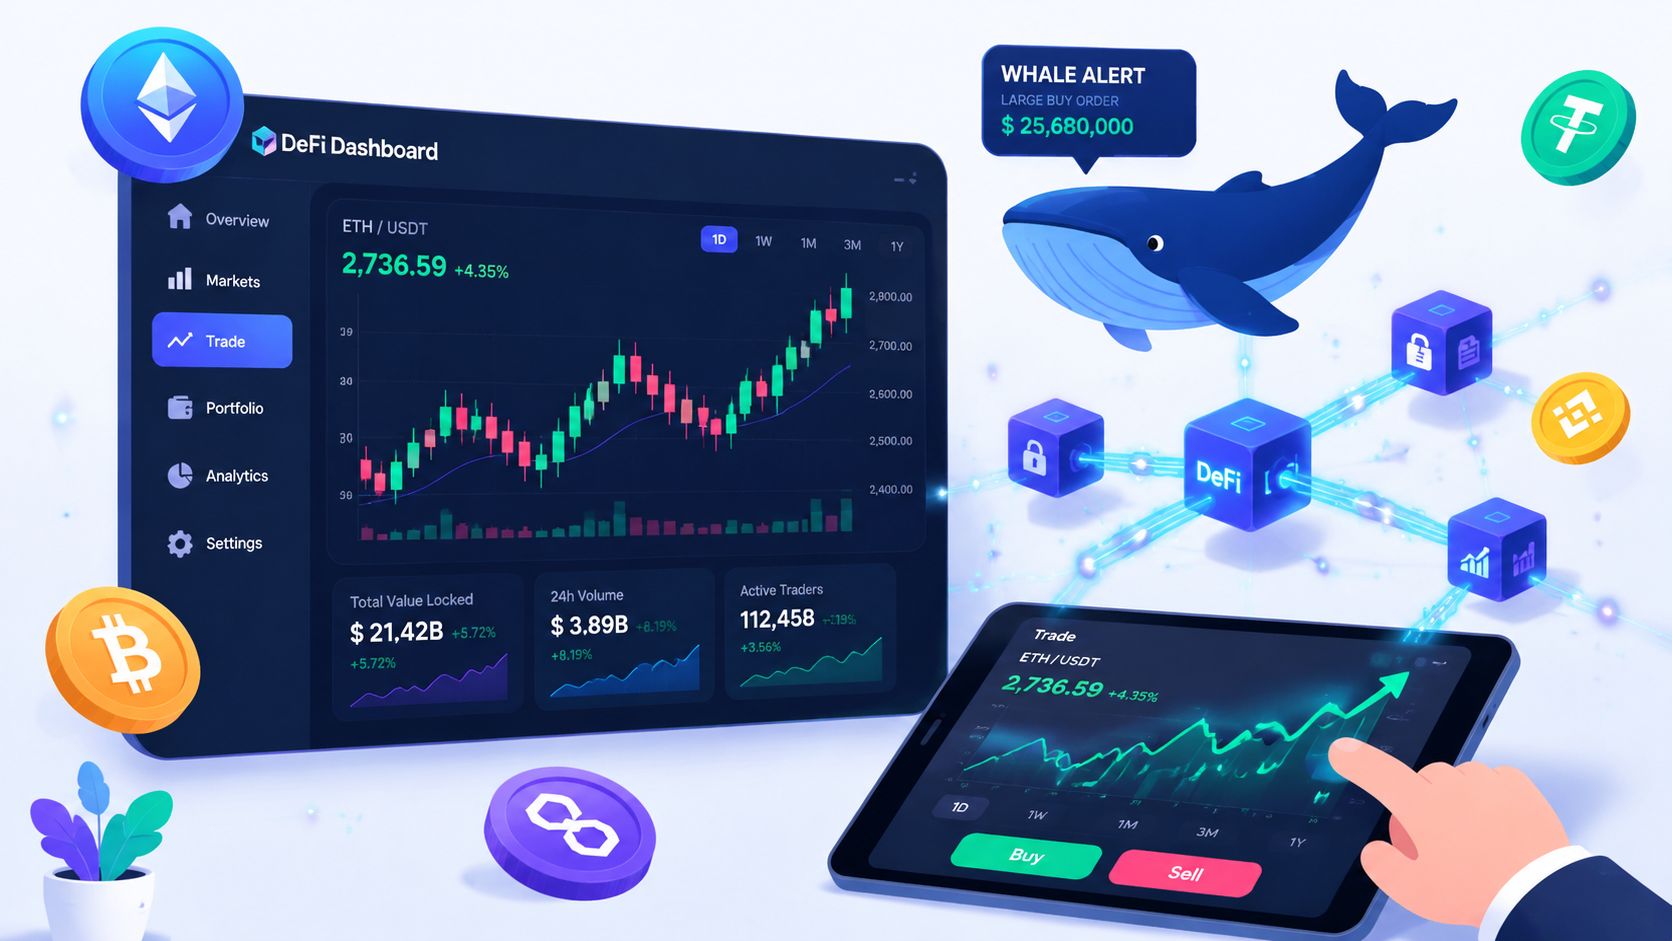
You open your terminal, wallet dashboard, and Telegram alerts at the same time. BTC moves, a whale rotates, a memecoin starts trending, and your first instinct is to chase the candle that already ran. That's how most traders leak edge in DeFi. They react to noise, then tell themselves a story about why the trade was “obvious.”
A better process starts with evidence before action. In DeFi, that means treating wallets, token flows, transaction timing, and liquidity behavior as data inputs, not background chatter. The point of data driven trading isn't to sound quantitative. It's to make decisions you can test, repeat, and improve.
Most new traders think the hard part is finding signals. It isn't. The hard part is building a workflow that filters weak signals, defines entry conditions, and keeps you from improvising every time the market gets loud.
Data driven trading is a rules-based way of making trading decisions from observable evidence instead of mood, bias, or social pressure. In practice, that means you define what matters, measure it, and act only when your conditions are met.
In crypto, the alternative is familiar. You see a token moving, read five bullish posts, notice one wallet bought size, and jump in without context. Then the same wallet distributes into strength, liquidity thins, and you're left managing a trade you never really planned.
That approach feels active, but it isn't systematic. It also tends to punish traders over time. An industry analysis cited by LuxAlgo's overview of quantitative trading says emotional investors can lag by about 4.4% annually, while data-driven platforms can potentially increase returns by as much as 20%.
A data driven trader doesn't ask, “Do I like this token?” The better question is, “What conditions exist, and have these conditions led to acceptable outcomes before?”
That shift changes everything:
Practical rule: If you can't describe your setup in a few objective conditions, you don't have a strategy yet. You have a hunch.
DeFi is unusually noisy. Narratives move fast, token lifecycles compress, and wallet-level behavior often matters more than polished public messaging. That makes systematic observation valuable.
The edge usually doesn't come from predicting everything. It comes from narrowing your field of play. You decide which wallets matter, which chains matter, what “accumulation” means, what distribution looks like, and when you'll ignore a signal. That's the difference between participating in the market and studying it closely enough to trade it with discipline.
If strategy is the engine, data is the fuel. Bad fuel gives you noisy signals and false confidence. Good fuel gives you a cleaner read on who is doing what, where, and with what conviction.
In DeFi, I treat data in four buckets. Each bucket tells you something different, and none should be used in isolation.
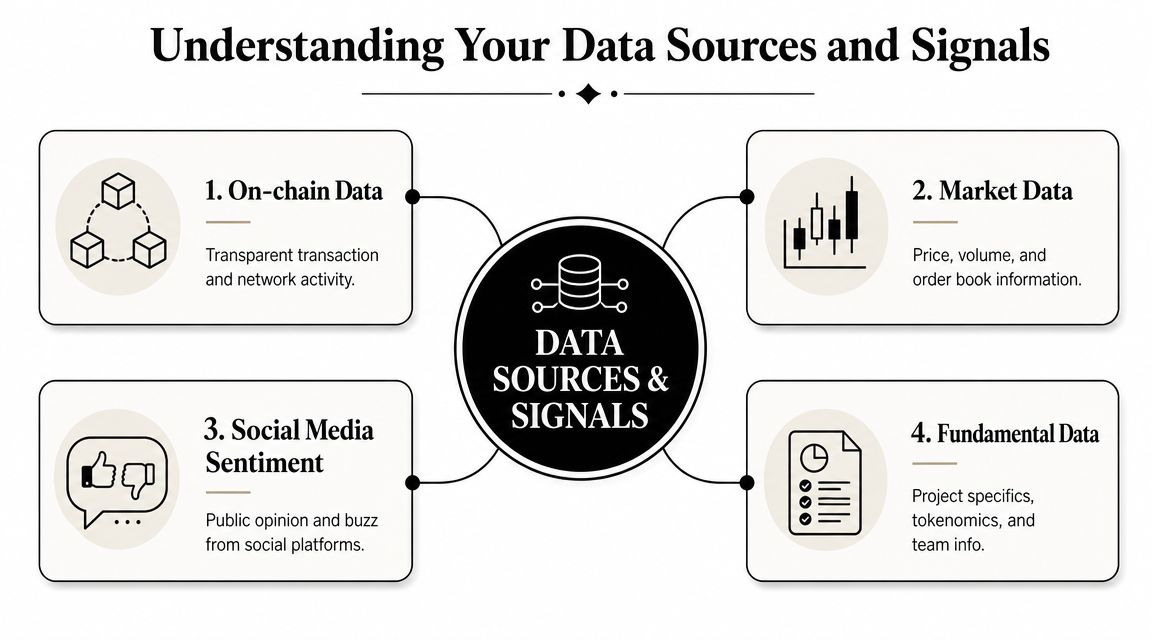
This is the native language of DeFi. Transactions, wallet balances, token transfers, swap behavior, holding periods, and realized outcomes all live here.
For most traders, on-chain data is the highest-value category because it shows actual behavior, not opinions about behavior. A wallet that buys early, sizes consistently, and exits with discipline tells you more than a hundred posts on X.
Useful on-chain signals include:
If you're new to structuring these inputs, blockchain data analytics methods are worth studying because raw transaction data only becomes useful after you map it to trading behavior.
This includes price, volume, liquidity, spreads, order-book behavior where available, and trade flow. It answers a different question from on-chain data. Not “who is buying?” but “how tradeable is this setup right now?”
A key technical edge in data driven trading is using statistical models on historical, market, and alternative data, especially with market microstructure data like order-book depth that can reveal short-term imbalances not visible in standard price charts, as described by Quantified Strategies on data-driven trading methods.
That matters in DeFi because a strong wallet signal can still be untradeable if liquidity is thin or if execution conditions are poor.
Sentiment data is noisy, but ignoring it is a mistake. Social velocity can change timing even when your on-chain thesis is correct. A token can stay quiet while smart wallets accumulate, then reprice once attention arrives.
Use sentiment carefully:
This covers tokenomics, release structure, protocol design, team credibility, treasury behavior, and incentive design. It won't time your entries well, but it can keep you out of weak setups.
Strong signals come from agreement across categories. One wallet buy isn't enough. One bullish thread isn't enough. A better trade appears when wallet behavior, market conditions, and token structure point in the same direction.
Most traders fail because they treat strategy like a single insight. It isn't. It's a pipeline. Raw observations go in, tradable rules come out, and then live monitoring tells you whether the edge still exists.
A clean workflow also matters because machine-led decision systems now sit at the center of market structure. A 2024 paper discussed by the University of Edinburgh research publication notes that high-frequency trading accounts for almost half of equity trading volume. Different market, same lesson. Rules, data, and execution discipline aren't optional anymore.

I like to break the first half into input, cleanup, and idea formation.
A lot of DeFi traders skip this stage and go straight from wallet observation to live copying. That's usually where the slippage between “interesting” and “tradeable” starts.
The back half of the workflow decides whether a signal deserves capital.
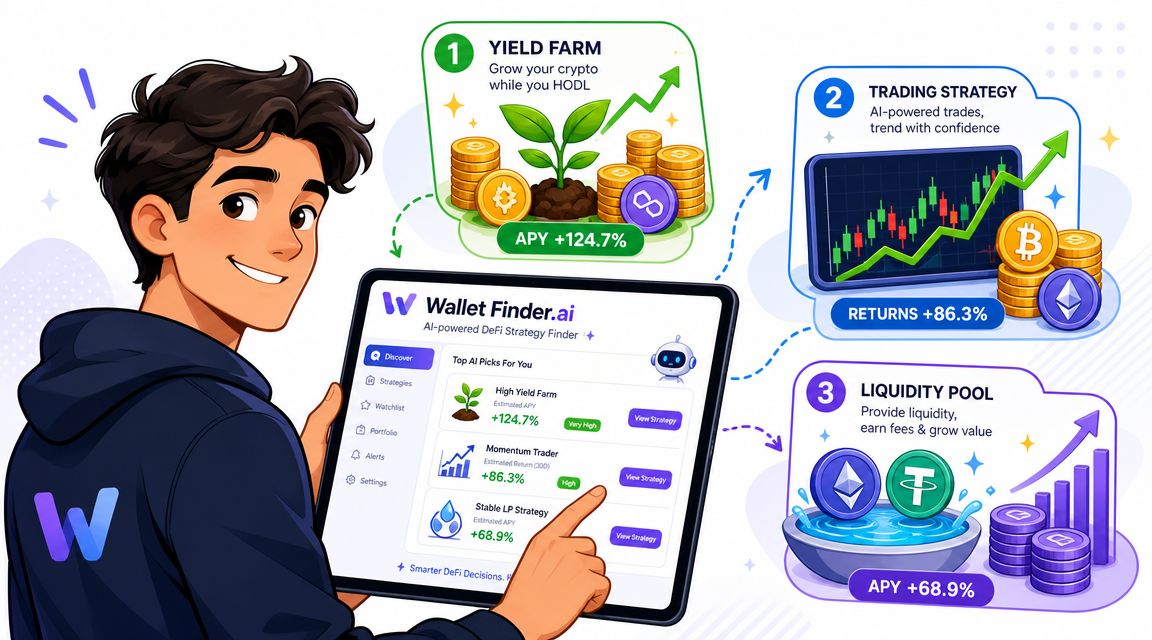
A tool can speed up discovery, filtering, and export. It can't think for you. Wallet Finder.ai fits the workflow where on-chain traders need structured wallet discovery, trade history, token discovery, alerts, and data export for deeper analysis.
Use tools to reduce manual searching. Don't use them as a substitute for hypothesis testing.
The strongest workflow is boring to watch. It ingests data, applies filters, rejects most setups, and acts only when the setup fits the model.
A profitable month doesn't prove a strategy works. It may only prove that market conditions were friendly. Evaluation starts when you ask whether the returns came from a repeatable process or a lucky stretch.
Most traders look at PnL first because it's easy to understand. PnL matters, but on its own it hides too much. You need a small set of metrics that explain quality, not just outcome.
Here are the core measures I use when reviewing a strategy:
A strategy with a high win rate can still be poor if one bad trade erases many small gains. A lower win rate can be acceptable if losses stay controlled and winners are allowed to run.
I don't evaluate any metric in isolation.
This is why review needs a bundle of metrics instead of a single vanity number. A strategy earns trust when the metrics agree with each other.
If a strategy looks amazing on one metric and mediocre on the rest, assume the weak metrics are telling the truth.
Use process discipline when reading results:
For a practical checklist of what to inspect, metrics for analyzing trading profitability can help organize your review process.
They confuse frequency with reliability. More trades don't always mean better evidence. In DeFi, repeated low-quality entries can create the illusion of activity while hiding poor selectivity.
The fix is simple. Measure what the strategy does when conditions are worst, not only when everything lines up. That's where durability shows up.
Theory gets useful when you can turn it into a daily operating routine. In DeFi, that usually means starting with wallet behavior, then deciding whether the observed pattern is strong enough to trade.
Here are three practical setups that on-chain traders use often.
This setup starts with wallet selection, not token selection. The goal is to find wallets that show repeatable behavior, then study how they enter, add, and exit.
A clean workflow looks like this:
What works here is selective copying. What doesn't work is mirroring every trade from every profitable wallet. Even strong wallets can have different liquidity access, speed, and risk tolerance than you do.
Large wallet activity can be informative, but only if you interpret it correctly. A big buy may signal accumulation. It may also be a rebalance, treasury movement, or setup for distribution into attention.
The process I prefer:
Traders' overreaction is a frequent occurrence. They see “whale bought” and enter instantly. Better traders ask whether the wallet has a reliable pattern and whether the market structure supports the trade.
A useful walkthrough sits well in video because you can see the filtering and review flow in sequence:
This is one of the more attractive use cases in DeFi because information diffuses unevenly. Some tokens show up in wallet behavior before they dominate social feeds.
The routine is straightforward:
A few practical notes matter here. Early doesn't automatically mean good. Many “early” tokens never mature into quality trades. The edge comes from finding early accumulation by wallets that have shown repeatable judgment, then waiting for enough confirmation that you're not just funding someone else's experiment.
Your article builds a rigorous decision framework around observable evidence, signal filtering, and defined entry conditions. The step it does not include — and that every quantitative trading guide treats as non-negotiable — is testing that framework against historical data before exposing real capital to it. Without this step, a process that feels systematic may be producing results that reflect the specific conditions of the period in which it was built rather than a genuinely repeatable edge.
Coin Bureau's backtesting guide frames the purpose clearly: backtesting turns instinct into rules and shows how a plan might have behaved through rallies, crashes, and calm periods. Crucially, it builds data-driven confidence before capital is at risk. The alternative — building a framework and immediately trading it with real money — conflates the learning period with the capital exposure period, which means every lesson learned during strategy development costs real money rather than time.
For the on-chain data-driven workflow your article describes, the backtesting process works differently from traditional price-chart backtesting but follows the same logic. Instead of replaying indicator conditions on historical OHLCV data, you replay your wallet selection and signal criteria against historical wallet activity. If your entry condition requires that a tracked wallet with a 75%+ win rate across 100+ trades enters a position before you follow, you can test that condition against six months of historical wallet data: identify every moment that condition would have been met, calculate what your hypothetical entry would have been, and calculate the outcome. That sequence — applied to many past instances — tells you whether your selection criteria produce positive expectancy across historical conditions, not just in the recent window where you first observed the pattern.
Cointester.io's February 2026 guide identifies three metrics as the minimum outputs a useful backtest should produce. Win rate tells you how often the entry condition led to a profitable trade. Profit factor — total winning trade value divided by total losing trade value — tells you whether the wins are large enough relative to the losses to produce net positive expectancy even at a win rate below 50%. And maximum drawdown tells you the worst peak-to-trough decline the strategy produced historically, which is the number that most directly informs position sizing and the capital level you need to survive the strategy's natural rough patches. A process that produces these three outputs from a historical test gives you a basis for calibrated confidence rather than untested conviction. The out-of-sample validation guide covers how to extend this basic backtest into a walk-forward validation process that is more resistant to the overfitting problem described in the next section.
Most weak data driven trading systems don't fail because the trader lacked data. They fail because the trader trusted the wrong version of the data, tested it poorly, or assumed live execution would look like the backtest.
That's fixable, but only if you know the traps.
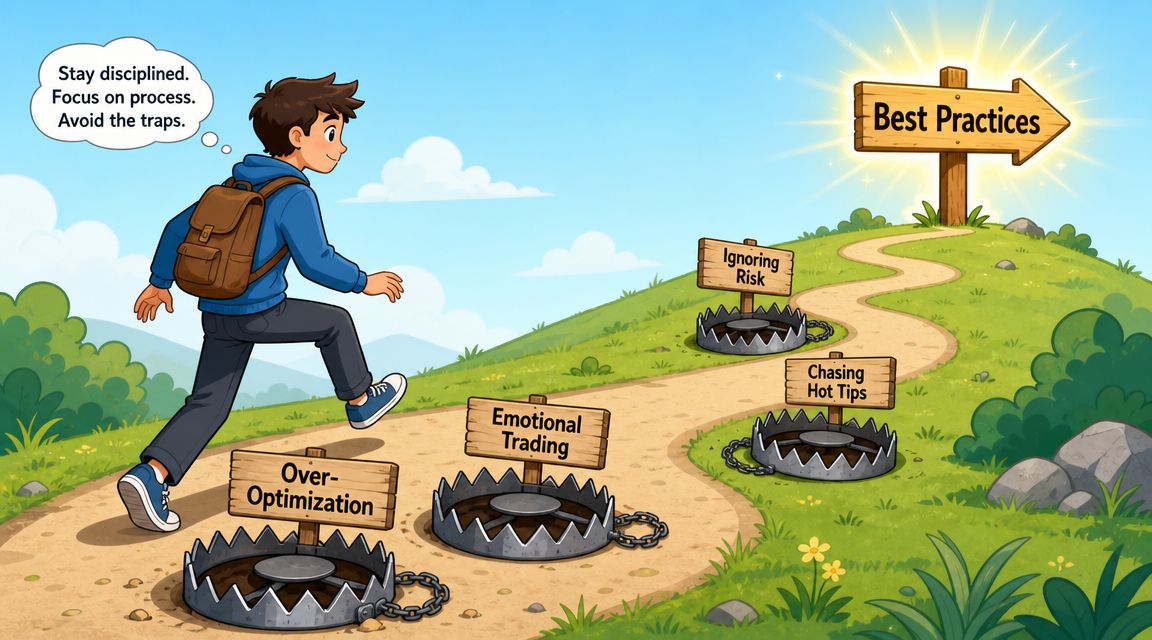
Overfitting happens when you tailor a strategy so tightly to the past that it stops generalizing. The backtest looks clean. Live trading looks confused.
Common signs include:
Best practice is to keep the logic simple enough that the economic intuition still makes sense. If you can't explain why the pattern should persist, don't trust the historical fit.
This is one of the most damaging mistakes because it can hide inside a strategy without obvious warning. You accidentally use information that wouldn't have been available at the time of the trade.
In DeFi, this often appears when traders analyze wallet profitability with knowledge of full future outcomes, then assume they could have selected those wallets in real time.
Treat every backtest like a live environment with limited information. If the model uses future knowledge, the result is fiction.
A strategy can be directionally correct and still lose money after slippage, routing issues, gas, and adverse fills. This is especially true in smaller-cap DeFi setups.
Use conservative assumptions:
I keep returning to the same discipline list because it works:
The traders who last aren't the ones with the most complex dashboards. They're the ones who distrust easy backtests and respect execution reality.
A trader finishes this article, opens five dashboards, watches twenty wallets, and learns almost nothing by Friday. The better start is smaller and stricter.
Pick one repeatable workflow and run it end to end. In DeFi, wallet behavior is usually the cleanest place to begin because the actions are visible and the review loop is fast. Wallet Finder.ai is useful here because it lets you monitor wallets, group activity into patterns, and review whether your idea held up in live conditions instead of staying at the theory stage.
Keep the scope tight.
The first milestone is not a profitable model. It is a process you can repeat without changing the rules every two days. Once that process is stable, you can widen the universe, add filters, and compare signal quality across different wallet clusters or token types.
If you want a practical starting point, set up one watchlist, define one alert condition, and review the results every day for a week. That is enough to learn whether your idea has shape, whether your rules are clear, and whether the signal is worth another round of testing.
No. Coding helps if you're building custom models or running deeper analysis, but it isn't a requirement for learning the process. A beginner can start by tracking wallet behavior, building simple filters, and reviewing repeated patterns manually.
The main skill is not programming. It's forming clear hypotheses and checking whether the evidence supports them.
No. The same principles work across timeframes. A short-term trader may focus on flow, timing, and execution quality. A swing trader may care more about wallet accumulation over days. A longer-term investor may use data to study conviction, rotation, and distribution behavior.
What changes is the holding period and signal design. The discipline stays the same.
You don't need large capital to begin learning the method. Start with paper trading or with small size that lets you observe your own execution without emotional pressure.
That approach teaches more than jumping in too large. You get to test whether your signal survives real conditions, whether you follow your own rules, and whether the setup still makes sense after friction.
Stop trying to predict every move. Start trying to build a process that produces acceptable decisions repeatedly.
That sounds simple, but it's the hardest adjustment for most traders. Once you stop needing certainty, you can focus on signal quality, risk control, and review. That's where real progress starts.
Data-driven trading is a decision-making approach that bases every trade on observable, measurable evidence rather than intuition, social signals, or emotional reactions to price movement. In DeFi specifically, it means defining what data inputs you will act on before a trade presents itself, measuring those inputs against pre-set conditions, and executing only when conditions are met — not when a chart looks exciting or a Telegram group is loud. The practical outputs of a data-driven process are a set of conditions that are either met or not met for any given trade, a track record that shows whether those conditions have historically produced positive expectancy, and a measurement system that tells you whether the process is improving or degrading over time. What it is not is a guarantee of profitability — it is a structure that makes improvement possible by separating what you controlled (the process) from what you did not control (the market's response).
A backtest replays your strategy's rules against historical data to estimate how it would have performed without risking capital. The sequence is: define your entry, exit, and position sizing rules precisely enough that another person or a program could follow them with no interpretation required; gather clean historical data for the assets and timeframes the strategy covers; apply the rules to the historical data and record every theoretical trade the rules would have generated; calculate the key outputs (win rate, profit factor, maximum drawdown, total return); and finally, test the results on a held-out period of data the rules were not developed on, to check whether performance holds. The last step — out-of-sample testing — is what separates a backtest that estimates genuine edge from one that produces an optimistic number by measuring performance on the same data used to develop the rules. For on-chain wallet analysis, the backtesting equivalent is applying your wallet selection criteria to historical wallet data and measuring whether the wallets that would have met your criteria historically produced the outcomes your forward expectation assumes.
The minimum threshold that appears consistently across quantitative trading guides is 100 completed trades before a strategy's metrics — win rate, profit factor, expectancy — carry meaningful statistical weight. Below 100 observations, the standard error of any measured win rate is wide enough that the true underlying rate could be anywhere from near chance to genuinely strong, and you cannot distinguish between them. The secondary consideration is condition diversity within those 100 trades: observations that all occurred during the same market regime are less informative than the same number of observations spanning bull phases, corrections, and sideways conditions. This applies both to backtesting your own strategy and to evaluating wallets as copy targets — the 100-trade minimum is a reliability threshold for any track record you intend to use as forward evidence.
Data-driven trading and systematic trading overlap significantly but are not identical. A systematic trader follows a fully specified rule set that determines every trade decision without discretionary override — the system either fires or it does not, and the trader executes accordingly. A data-driven trader uses observable evidence as the primary input to decisions but may retain discretionary judgment about whether conditions that technically meet the criteria actually make sense in context. The practical distinction is how much human judgment intervenes between signal and execution. Most DeFi traders who describe themselves as data-driven are somewhere between purely discretionary and fully systematic — they have defined what evidence they require but still make execution-level decisions about sizing, timing, and whether a specific signal in a specific context warrants action. Pure systematic trading in DeFi is complicated by execution friction, gas costs, and the non-stationarity of on-chain market microstructure — which is why most practitioner guides recommend a hybrid approach where rules govern signal identification and human judgment governs execution decisions.
The measurement that distinguishes a working process from one that merely feels rigorous is whether the forward performance of the process is consistent with what the historical backtest predicted — not whether you are making money in absolute terms. A market environment can produce profits from a poor process through favorable conditions, just as it can produce losses from a sound process through unfavorable ones. The honest signal that a process is working is that its key metrics — win rate, profit factor, and maximum drawdown — in live trading fall within the range the historical analysis suggested, over enough trades to be statistically meaningful. When those live metrics diverge significantly from historical expectations, the divergence signals either that market conditions have changed in a way that has broken the edge (which requires process revision) or that the historical analysis overfitted to conditions that no longer apply (which requires more conservative rules). The trading history analysis guide covers how to build the post-trade attribution process that makes this monitoring systematic rather than intuitive.
Wallet Finder.ai helps DeFi traders turn on-chain activity into a usable research workflow. You can track profitable wallets across major ecosystems, inspect trade histories, review PnL and win streak behavior, build watchlists, and get alerts when tracked wallets buy or sell. If you want to apply data driven trading principles with live wallet intelligence, start with the Wallet Finder.ai platform.

A premier DeFi analytics platform empowering traders to discover and analyze profitable blockchain wallets, trades and tokens.

