Trading History Analysis: A DeFi Trader's Playbook

Wallet Finder

Blank calendar icon with grid of squares representing days.

May 30, 2026

You've seen the wallet. It bought early, sold near the highs, and the dashboard shows a return that makes you want to copy every move from the next block onward.

That's where most traders get sloppy.

A wallet can look elite on a screenshot and still be a terrible copy-trading target. One lucky rotation into a memecoin. One oversized bet that happened to work. One week of perfect timing that hides months of churn, bad exits, or reckless sizing. If you only look at headline PnL, you're not analyzing a trader. You're reacting to an outcome.

Real trading history analysis is what separates signal from bait. On-chain, that means reading a wallet the way a discretionary PM or quant would read a track record: full trade set, holding behavior, sizing discipline, category focus, consistency, and how performance changes when conditions shift. A wallet's edge only matters if you can identify what produced it and whether that process is repeatable enough to follow.

Beyond the PnL The Need for Real Trading History Analysis

A common mistake in DeFi is treating a wallet like a tip channel. You find one huge winner, then assume every future trade from that address is worth mirroring. In practice, the first question isn't “How much did this wallet make?” It's “How did this wallet make it?”

That difference matters because raw profit hides ugly details. A wallet may have made most of its gains from one outlier trade while the rest of its activity was mediocre. Another may show strong realized profit but only because it never cut losers and happened to get bailed out by a market bounce. A third may be profitable, but impossible to copy because it trades illiquid pairs where your entry will always be worse.

Results without process are weak signals

When analysts work with long-run market data, the value comes from having enough history to compare behavior across cycles, not from staring at isolated charts. The CFA Institute notes that good U.S. stock and bond data series go back to the 1790s, and precise individual-stock daily data begin in January 1926, which is what makes nearly 100 years of comparative return history usable for serious analysis in modern datasets (CFA Institute on historical market data). The same logic applies on-chain. One trade tells you almost nothing. A full wallet history starts to tell you whether the trader has a method.

Don't copy a wallet because it had a big win. Copy only if its history shows a repeatable decision pattern you can recognize in real time.

That's why I care less about a flashy winner and more about the shape of the wallet's full tape. Does it keep taking the same kind of setup? Does it survive bad stretches? Does it perform only in one token niche, or across several market conditions? Those answers tell you whether you're looking at skill, luck, or heightened risk appearing as skill.

What hidden risk usually looks like

Most weak wallets fail one of these tests:

  • Survivorship bias: You found the wallet because it won. You didn't see the many similar wallets that disappeared.
  • Unsustainable risk-taking: The trader sizes aggressively, so the upside looks great until one bad trade wipes the curve.
  • One-hit dependence: A single outlier dominates the entire history.
  • Execution mismatch: Even if the wallet is good, your copy will be worse if you enter later or pay more in gas and slippage.

If you want a benchmark for what a healthier evaluation looks like, compare traders against a structured framework rather than isolated wins. A useful starting point is how to benchmark trading performance.

Laying the Foundation Goals and Data Gathering

You find a wallet that caught three early runners in a week. Before treating it as a copy-trading candidate, define what you are trying to prove. Are you screening for a wallet you can follow trade for trade, or a wallet that is only useful as a signal source for narratives and rotation timing? That decision changes what data you need and how strict your filters should be.

The mistake I see most often is mixing incompatible trader types into one bucket. A Solana meme wallet that flips positions in minutes should not be graded on the same standard as a Base wallet that scales into themes over several days. If your goal is to vet wallets for copy-trading, style fit matters almost as much as PnL. A good wallet with the wrong style for your execution will still produce bad copy results.

Define the wallet profile before you export anything

Start with a plain-English profile of the behavior you want.

  • High-frequency operator: Many trades, short holding periods, thin edge per trade, strong dependence on entry speed and fees.
  • Narrative swing trader: Fewer trades, longer holds, stronger token selection, more exposure to trend shifts.
  • Conviction accumulator: Adds repeatedly to related positions, often shows sector insight, can hide poor exits behind strong entries.
  • Event-driven trader: Trades around launches, listings, release events, migrations, or major news, often profitable only in specific conditions.

That profile tells you what deserves attention. For a fast trader, I care about whether the wallet can repeat small wins after costs and whether late followers would still have room. For a swing wallet, I care more about how early it enters, how long it can sit through noise, and whether the gains came before broad attention showed up.
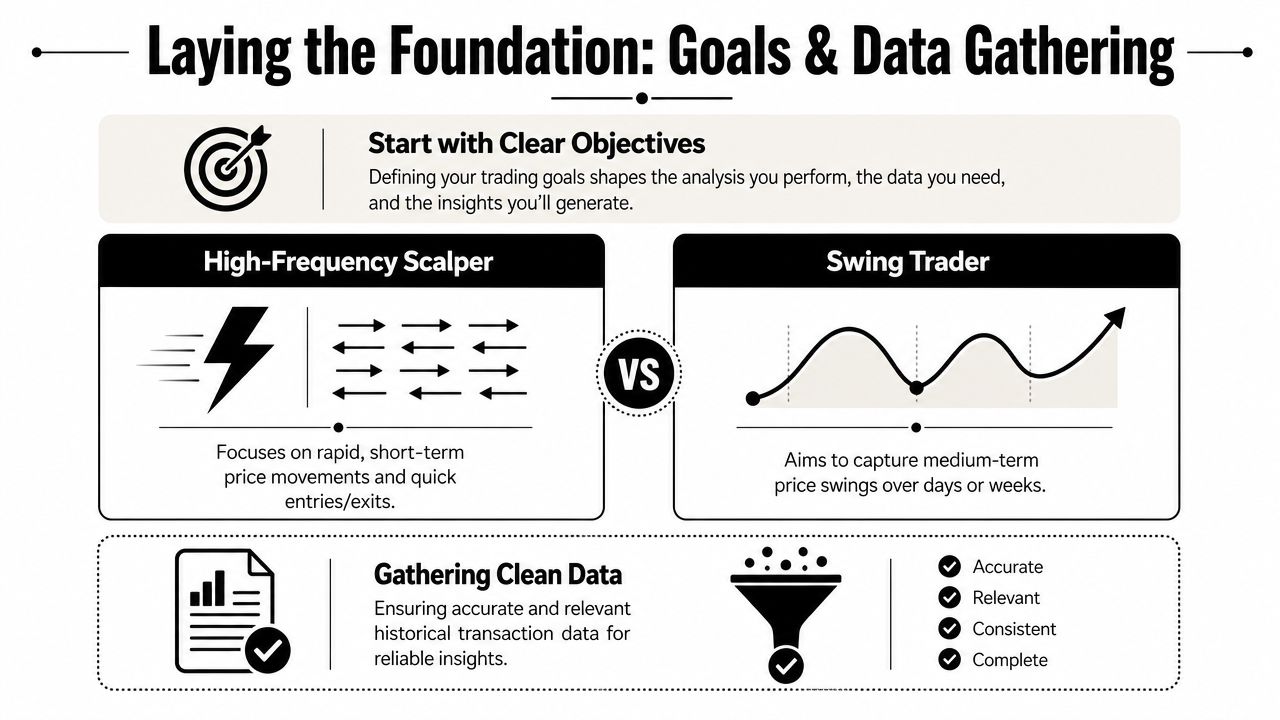
A professional infographic titled Laying the Foundation for trading, comparing high-frequency scalpers and swing traders.

Gather trade data that reflects intent, not just movement

Raw wallet history is messy. Explorer exports usually mix swaps, transfers, bridge activity, approvals, LP actions, claims, and contract interactions into one timeline. If you treat all token movement as trading, your review breaks before you calculate a single metric.

The job is to isolate intentional directional trades.

Separate these buckets early:

  • True entries and exits: Swaps that opened or closed exposure in a token.
  • Wallet operations: Transfers between owned wallets, bridge deposits, approvals, and routing transactions.
  • Non-trading flows: Airdrops, staking rewards, LP adds or removals, farming claims, vesting receipts, token migrations.

This sounds basic, but it is where copy-trading analysis usually goes wrong. Transfer-ins can look like buys. Claimed tokens can look like profitable entries at zero cost. Partial exits can disappear if the parser only tracks final balances. Once those errors get into the sheet, every later metric becomes less trustworthy.

Collect the fields that let you reconstruct the trade

For each position, gather enough detail to answer two questions. What did the wallet do, and under what conditions did it do it?

At minimum, keep:

  • Identity fields: Wallet address, chain, token contract, token symbol, trade or position ID.
  • Timing fields: Entry timestamp, exit timestamp, and transaction hashes tied to both sides.
  • Execution fields: Token amount, average entry price, average exit price, fees, gas, and slippage if available.
  • Context fields: Setup tag, token category, market regime, catalyst or event label.
  • Outcome fields: Realized PnL, realized status, and remaining balance if the position is still open.

If you plan to compare many wallets side by side, standardize these columns from the start. Wallet Finder.ai is useful here because its main advantage is consistent parsing across wallets. Consistency matters more than convenience. If one wallet treats bridges as trades and another does not, your ranking is already distorted.

A good follow-up framework is this guide to profitability metrics for analyzing trading performance, but the metrics only work if the trade log is clean first.

Practical rule: If you cannot explain why a token entered the wallet, leave it unclassified until you can.

Manual review still has a place

For a small watchlist, manual review is often the fastest way to catch bad assumptions. You can inspect the transaction sequence, verify whether buys were intentional, and spot patterns a parser may miss, such as linked wallets or repeated farming behavior disguised as trading.

At scale, manual work stops being reliable. It gets slow, inconsistent, and biased toward memorable wallets. A structured workflow is better for screening, ranking, and rechecking wallets on the same rules. That matters if the goal is not just to analyze a trader after the fact, but to decide whether that wallet is worth following before the next trade happens.

From Raw Data to Real Insights Calculating Key Metrics

A wallet can show a huge realized profit and still be a bad copy-trading candidate.

That usually happens when the headline number hides the part that matters. The trader may win with size you cannot mirror, hold through drawdowns you will not tolerate, or rely on timing that falls apart once you enter a few blocks later. Raw history has to be converted into metrics that answer a practical question. Is this wallet repeatable for a follower?

Trading history analysis is a statistical process. FXCM notes that historical analysis measures behavior through variables such as price, volume, open interest, and volatility, using common chart inputs like open, high, low, and close values. It also shows how traders use rules-based thresholds to frame exits and risk, rather than relying on a story about why price moved (FXCM on historical data analysis). The same discipline applies to wallet vetting. Read the trader as a set of repeated decisions.

The dataset blueprint

If the export misses key fields, the metrics will be weak or misleading. You need enough structure to reconstruct each closed position, its cost, and the time it stayed on risk.

Exportable Trade History Dataset Blueprint
Trade_IDAsset_SymbolChain
Entry_TimestampExit_TimestampAvg_Entry_Price_USD
Avg_Exit_Price_USDQuantityTrade_Value_USD
Net_PnL_USDFees_Gas_USD

That table supports most of the screening metrics used to compare wallets side by side. For a broader scoring framework, use these profitability metrics for analyzing trading performance as a companion reference.

Win rate shows how often the wallet closes green

Formula:
Win Rate = Winning Trades / Total Closed Trades

Win rate is useful, but only if you keep it in bounds. It answers one question. How often does this wallet finish a trade with a profit?

It does not tell you whether the trader manages risk well. Many weak wallets keep win rate high by taking small gains fast and refusing to close losers. In on-chain records, that pattern often appears as a stream of minor wins next to a few oversized bags that stay open for weeks.

Use win rate as a style marker.

  • High win rate: often means fast profit-taking, selective entries, or both.
  • Low win rate: can still work if the wallet's winners are much larger than its losers.
  • Misleading win rate: usually comes from incomplete realization, where open losses are still sitting outside the score.

Profit factor is better for vetting edge

Formula:
Profit Factor = Gross Profit / Gross Loss

If I am screening wallets for followability, profit factor gets attention before win rate. It measures whether the trader makes enough on good trades to cover bad ones and still leave room for fees, slippage, and slower follower execution.

That matters in copy-trading because followers almost always get worse entries and exits than the source wallet. A trader with a thin edge on paper may have no edge at all once execution drifts. A trader with healthy profit factor has more room for error.

A wallet that wins often but gives back too much on losses is fragile. One late entry from the follower can wipe out the advantage.

Max drawdown tells you whether the wallet is survivable

Formula:
Max Drawdown = Largest peak-to-trough decline in cumulative equity

This metric filters out a lot of impressive-looking wallets.

A trader can post strong total returns after sitting through brutal equity drops. That may be acceptable for the original wallet owner. It is a poor fit for someone trying to follow signals in real time with less conviction and worse fills. Drawdown is not just about risk. It is about whether the process can be copied by a second person under stress.

Look at max drawdown in context:

  1. A deep drawdown may reflect concentration, poor exits, or both.
  2. A shallow drawdown can signal discipline, but it can also come from a short sample.
  3. A wallet with repeated sharp drawdowns usually demands perfect timing from followers.

Average hold time tells you what kind of trader you are looking at

Formula:
Average Hold Time = Sum of trade durations / Number of closed trades

Hold time is one of the fastest ways to stop misclassifying a wallet. It separates a trader who reacts to intraday flow from one who is trading a multi-day narrative.

That distinction matters for copy-trading. Short-hold wallets are harder to mirror because small execution delays can change the entire trade. Longer-hold wallets usually leave more room, though they also expose you to overnight or multi-day risk.

A simple read works well here:

  • Very short holds: momentum trading or scalp behavior. Harder to copy cleanly.
  • Moderate holds: swing trading around narrative, breakout, or rotation setups.
  • Long holds: conviction-based positioning, often easier to follow if liquidity supports exits.

Average winner versus average loser shows trade management

Formula:
Average Winner = Total profit from winners / Number of winning trades
Average Loser = Total loss from losers / Number of losing trades

This pair explains a lot of what win rate hides. If average winners clearly exceed average losers, the trader usually lets strong positions work and cuts weak ones before they become account damage. If average losers are larger, the wallet may still be profitable for a while, but the process depends on favorable conditions continuing.

This is also where copy-traders get into trouble. A wallet with small average winners and large average losers often requires precise entries to stay profitable. Followers rarely get that precision. Wallets with the opposite profile tend to be more forgiving.

Good wallet analysis is not about finding the biggest PnL number. It is about finding a trading record that still makes sense after you account for latency, slippage, sizing differences, and the fact that you are studying someone else's behavior, not your own.

Reading Between the Trades Advanced Analysis Techniques

The strongest wallets leave behavioral fingerprints. You won't find them in headline PnL alone.

A professional trader analyzes behavioral signals and market insights using a digital dashboard and magnifying glass.

A wallet's transaction history tells you what it bought and sold. The pattern across those trades tells you what kind of person is behind the wallet. That matters because copy-trading is really behavioral imitation under worse execution.

Position sizing exposes discipline fast

You can learn a lot by watching how the trader sizes entries relative to the rest of the wallet.

A disciplined wallet usually scales size with conviction and liquidity. It may start small, add when the thesis confirms, and avoid making every idea portfolio-defining. A reckless wallet tends to do the opposite. Huge first clips, little consistency, and a habit of turning one narrative into a full-account bet.

Look for these clues:

  • Stable sizing across similar setups: usually means the trader has process.
  • Huge variation without a clear reason: often means impulse or emotional trading.
  • Size increases after wins: can signal confidence, but also tilt.
  • Tiny exits after big entries: can mean the trader scales out well, or can't get out cleanly.

Entry and exit timing show whether the wallet leads or follows

A wallet that repeatedly buys after vertical candles is often just chasing strength. It may still make money in hot conditions, but it usually degrades when the market stops forgiving late entries.

A more interesting wallet often shows one of these patterns:

BehaviorWhat it usually means
Early entries before broad attentionBetter discovery process or stronger conviction
Staggered entries into weaknessDeliberate accumulation
Fast exits into strengthTactical trader protecting gains
Gradual exits after trend extensionTrader understands liquidity and distribution

I care especially about whether entries happen before the crowd notices the token. If a wallet is always late, you'll be even later. That makes it a poor copy target even if the historical PnL looks strong.

Good wallets don't just buy good tokens. They buy them at times that leave room for someone else to still be wrong.

Category focus matters

Some wallets only work in one lane. That isn't a flaw. It's often a strength.

A trader may understand memecoin flow thoroughly and still be bad at DeFi governance tokens. Another may trade infrastructure names well but fail badly in thin, hype-driven launches. When you map activity by token category, you start seeing their real circle of competence.

This kind of review is easier when you slow down and inspect examples visually. The clip below is useful as a companion while you study wallet behavior and market structure.

Build a behavioral profile, not just a score

The goal of advanced trading history analysis isn't to produce one magic number. It's to answer practical questions:

  • Can this wallet handle drawdowns without losing structure?
  • Does it buy with intention or react emotionally?
  • Is the edge selection, timing, sizing, or category expertise?
  • Could you realistically follow this style with your own latency and size?

Once you can answer those, you stop treating wallets like leaderboards and start treating them like strategies.

From Analysis to Action Finding and Following Top Wallets

A wallet posts a strong six-month PnL. You add it to a watchlist, copy the next two buys, and both trades go against you before the original trader exits green. That usually means the analysis was incomplete. The wallet may be profitable, but still a poor fit for your speed, size, or holding window.

The job here is to turn wallet review into a repeatable selection process. For copy-trading and trader vetting, that means filtering for followable behavior, not just attractive outcomes.

Filter for enough history to matter

Start by throwing out wallets with too little closed history. A handful of wins can come from one hot streak, one regime, or one lucky cluster of entries. As noted earlier, small samples break fast once market conditions change.

A first-pass screen should answer four questions:

  • Is there enough closed-trade history to judge behavior?
  • Has the wallet stayed active across more than one market phase?
  • Do the core metrics agree with each other, or does one flashy number hide weak trade quality?
  • Can you realistically follow the style with your own reaction time and size?

That last point removes a lot of false positives. A wallet can be skilled and still be useless to copy if it trades too early, exits too fast, or operates in pools where your fills will be worse.

A five-step infographic showing how to analyze, track, and act on crypto trading wallet strategies.

Build a watchlist with clear roles

One undifferentiated list creates noise. Split wallets by what they are good for.

For example:

  • Discovery wallets: Early entrants that surface new names before broad attention arrives.
  • Confirmation wallets: Traders who join after momentum starts but before the trade gets crowded.
  • Exit-signal wallets: Wallets whose selling behavior is worth tracking because they distribute well.
  • Specialist wallets: Traders with repeatable results in one chain, category, or setup type.

Copy-trading is not one workflow. A discovery wallet may be useful for research but terrible for blind copying. An exit wallet may never give you entries, but can save you from overstaying a position.

If you want to organize that process at scale, Wallet Finder.ai's smart money tracker helps sort wallets by behavior, inspect historical trades, and keep role-based watchlists. Manual review across explorers and spreadsheets still works. The standard matters more than the tool.

Set alerts, but keep the decision rule manual

Alerts are useful after the wallet has earned a place on your list and after you know what activity matters. Without that work, every ping becomes a fresh judgment call.

Useful alert conditions usually include:

  • Fresh buys from wallets you already trust
  • Cluster buying from several watched wallets
  • Sales from wallets you treat as strong exit indicators
  • Activity inside token categories you already follow

The alert is the start of the review, not the end of it. Check whether the trade matches the wallet's historical pattern, whether liquidity still supports a decent entry, and whether the setup still leaves room for followers.

Execution note: If you cannot explain why the trade fits the wallet's historical edge, skip it.

Why copied results usually trail the original wallet

New copy traders often pick the right wallet and still get worse results. The gap is usually mechanical, not analytical.

FrictionWhy it hurts copy traders
SlippageYour fill is worse, especially in thin pairs
Gas feesRepeated small trades become less attractive
MEVYou get picked off or filled after the edge has faded
DelayEven short lag changes entry quality a lot
Size mismatchA wallet can scale differently than you can

This is why vetting other traders matters more than ranking them. Some wallets are highly profitable because they move first, route size better, or operate with a level of speed you do not have. Those wallets deserve respect, but not your capital.

The best copy targets are often a tier below the flashiest names. They enter with enough conviction to matter, but not so fast that followers are instantly disadvantaged. They hold long enough for a second buyer to still get paid. They also trade in categories where execution remains manageable.

That is the practical end state. Build a short list of wallets whose edge survives your real constraints, then follow them with discipline instead of admiration.

Conclusion Becoming a Smarter On-Chain Analyst

A wallet prints a headline win, copy traders rush in, and the next few trades disappoint. The problem usually starts in the review process. A quick glance at PnL is not enough to judge whether a trader is worth following.

Good trading history analysis asks harder questions. Is there a repeatable edge in the wallet's entries, exits, sizing, and market selection? Is the history long enough to separate skill from a hot streak? Can a follower with slower execution, smaller size, and higher friction still get acceptable results?

That is the standard that matters for copy-trading.

A practical workflow stays plain. Start with the wallet type you want to study. Pull clean data across enough trades to see behavior under different conditions. Calculate the core metrics that show hit rate, payoff asymmetry, holding profile, and drawdown pressure. Then examine the parts that usually get missed: concentration, timing consistency, reaction to losses, and whether the wallet's edge survives after entry lag and fees.

Keep one final rule in place. Reserve part of the history as a blind test, then judge the wallet on data you did not use to form the thesis. As noted earlier, live performance usually comes in worse than the clean historical version. Any wallet that only looks good under perfect hindsight is not a copy target. It is an example of why vetting matters.

This skill gets sharper with repetition. After enough reviews, weak patterns stand out fast. You notice the wallet that wins big in one narrow burst and then churns. You spot the trader who scales too aggressively after gains. You learn to separate real process from lucky timing.

If you want to turn that review into a repeatable workflow, Wallet Finder.ai helps you inspect wallet histories across chains, filter for the traits you care about, build watchlists, and monitor activity in real time so you can vet wallets before you follow them.