
Recovery Factor Calculation for Smart Traders
Master the recovery factor calculation to measure a strategy's resilience. Learn the formula, see DeFi examples, and find top wallets with Wallet Finder.ai.

June 20, 2026


Wallet Finder
February 3, 2026
When you see a token's price on an app, what are you really seeing? In the chaotic world of DeFi, that number is never a single, fixed truth. The true market price is a consensus—an ever-shifting average of an asset's worth across dozens of exchanges at any given second.
It’s the price you’d actually get if you tried to execute a trade right now, with all the market’s volatility and liquidity quirks baked in. It's almost always different from the last price someone else paid.
Imagine a massive farmers' market with dozens of stalls selling the exact same apples. One sign reads $1.00 per pound, another says $1.05, and a small cart in the corner has them for $0.95. So, what's the "true" price?
It’s not just one of those numbers. The real price depends on how many apples you want to buy and how many each vendor has. You can’t just clear out the cheapest stall without the price jumping up. The true cost is a blend of all available prices, weighted by the supply at each stall.
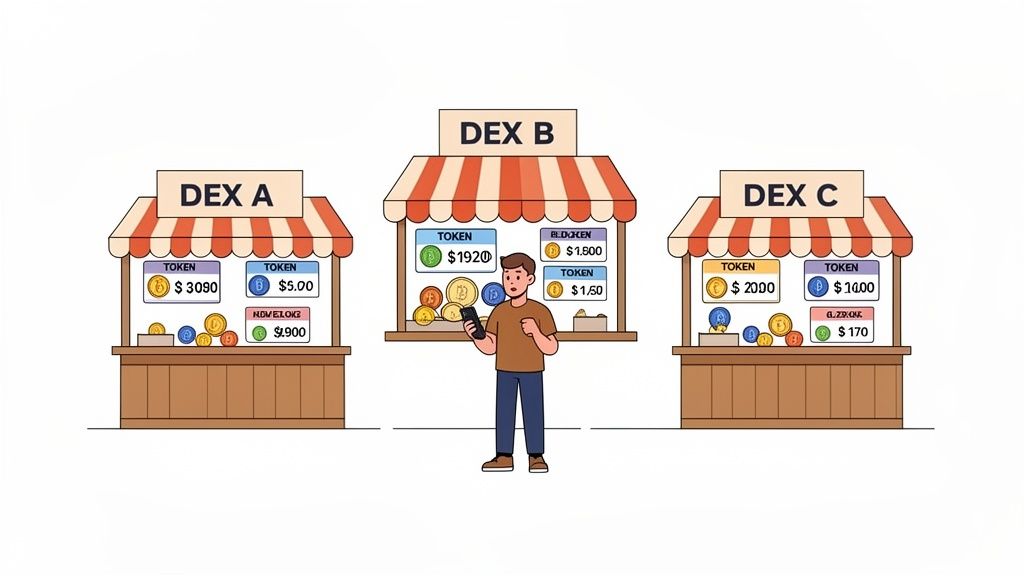
This is precisely what happens in Decentralized Finance (DeFi). A token's price on Uniswap will almost certainly be a fraction of a cent different from its price on SushiSwap. These aren't mistakes; they are the natural outcome of each platform operating as its own micro-economy with unique supply and demand dynamics. Understanding this is your first step to becoming a smarter trader.
The "last traded price" you see on an aggregator is just a snapshot of a past event—a single trade that's already over. The price you can actually execute at is constantly being pulled and pushed by forces that most traditional finance traders never deal with so directly.
A few key factors are always stirring the pot:
The big takeaway is that every DEX is its own micro-economy. The true market price isn’t a number beamed down from a central authority. It’s a messy, decentralized consensus you can only find by comparing these little economies in real time.
So, how do you find the true market price? You start by understanding the different ways a "price" can be reported. Each metric gives you a piece of the puzzle, but none shows you the whole picture on its own.
Here's a quick rundown of common price metrics and why you can't trust any single one completely.
Each of these numbers has a purpose, but relying on just one is like trying to navigate with only a single star in the sky. To trade effectively, you must learn to read them all together to approximate where the true market price really is.
Relying on the "last traded price" is like driving by only looking in your rearview mirror. It tells you where you've been, but it's a terrible way to figure out where you're going. This single number, splashed across every exchange, is just a historical data point. It tells you nothing about the living, breathing market dynamics of right now.
A single massive trade can paint a completely false picture. Imagine a low-liquidity token where one whale dumps their entire bag. The last traded price might crater by 30%, but that fire sale has nothing to do with the coin's real value. Moments later, arbitrage bots will likely swoop in, the price will snap back, and that "last price" becomes a meaningless blip.
Different ways of measuring price offer different angles on an asset's value, but every single one has a blind spot. Nailing down which one to use, and when, is a critical skill. No indicator tells the whole story on its own, but learning to read them together gives you a much clearer picture.
Here are the usual suspects you'll run into in DeFi:
Relying on any single price metric is like diagnosing an illness with just one symptom. A trader needs to synthesize multiple data points to get a clear and accurate picture of an asset's true market price.
So, how do the pros handle this, especially when they need to move serious capital? They don't just slam the "market buy" button. They use execution strategies designed to leave the smallest footprint and land a price much closer to the asset's stable, true value.
Two of the most common methods are TWAP and VWAP.
By adopting this critical mindset—questioning every price and understanding the tools used to find a stable average—you can see past the noise and get much closer to an asset's true market price.
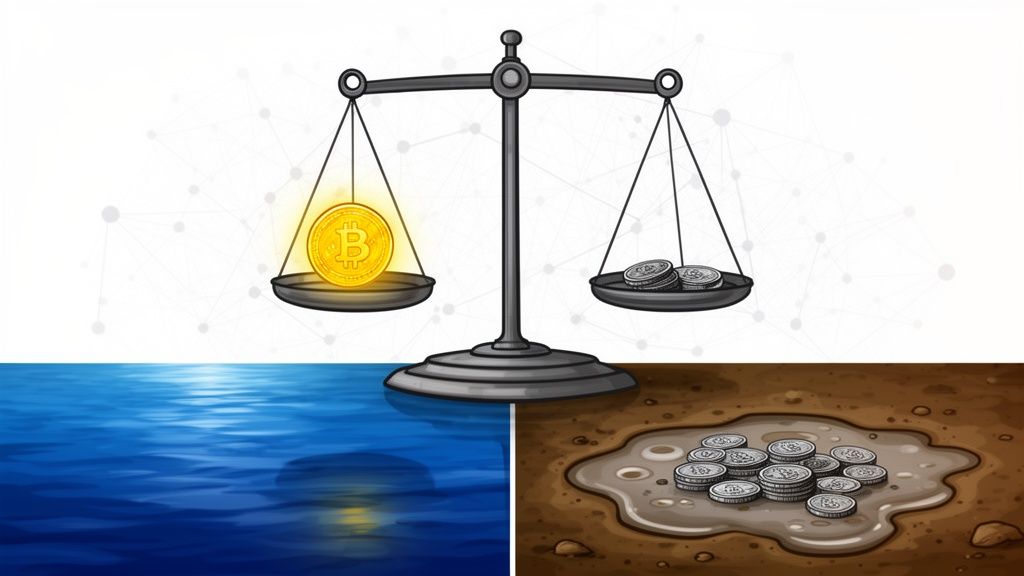
Price discrepancies in crypto aren’t just random glitches. They're usually caused by specific market forces that create opportunities for traders who know what to look for. The single biggest factor driving these differences is liquidity. Getting a grip on how it works is your first step to finding an asset's true market price and avoiding painful losses.
Think of it like a shallow puddle versus a deep lake. A big splash in the puddle—your large trade—will create massive waves. That same splash in a deep lake barely causes a ripple. The puddle is a low-liquidity market, and the lake is a high-liquidity one.
This map breaks down the most common ways price is measured, from backward-looking stats to real-time calculations.
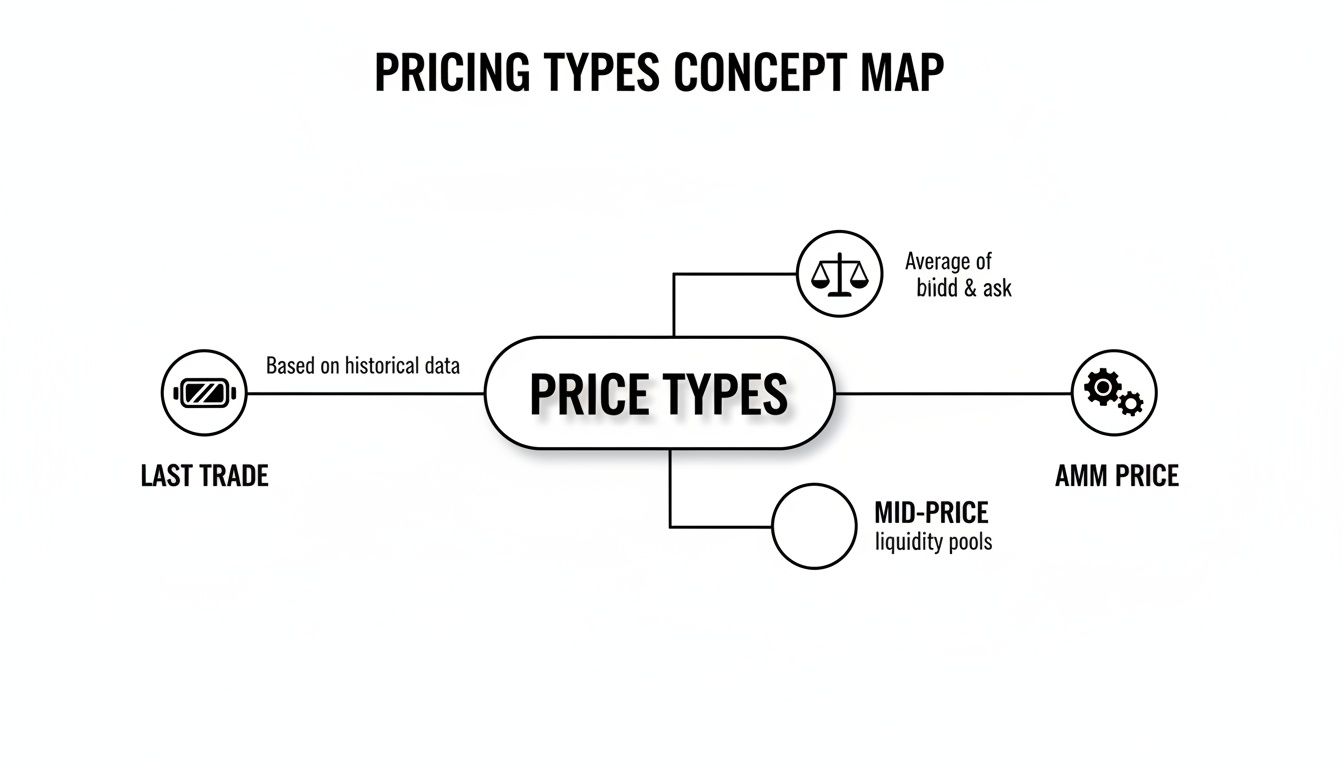
As you can see, each metric gives you a different angle. It’s a good reminder that a single data point is rarely the full story when you’re trying to pin down an asset's real value.
In DeFi, that "splash" has a name: slippage. It’s the gap between the price you expect to get and the price you actually get. When a market has low liquidity, your own trade can shove the price against you simply because there aren't enough buyers or sellers on the other side to absorb your order.
Here’s a step-by-step breakdown of how it happens:
This price jump is a direct consequence of low liquidity. The true market price is always most reliable where the "lake" is deepest—where liquidity is real and plentiful.
The core lesson is simple: a token's price is only as reliable as its liquidity is deep. Always check the liquidity behind a price before you trust what you see on the screen.
Beyond natural market quirks, some people actively manipulate prices to fool other traders. One of the oldest tricks is wash trading, where someone simultaneously buys and sells the same asset to create the illusion of high trading activity.
This fake volume makes a token look more popular and liquid than it is. One study found that up to 70% of volume on unregulated exchanges showed clear signs of wash trading.
Wash traders do this for a few nasty reasons:
This is exactly where copy trading becomes your best defense. Instead of chasing phantom volume, you can track the wallets of consistently profitable "smart money" traders. These pros are masters at sniffing out where the real trading is happening.
By following their moves, you align your strategy with genuine market activity, not fabricated hype. Tools like Wallet Finder.ai are built to help you cut through this noise, showing you where the real money is flowing to find a much more accurate true market price.
Knowing the theory behind asset pricing is one thing. Turning that knowledge into a profitable trading playbook? That’s where the real work begins.
The secret is learning to read the raw data on the blockchain itself. This lets you pinpoint mispricings and arbitrage opportunities in real time, often before the rest of the market. It’s about moving beyond pretty charts and digging into the public ledger. The blockchain doesn’t hide its secrets; it just records everything. Smart traders learn to read these records like a map.
To find an asset's true market price, you have to follow the money. That means watching large token movements, figuring out where trading volume is concentrated, and tracking funds flowing into key smart contracts.
These aren't just random events; they often happen right before a major price swing:
Think of these as actionable intel. By setting up alerts for these kinds of transactions, you can get in front of moves that most retail traders only see after the fact.
For copy traders, these on-chain signals are the ultimate cheat sheet. Instead of just blindly following a wallet, you can analyze why their trades are making money. This flips copy trading from a gamble into a data-driven strategy.
Here’s a simple, four-step workflow to get started:
The goal isn’t just to copy trades. It's to understand the market inefficiencies the best traders exploit. By analyzing their on-chain footprint, you learn to see the market through their eyes, spotting opportunities to buy below or sell above the perceived true market price.
Spotting price gaps is the fun part. Acting on them comes with risks that can vaporize a potential profit in seconds. Arbitrage is a game of speed and razor-thin margins.
The crypto market’s volatility is a constant reminder of how fluid the true market price is. Just look at Bitcoin’s wild ride from $800 in December 2016 to a $20,000 peak in 2017, only to crash 85% to $3,100 a year later. These cycles are a goldmine for traders who know what they're doing. In 2021, top Ethereum wallets posted 1,000%+ returns by timing their entries with on-chain signals, while traders flying blind in 2022 averaged -70% losses. You can explore the history of these market cycles on CoinMarketCap.
Before you jump on an arbitrage trade, keep these critical factors in mind:
Knowing what creates price gaps is one thing. Actually acting on that knowledge takes the right tools. Raw on-chain data is a firehose of noise, making it almost useless on its own. This is where Wallet Finder comes in, turning that chaos into your personal trading edge.
The goal is simple: spot opportunities to capitalize on the true market price before everyone else piles in.
Wallet Finder is built to cut through that noise. It doesn't just show you what is happening on-chain, but who is making it happen. When you zero in on the moves of consistently profitable traders, you’re basically borrowing their market instincts and seeing the same openings they do.
First, you need to find traders who actually know what they're doing. This is what Wallet Finder’s 'Discover Wallets' feature was built for. It lets you sift through the entire on-chain universe to find wallets that meet specific, high-value criteria.
Here's an actionable checklist to find "smart money" wallets:
This process spits out a clean, curated list of traders with a proven, repeatable skill for navigating messy markets. You can then dive deep into any wallet's full transaction history and see their entire playbook.
By spotting these patterns, you're essentially reverse-engineering their entire process for finding and acting on a token's true market price. You're getting execution insights that a simple price chart could never show you.
Insights are great, but in DeFi, timing is everything. An opportunity to buy a token 5% below its perceived market price might only exist for a few minutes. This is where Wallet Finder connects the dots between your analysis and your next trade.
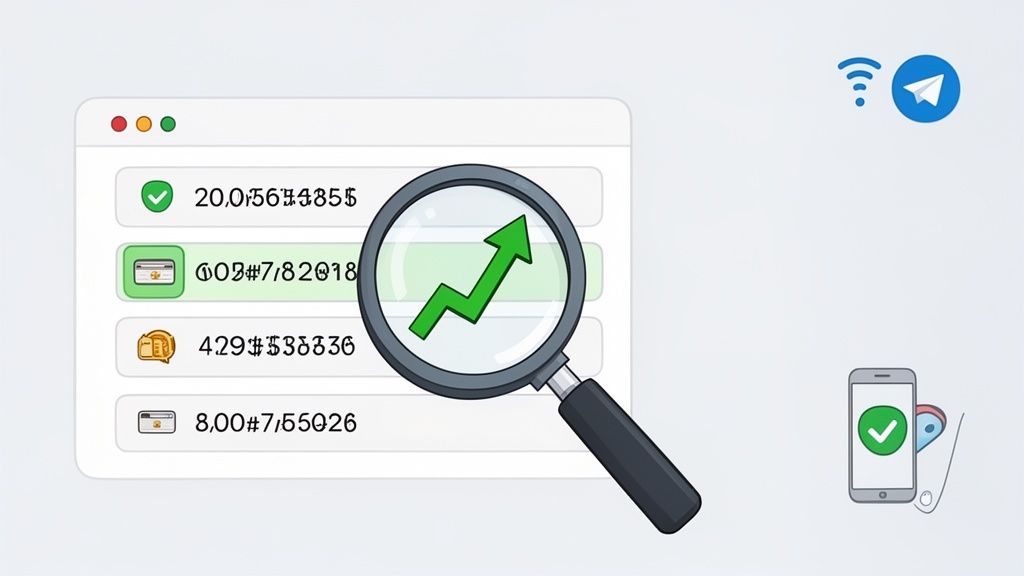
The platform's real-time alerts are the trigger that turns your research into a potential trade. By understanding a top wallet's strategy, you can position yourself to act on the same signals they do, but without having to manually watch the blockchain 24/7.
After you've identified a few elite wallets worth following, you can set up instant Telegram and push alerts. The second one of these wallets makes a move, you'll know.
This workflow is incredibly powerful. You've already done your homework by finding a profitable trader and figuring out their strategy. The alert system becomes your personal Bat-Signal, telling you that a trader you trust just found a price discrepancy worth pouncing on.
It’s a direct line to smart-money action, letting you move with precision the moment an expert finds a deviation from the true market price. You can see how to build your own system by starting with the tools available on Wallet Finder.ai.
When you're trying to navigate DeFi pricing, a few key questions always pop up. It makes sense—the idea of a single "true market price" is slippery in a world this fast and fragmented. Let's break down some of the most common hurdles traders face.
It's tempting to glance at Coinbase or Binance and call it a day, but that price doesn't tell the whole on-chain story. A centralized exchange (CEX) price is just a reflection of its own internal order book—a walled garden, separate from the DeFi ecosystem.
The real market price in DeFi is hammered out across countless decentralized platforms, shaped by the raw forces of liquidity pools, slippage, and AMM math. Those gaps between the CEX price and the actual on-chain executable price are exactly where the best arbitrage opportunities live. If you only look at the CEX number, you're blind to the very environment where the sharpest DeFi traders make their money.
If you have to pick one thing, it's liquidity depth. No question. An asset's price is only as real as the capital backing it up.
Think of it like this:
The most trustworthy price will always be found where the liquidity is deepest. Everything else is just noise until it's backed by serious, active capital.
A price without deep liquidity is just an opinion. A price backed by significant capital is a market-wide conviction.
Your best defense is simple: trust the blockchain, not the hype. Ignore the inflated volume charts on sketchy sites and the breathless posts on social media. Scammers can easily fake volume with wash trading, but they can't fake the on-chain footprint of smart, profitable wallets that consistently pull value from the market.
Instead of chasing noise, focus on genuine wallet activity. See where the smart money is actually moving. Check the liquidity conditions across several different DEXs before you even think about making a trade. By following the real flow of capital, you can sidestep the manufactured hype and get a much clearer picture of what an asset is truly worth.
Ready to stop guessing and start seeing the market like a pro? Wallet Finder.ai gives you the tools to track smart money, analyze on-chain data, and receive real-time alerts on winning trade strategies. Find your edge and act on real signals by visiting https://www.walletfinder.ai to start your free trial.

A premier DeFi analytics platform empowering traders to discover and analyze profitable blockchain wallets, trades and tokens.

