
Recovery Factor Calculation for Smart Traders
Master the recovery factor calculation to measure a strategy's resilience. Learn the formula, see DeFi examples, and find top wallets with Wallet Finder.ai.

June 20, 2026


Wallet Finder
February 15, 2026
Figuring out your crypto profit seems simple: just subtract what you paid from what you sold for. But the actual cost of a trade goes far beyond the initial price. Hidden expenses like trading fees, network gas, and slippage can take a serious bite out of your gains, turning a "win" into a loss if you're not careful. This guide provides the formulas and actionable steps you need to see your real gains.
Before you can calculate profit on any trade, you must understand all the costs that quietly eat away at your returns. It's a classic rookie mistake to just look at the buy and sell price. That simple math completely ignores the hidden expenses that determine what you actually take home.
Trust me, ignoring these costs can quickly turn what looks like a winning trade into a surprising loss. These aren't optional fees; they're part of transacting on any blockchain or exchange. Getting this right is the first step toward accurate profit and loss (PnL) tracking and making smarter trades.
Every trade comes with key expenses you must factor in. While some are small percentages, they add up fast, especially if you're an active trader.
Here are the main costs you can't afford to overlook:
A huge mistake I see all the time is traders only subtracting the trading fee they see on the exchange. Forgetting to account for a $45 gas fee on an Ethereum swap or 2% slippage on a low-liquidity token can completely throw off your profit calculation.
Let's walk through a real-world example. Say you decide to swap 1 ETH (worth $3,500) for a hot new token on Uniswap. The platform gives you an estimated return, but by the time your trade actually goes through, you've paid $50 in gas and lost another $30 to slippage.
Suddenly, your real cost isn't $3,500—it's actually $3,580. To make any profit, that new token must now climb high enough to cover that more expensive entry point. It's that easy for a trade that looked great on paper to start in the red.
Now that you’re wise to the hidden costs, it’s time for the core math. This isn't just theory—it's the toolkit every serious trader uses to distinguish between paper gains and actual, bankable returns. Mastering these simple formulas is what separates guessing from knowing your real performance.
The first concept you must nail is Realized PnL (Profit and Loss). This is the profit or loss from a trade you’ve already closed. It’s the money you’ve either made or lost, plain and simple.
Your Realized PnL is the ultimate source of truth. It cuts through market noise and tells you exactly what a specific trade returned after all the dust settled and the fees were paid.
The formula itself is straightforward. For any single trade, you can figure out your profit with this simple equation:
(Sell Price - Buy Price) - Total Fees = Realized Profit
Let's run through a quick, real-world example. Imagine you bought 1 ETH for $3,000. A few weeks later, you sell it for $3,500. Along the way, you racked up $50 in various fees (exchange commissions, gas, etc.).
Here’s how the math breaks down:
($3,500 - $3,000) - $50 = $450Your realized profit is $450. Even though the price jumped by $500, your actual take-home gain was chipped away by fees. It's a crucial detail that trips up many new traders.
This flowchart breaks down the main costs—trade fees, gas, and slippage—that you have to subtract to find your true profit.
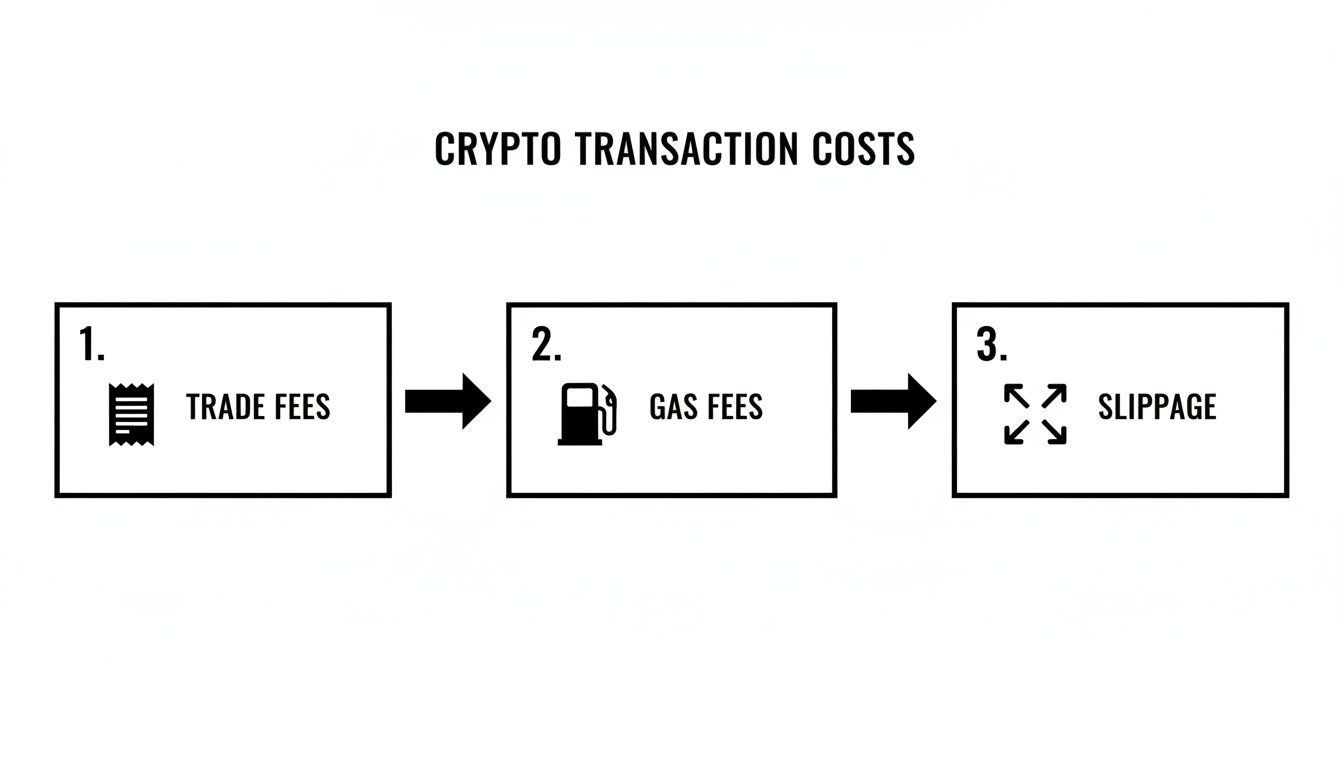
This is exactly why just looking at the price chart isn’t enough. Every single fee is a direct hit to your bottom line.
To make things easier, here's a quick reference table with the key formulas we're discussing.
MetricFormulaActionable TipRealized Profit(Sell Price - Buy Price) - FeesThis is your actual, take-home profit. Use it for tax reporting.Unrealized Profit(Current Price - Avg. Entry) * QuantityMonitor this to know when a position is profitable enough to consider selling.Cost Basis(Buy Price * Quantity) + FeesYour true "break-even" point. You must sell above this price to profit.Net ProfitTotal Realized Gains - Total Realized LossesThe ultimate measure of your trading performance over a specific period.
Keep these handy as you review your portfolio; they are the foundation of accurate performance tracking.
Next up is Unrealized PnL. This is your "paper" profit or loss on assets you still own. It’s the potential gain you’d lock in if you sold at the current market price, and it’s a vital metric for monitoring your portfolio's health.
The calculation for this is: (Current Market Price - Average Entry Price) * Quantity Held
The key piece of that puzzle is your Average Entry Price. If you buy an asset multiple times at different prices—a common strategy known as dollar-cost averaging—you need this number to figure out your true break-even point. While good tools can automate this, understanding the concept is crucial. If you want to go deeper, check out our guide on the crypto average calculator.
Calculated plays, based on solid data, often pay off. Between 2011 and 2025, Bitcoin had positive monthly returns 56% of the time. But the real story is in the volatility—spikes like the 451.2% jump in November 2013 show just how massive the gains can be. This wild price action makes tracking your entry points all the more critical for success.
Most traders never think about cost basis until tax season. By then, it's too late. The method you choose for calculating which coins you sold can swing your tax bill by thousands of dollars—and it's a choice you're making whether you realize it or not.
In the US, the IRS lets you pick between multiple cost basis methods. Each one calculates your profit differently when you sell only some of your holdings. And here's the kicker: once you choose a method for a specific wallet or exchange, you're locked into it for that wallet going forward.
This isn't abstract tax theory. This is real money leaving your pocket because you didn't understand the math before you sold.
FIFO is what most exchanges and tax software default to. It assumes you always sell your oldest coins first. Sounds innocent enough, right?
Wrong. FIFO will destroy you in a bull market.
Real scenario: You bought 1 BTC at $20,000 in 2022. Then you bought another 1 BTC at $60,000 in 2024. Bitcoin hits $100,000 in early 2025 and you sell 1 BTC to take profits.
Under FIFO, the IRS assumes you sold your 2022 coin (the oldest). Your taxable gain is $80,000 ($100,000 - $20,000). If it's short-term gains (held less than a year), you could owe $29,600 in taxes at a 37% rate.
But what if you could choose to sell the 2024 coin instead? Your gain would only be $40,000 ($100,000 - $60,000). Tax bill: $14,800. You just saved $14,800 by understanding cost basis.
FIFO is a disaster for long-term holders who've been accumulating during bear markets. Your earliest, cheapest coins get sold first, maximizing your taxable gains.
LIFO is the opposite. It assumes you sell your newest coins first. This is the method wealthy traders use during bull runs to minimize taxes.
Using the same example: selling under LIFO means you sold the 2024 coin ($60,000 cost basis). Taxable gain: $40,000 instead of $80,000. Immediate tax savings.
The catch: LIFO can backfire in a bear market. If you bought the top and are selling at a loss, LIFO gives you smaller losses to deduct. But during sustained bull markets, LIFO is the profit-maximizing choice for active traders.
Most importantly, LIFO is allowed in the US for crypto (unlike stocks, which are FIFO-only unless you specifically identify shares). You're leaving money on the table if you don't at least run the numbers both ways.
HIFO is the nuclear option for minimizing taxes. It assumes you always sell the coins with the highest cost basis first, regardless of when you bought them.
Back to our example with three BTC purchases: $20K, $60K, and $100K. You sell 1 BTC when the price hits $100K.
HIFO says you sold the coin you bought at $100K. Cost basis: $100,000. Sale price: $100,000. Taxable gain: $0.
You just eliminated your entire tax bill legally. This is why sophisticated traders obsess over cost basis methods.
The IRS allows HIFO for crypto as long as you can specifically identify which coins you're selling at the time of the transaction. This requires meticulous record-keeping and a tax platform that supports it (like Koinly, CoinLedger, or TokenTax).
Most traders never bother with this level of optimization. The ones who do save five figures on taxes every single year.
Figuring out the profit on a single coin flip is easy. But what about a portfolio with dozens of tokens scattered across Ethereum, Solana, and multiple Layer 2 networks? That’s when things get complicated, and where most traders lose the plot on their actual performance.
The complexity multiplies with every new chain you add to the mix.
To get a real grip on your numbers, you need a single source of truth. Without a unified view, you're just guessing. This is where manual tracking methods like spreadsheets completely fall apart—buried under a mountain of transaction data from separate ecosystems.
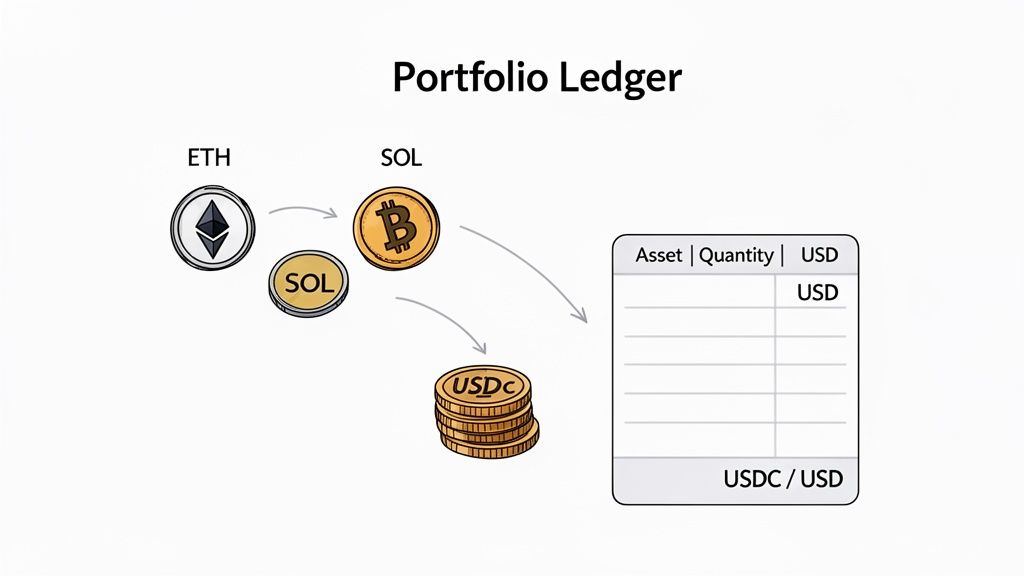
To paint a clear picture of your total gains, you need a common denominator. The only way to do this right is to convert the value of all your holdings into a single, stable unit. This lets you compare apples to apples, whether you’re looking at a degen play on Base or your long-term Bitcoin stack.
You have two solid options here:
Just pick one and stick with it. Consistency is everything when you're trying to build an accurate history of how your portfolio has performed over time.
Think of a master ledger as your command center. It pulls every single transaction from every wallet and chain into one consolidated view. While you could build one manually in a spreadsheet, it’s a soul-crushing amount of work and incredibly easy to mess up. You'd be pulling data from Etherscan, Solscan, and a dozen other block explorers, then painstakingly converting values and accounting for fees.
The whole point of a master ledger is to see the entire battlefield. It shows you which assets are actually driving your growth and which are dragging you down, no matter where they're held.
This is where automation becomes a game-changer. Tools that automatically aggregate this data are essential for any serious trader. Without them, you end up spending more time on bookkeeping than market analysis. You can learn more in our guide on how to track wallet profits across blockchains.
Long-term holders see massive benefits from meticulous tracking because it reveals the true power of compounding. For instance, over the 14 years leading up to 2025, Bitcoin's ROI hit a mind-boggling 1.4 million%. Even a five-year hold during that time averaged 115% annually, completely demolishing traditional assets. Data from sources like CaseBitcoin.com proves this. An accurate ledger makes these long-term wins crystal clear.
Standard buy-and-sell trades are easy. But crypto has evolved into a complex ecosystem with profit scenarios that traditional finance never imagined. These edge cases trip up even experienced traders, turning what looks like a win into a tax nightmare.
Understanding these calculations isn't optional if you're serious about maximizing your take-home returns.
You wake up one morning and find 1,000 new tokens in your wallet from an airdrop. Congrats, free money! Except it's not free from a tax perspective, and calculating the profit correctly is trickier than you think.
The IRS treats airdrops as ordinary income at the moment you receive them. Your cost basis is the fair market value on that exact date. If those 1,000 tokens were worth $0.50 each when they landed in your wallet, you owe income tax on $500 immediately—even if you never sold them.
Fast forward six months. The token pumps to $5. You sell 500 tokens for $2,500. Your profit isn't $2,500. Your cost basis was $250 (500 tokens × $0.50). Your taxable capital gain is $2,250 ($2,500 - $250).
But here's where it gets messy: you already paid income tax on $250 of that value. So your total tax burden on this airdrop is:
That's a 21-41% effective tax rate on what felt like "free" money. Most traders completely miss the initial income tax obligation and get destroyed when the IRS comes knocking years later.
The same logic applies to hard forks. When Ethereum split from Ethereum Classic in 2016, every ETH holder instantly received an equal amount of ETC. That was taxable income at the moment of the fork, even though nobody asked for it.
NFTs obliterate traditional profit formulas because every one is unique. You can't dollar-cost average into Bored Apes. You can't sell "part" of an NFT. And the fees can eclipse the sale price on small transactions.
Real example: You buy an NFT for 2 ETH ($6,000) on OpenSea. You pay a 2.5% marketplace fee ($150) and $80 in gas fees. Your true cost basis is $6,230, not $6,000.
Six months later, the floor price is 4 ETH ($14,000). You list it and someone bids 3.8 ETH ($13,300). You pay another 2.5% fee ($332) and $90 in gas to transfer. Your net proceeds: $12,878.
Realized profit: $12,878 - $6,230 = $6,648.
But wait. During those six months, ETH went from $3,000 to $3,500. So your 2 ETH cost basis is now worth $7,000. If you'd just held the ETH, you'd have made $1,000 with zero fees.
Your NFT "profit" of $6,648 actually underperformed holding ETH by $5,648 ($7,000 ETH appreciation + $6,648 NFT profit = $13,648 vs. $7,000 from holding).
This is why calculating NFT profit in fiat terms is misleading. You need to track the opportunity cost of what you spent to buy it. Most NFT traders ignore this and vastly overestimate their gains.
You buy a new memecoin for $5,000. Two weeks later, the developers drain the liquidity and the token goes to zero. You have a $5,000 loss, right?
Not from a tax perspective—not yet.
The IRS doesn't recognize a loss until you dispose of the asset. Just holding a worthless token doesn't count. You have to actually sell it or abandon it to claim the loss.
The problem: many rug pulled tokens have zero liquidity. You literally cannot sell them because there are no buyers. The "sell" button doesn't work.
To claim the loss, you need to either:
Most traders never bother. They just leave the dead tokens in their wallet and miss out on thousands in tax loss deductions.
Real case: you got rugged for $5,000. You also made $20,000 in profitable trades this year. Without claiming the rug pull loss, you owe taxes on $20,000 in gains. With the loss? You only owe taxes on $15,000 in net gains. That's $750-$1,850 in tax savings (depending on your bracket) you're leaving on the table by not selling the dead token for $0.01.
This is why you should always force a taxable event on rugged tokens before December 31st. The one-cent swap saves you real money.
Once you dive into Decentralized Finance (DeFi), the simple buy-sell formulas don't cut it. DeFi strategies are far more dynamic, creating complex profit scenarios that demand a much sharper pencil to track accurately. If you want to calculate your crypto profit in DeFi, you have to get comfortable with unique mechanics that don't exist in traditional trading.
These advanced strategies can offer incredible returns but also bring their own risks and hidden costs. From providing liquidity to earning staking rewards, every activity requires a specific calculation method to show you what's really going on. Get this wrong, and you could be leaking value without even noticing.
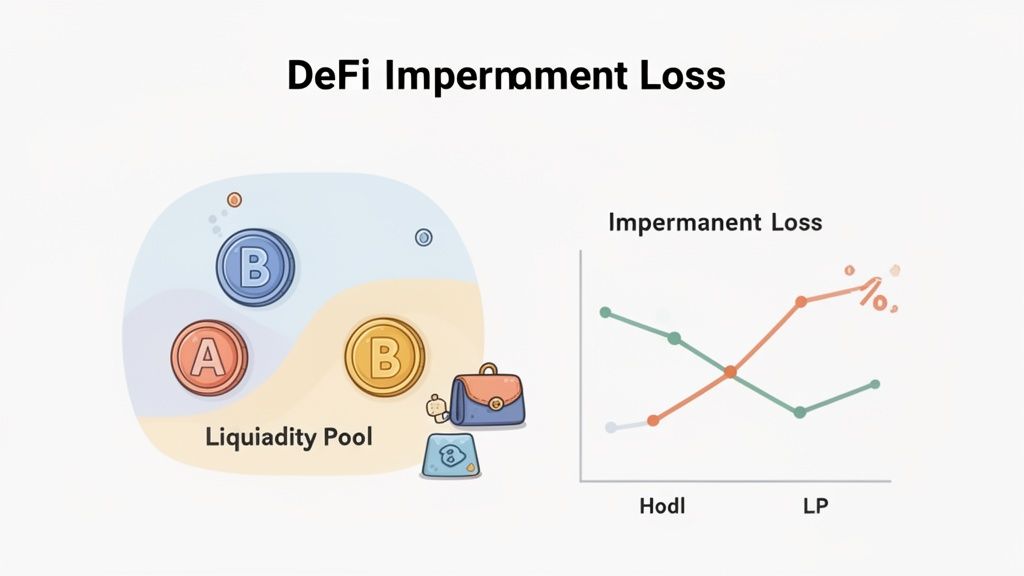
One of the most misunderstood concepts in DeFi is Impermanent Loss (IL). It's a risk you take when you provide liquidity to a decentralized exchange (DEX) like Uniswap by depositing a pair of assets (like ETH and USDC). If the price of one asset changes dramatically compared to the other, the total value of your deposited funds can end up being less than if you had just held them.
This "loss" only becomes real—or realized—when you pull your liquidity out. For instance, if ETH moons while your funds are in an ETH/USDC pool, the automated market maker (AMM) rebalances your position. You'll end up with less ETH and more USDC than you started with. Sure, you might still be profitable overall from trading fees, but IL can take a serious bite out of your gains.
Impermanent Loss is the silent profit killer for liquidity providers. You can feel like you’re winning because token prices are up and you're earning fees, but IL might be quietly erasing a huge chunk of those gains behind the scenes.
On the surface, staking and yield farming seem simple: lock up your tokens and get more tokens as a reward. But calculating your actual return on investment (ROI) is about more than just counting the new tokens in your wallet.
To get the real picture, you must track:
It's a classic mistake to only focus on the advertised Annual Percentage Yield (APY). A 50% APY is worthless if the price of the reward token crashes by 80%. The only way to know your true profit is to meticulously track every cost against the final, realized value of your rewards. It’s all about net profit, not the gross rewards you see piling up.
Think about the life-changing profits made by early Bitcoin holders. Back in 2010, the coin never traded above $0.40, yet it delivered an eye-watering 30,203% return by the end of the year. That would have turned a $1,000 investment into over $300,000. You can read more about Bitcoin's legendary price history on Bankrate.com. While DeFi opens up new ways to generate yield, understanding fundamental profit calculation is just as critical today.
Let's be honest: manually tracking every single trade, fee, and reward across a handful of wallets and chains is a nightmare. It’s not just a grind; it’s a setup for failure. Human error is almost guaranteed, which can paint a completely false picture of your performance.
When you're trying to calculate profit cryptocurrency accurately, one forgotten gas fee or a single mis-entered trade can be the difference between thinking you’re in the green and realizing you're actually down.
This is exactly why automation isn't a luxury—it's essential. A good tool takes the guesswork and hours of painful spreadsheet work off your plate, freeing you up to focus on strategy instead of bookkeeping.
This is where tools like Wallet Finder.ai come in. Instead of wrestling with block explorers and spreadsheets, you can securely connect your wallets and let the platform do its job. It automatically pulls your entire transaction history—every buy, sell, swap, and fee—from all your chains into one clean, unified dashboard.
Getting this kind of instant clarity is nearly impossible by hand. The platform crunches all the numbers for you, calculating the most critical metrics to give you an immediate, data-backed view of your trading health.
By automating PnL tracking, you move from reactive bookkeeping to proactive analysis. You stop wasting time figuring out what happened and start spending time understanding why it happened—and what to do next.
Take a look at this dashboard from Wallet Finder. It visualizes your entire portfolio’s performance in one place.
You can see your total realized PnL, unrealized gains, win rate, and even your average holding time, all updated in real-time. No manual input is required.
True automation is about more than just tracking your numbers. The real edge comes from seeing what’s working for other successful wallets in the market right now. If you’re doing things manually, this kind of competitive analysis is a pipe dream.
Wallet Finder flips this on its head. It lets you analyze the PnL and complete trading history of top-performing wallets. You can see their exact wins, their losses, and the strategies they used, turning their proven success into a source of actionable signals.
This gives you a few massive advantages:
At the end of the day, using a powerful tool to automate your calculations is the only way to manage a modern crypto portfolio without going insane. It gets rid of costly errors, saves countless hours, and delivers market insights that give you a genuine competitive edge—all without ever opening another spreadsheet.
Once you start using leverage or running arbitrage across multiple exchanges, basic profit formulas shatter. You're no longer just tracking buy and sell prices. You're tracking borrowed capital, funding rates, liquidation risks, and price discrepancies that exist for seconds.
These strategies can be incredibly profitable, but the profit calculation complexity increases exponentially.
Leverage amplifies both your gains and your losses. A 10x leveraged Bitcoin long means you control $100,000 of BTC with just $10,000 of your own capital. If Bitcoin goes up 5%, you don't make $5,000—you make $50,000 (minus fees and interest). But if it drops 5%, you're liquidated and lose your entire $10,000.
Calculating profit on leverage requires tracking:
Initial Margin: The capital you actually deposited ($10,000)Position Size: The total value you control ($100,000 at 10x leverage)Entry Price: BTC at $100,000Exit Price: BTC at $105,000Borrowing Fees: The interest you paid on the borrowed $90,000 (often 0.01-0.03% per day)Funding Rate: On perpetual futures, you pay or receive a funding rate every 8 hoursTrading Fees: Opening and closing fees (typically 0.02-0.1% each)
Real calculation:
That's a 47.56% return on your $10,000 initial capital in three days. But if the trade went against you by the same 5%, you'd have lost your entire $10,000 plus the fees.
Most traders only look at the position's PnL and forget about the fees. On short-term leveraged trades, fees can eat 20-50% of your gross profit.
Arbitrage seems simple: buy BTC on Exchange A for $99,500, immediately sell on Exchange B for $100,000, pocket $500. Easy money, right?
Wrong. The profit calculation for arbitrage is a nightmare because you're making four simultaneous transactions:
Transaction 1: Deposit USD to Exchange ATransaction 2: Buy BTC on Exchange A ($99,500 + 0.1% fee = $99,600)Transaction 3: Withdraw BTC from Exchange A to Exchange B ($25 network fee)Transaction 4: Sell BTC on Exchange B ($100,000 - 0.1% fee = $99,900)
Gross profit: $100,000 - $99,500 = $500Actual profit: $99,900 - $99,600 - $25 = $275
That's a 45% reduction in expected profit from fees alone. And we haven't even counted:
On a $100,000 arbitrage opportunity, these costs can turn a $500 paper profit into a $50 actual profit or even a net loss.
The only way to know if arbitrage is profitable is tracking the all-in cost of every step. Most beginners see the spread, execute the trade, and then wonder why they didn't make money.
If you're running MEV (Maximal Extractable Value) bots, your profit calculation includes variables that don't exist in normal trading:
Gas auctions: You're bidding against other bots, paying 10-100x normal gas fees to get your transaction prioritizedFailed transactions: Many MEV attempts fail, and you still pay gasBribes to validators: On some chains, you pay validators directly to include your transaction firstBlock uncle risk: Your profitable transaction might land in an uncle block and never execute
A successful MEV sandwich attack might look like this:
Your success rate might be 1 in 10. So that one $100 profit has to offset nine $20 losses. Real MEV profit requires tracking hundreds of attempts to calculate true profitability.
Most MEV bot operators lose money for months before they optimize enough to become profitable. Without rigorous transaction-level tracking, you'll never know why.
Yes. This is one of the most dangerous misconceptions in crypto. There is no minimum threshold for reporting capital gains to the IRS. If you made $1 in profit, you technically owe taxes on it.
The $600 rule that confuses everyone is for 1099-K forms from exchanges. Starting in 2024, exchanges must send you (and the IRS) a 1099-K if you have over $600 in gross transactions. But this is a reporting requirement for the exchange, not a tax threshold for you.
Even if you made $100 in profit and never received a 1099, you're still required to report it on your tax return. The IRS has been absolutely clear on this. Getting caught underreporting (even small amounts) can trigger an audit of your entire trading history.
The smart play: report everything. The penalties for not reporting far exceed the tax on small gains.
Staking rewards are treated as ordinary income (like a paycheck) at the moment you receive them, not when you sell them. This creates a two-part tax event.
Example: You stake 10 ETH on Coinbase at 4% APY. Over a year, you earn 0.4 ETH in rewards.
Tax Event 1 (Income Tax):
Tax Event 2 (Capital Gains Tax):
Total tax on your staking rewards: $288 + $60 = $348 on $1,600 in total value. That's a 21.75% effective tax rate.
Most stakers forget about the income tax component and only calculate capital gains. Then they get an IRS notice demanding back taxes plus penalties.
This is where profit tracking becomes genuinely complex. The IRS doesn't care about wallets—they care about you as an individual taxpayer. All your wallets are treated as one big pot for tax purposes.
Scenario: You buy 1 BTC for $30,000 in Wallet A. You transfer it to Wallet B (not taxable—just a transfer to yourself). You swap it for 15 ETH in Wallet B when BTC is at $60,000 (taxable event: $30,000 gain). You transfer the ETH to Wallet C. You sell the ETH for $45,000 in stablecoins.
Your profit calculation requires tracking across all three wallets:
Net taxable gain: $30,000 - $15,000 = $15,000
If you're manually tracking in a spreadsheet, you'd need to reconcile transactions across all three wallets, matching dates and transfer amounts. One mistake—like forgetting you transferred BTC from A to B and thinking you sold it—can create phantom gains or losses.
This is why automated portfolio trackers that consolidate all wallets are essential. Trying to do this manually with 5+ wallets and 100+ transactions is begging for errors.
Yes, absolutely. Capital losses from crypto can offset capital gains dollar-for-dollar, and you can even deduct up to $3,000 per year in net losses against your ordinary income.
Real example: You made $50,000 in gains on winning trades and lost $60,000 on losing trades. Your net loss is $10,000.
You can:
This is why recognizing losses (especially on rug pulls and dead tokens) is so important. Those losses have real monetary value as tax deductions.
The catch: you must actually sell or dispose of the asset to realize the loss. Just holding something that's down doesn't count. You have to trigger the taxable event by selling, swapping, or abandoning it.
When you receive crypto as payment (like a freelancer getting paid in BTC), it's treated as ordinary income equal to the fair market value when you received it. This becomes your cost basis.
Example: You did consulting work and got paid 0.5 BTC when Bitcoin was at $60,000. That's $30,000 in ordinary income. You owe income tax on $30,000 just like if you'd been paid in cash.
Your cost basis for that 0.5 BTC is now $30,000.
Six months later, Bitcoin hits $80,000 and you sell your 0.5 BTC for $40,000. Your capital gain is $10,000 ($40,000 - $30,000). You owe capital gains tax on the $10,000.
Total tax bill:
This is dramatically different from if you'd just bought BTC as an investment. The income tax component catches freelancers off guard. Many think they only owe tax when they sell, but the IRS wants their cut the moment you receive it.
Realized profit is money you've actually locked in by selling. Unrealized profit is paper gains on assets you still hold. The IRS only taxes realized profits.
This distinction matters enormously for planning. Say you bought $10,000 of ETH that's now worth $100,000. You have $90,000 in unrealized gains. As long as you don't sell, you owe zero tax.
But the moment you sell even $1,000 of that ETH, you realize a proportional gain and owe taxes immediately (due the following April, or quarterly if you're supposed to pay estimated taxes).
Strategic traders use this to their advantage. If you're in a high-income year, you avoid realizing gains to defer taxes. If you're in a low-income year (or retired), you realize gains to pay tax at a lower rate.
Unrealized gains also matter for risk management. If your portfolio is up 500% but it's all unrealized, you could lose everything in a crash and owe zero tax. But if you've been taking profits throughout the year and those gains are realized, you owe the tax even if your remaining holdings crash to zero.
This is why timing your sales matters. Professional traders plan their realized vs unrealized balance to optimize taxes and manage risk.
Stop guessing and start knowing. Wallet Finder.ai automates your entire profit calculation process, giving you crystal-clear insights into your performance and revealing the strategies of top traders. Start your free 7-day trial today and see your real PnL in minutes.

A premier DeFi analytics platform empowering traders to discover and analyze profitable blockchain wallets, trades and tokens.

